| Param | Original file | Final file |
|---|---|---|
| Filename | modeM0/AS1A14_099T01_9000006536_55517cztM0_level2.fits | modeM0/AS1A14_099T01_9000006536_55517cztM0_level2_quad_clean.evt |
| Size (bytes) | 375,845,760 | 88,113,600 |
| Size | 358.4 MB | 84.0 MB |
| Events in quadrant A | 2,887,527 | 587,185 |
| Events in quadrant B | 4,275,637 | 565,628 |
| Events in quadrant C | 2,759,551 | 561,969 |
| Events in quadrant D | 3,512,218 | 525,723 |
| Mode M9 | |||
|---|---|---|---|
| Quadrant | BADHDUFLAG | Total packets | Discarded packets |
| A | 0 | 11 | 0 |
| B | 0 | 11 | 0 |
| C | 0 | 11 | 0 |
| D | 0 | 11 | 0 |
| Mode SS | |||
|---|---|---|---|
| Quadrant | BADHDUFLAG | Total packets | Discarded packets |
| A | 0 | 124 | 0 |
| B | 0 | 124 | 0 |
| C | 0 | 124 | 0 |
| D | 0 | 124 | 0 |
| Mode M0 | |||
|---|---|---|---|
| Quadrant | BADHDUFLAG | Total packets | Discarded packets |
| A | 0 | 13185 | 1 |
| B | 0 | 17421 | 8 |
| C | 0 | 12933 | 1 |
| D | 0 | 14831 | 3 |
| Quadrant | Total seconds | Saturated seconds | Saturation percentage |
|---|---|---|---|
| A | 6126 | 126 | 2.056807% |
| B | 6125 | 787 | 12.848980% |
| C | 6127 | 58 | 0.946630% |
| D | 6126 | 127 | 2.073131% |
Noise dominated data is calculated using 1-second bins in cleaned event files. If a bin has >2000 counts, and if more than 50% of those come from <1% of pixels, then it is considered to be noise-dominated and hence unusable.
| Quadrant | # 1 sec bins | Bins with >0 counts | Bins with >2000 counts | High rate bins dominated by noise | Noise dominated (total time) | Noise dominated (detector-on time) | Marked lightcurve |
|---|---|---|---|---|---|---|---|
| A | 7206 | 6127 | 46 | 46 | 0.64% | 0.75% | 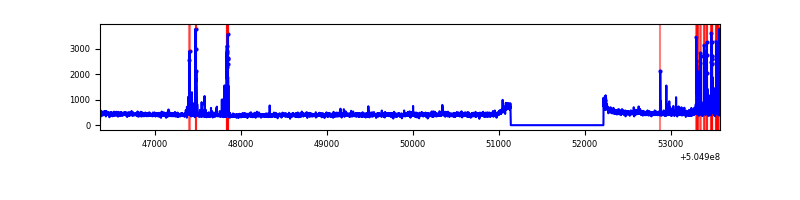 |
| B | 7205 | 6126 | 566 | 566 | 7.86% | 9.24% | 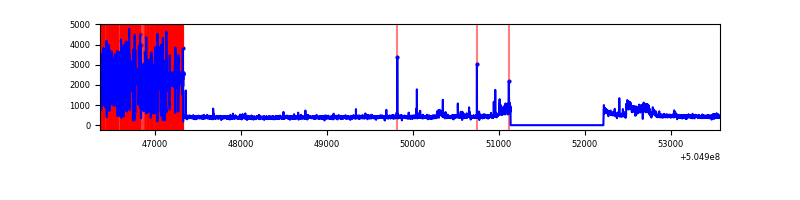 |
| C | 7207 | 6128 | 12 | 12 | 0.17% | 0.20% | 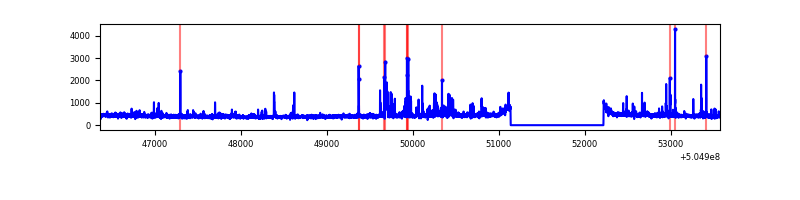 |
| D | 7207 | 6128 | 65 | 65 | 0.90% | 1.06% | 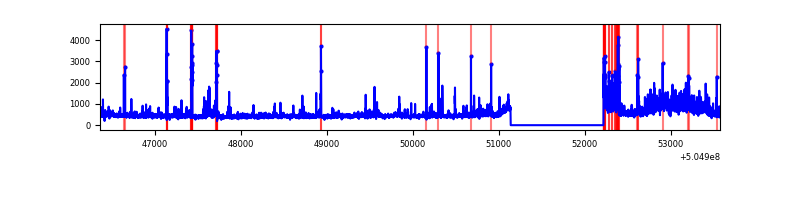 |
Top three noisy pixels from each quadrant. If the there are fewer than three noisy pixels in the level2.evt file, extra rows are filled as -1
| Pixel properties | Quadrant properties | ||||||
|---|---|---|---|---|---|---|---|
| Quadrant | DetID | PixID | Counts | Sigma | Mean | Median | Sigma |
| A | 0 | 8 | 255374 | 1570.42 | 656 | 639 | 162.2 |
| A | 0 | 31 | 33372 | 201.8 | 656 | 639 | 162.2 |
| A | 3 | 14 | 14235 | 83.82 | 656 | 639 | 162.2 |
| B | 5 | 172 | 1851235 | 14532.02 | 600 | 580 | 127.4 |
| B | 10 | 247 | 23908 | 183.18 | 600 | 580 | 127.4 |
| B | 12 | 111 | 15266 | 115.32 | 600 | 580 | 127.4 |
| C | 13 | 3 | 109594 | 629.38 | 632 | 625 | 173.1 |
| C | 9 | 38 | 43217 | 246.0 | 632 | 625 | 173.1 |
| C | 15 | 178 | 41980 | 238.86 | 632 | 625 | 173.1 |
| D | 7 | 70 | 429823 | 2424.59 | 629 | 598 | 177.0 |
| D | 10 | 181 | 151278 | 851.16 | 629 | 598 | 177.0 |
| D | 2 | 153 | 147391 | 829.2 | 629 | 598 | 177.0 |
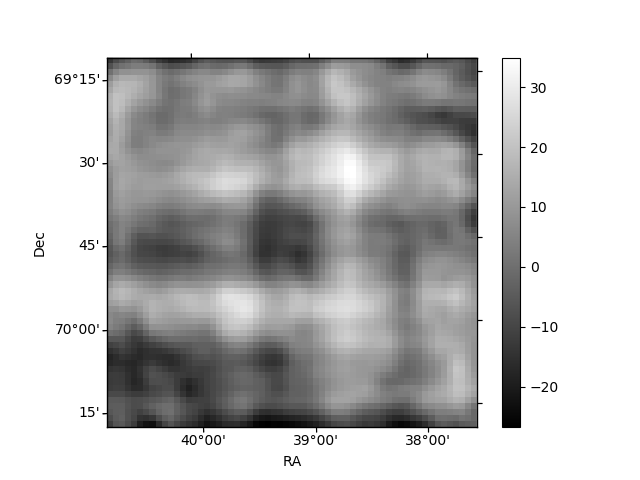
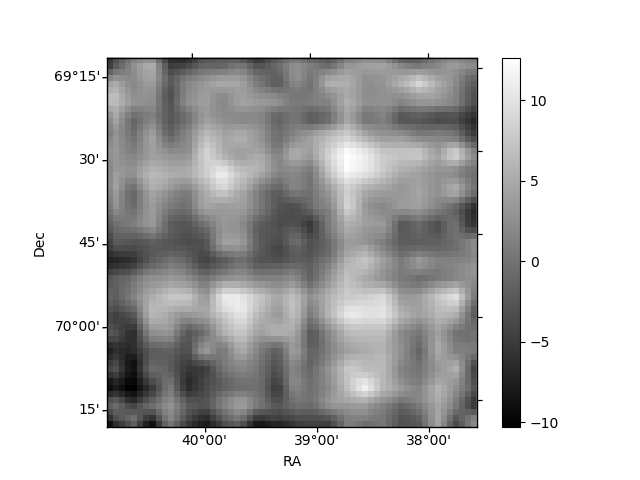
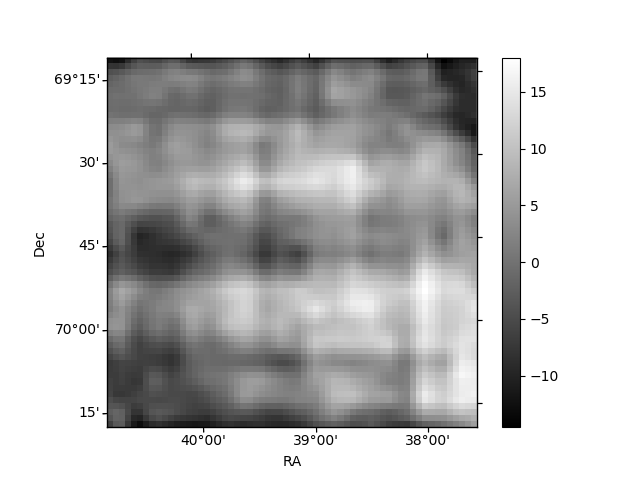
Histogram calculated using DETX and DETY for each event in the final _common_clean file
| Quadrant A | 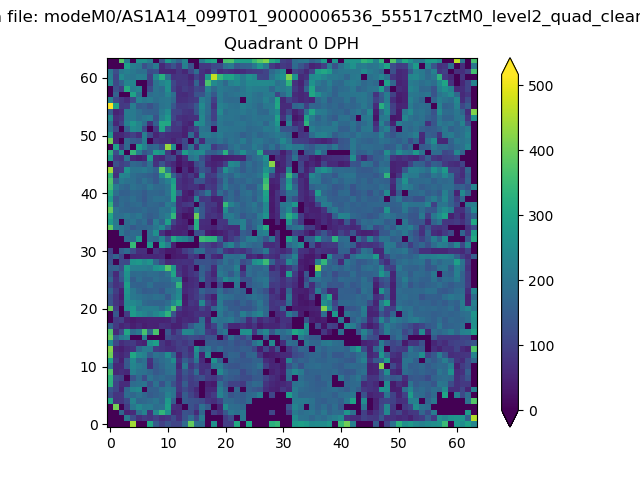 |
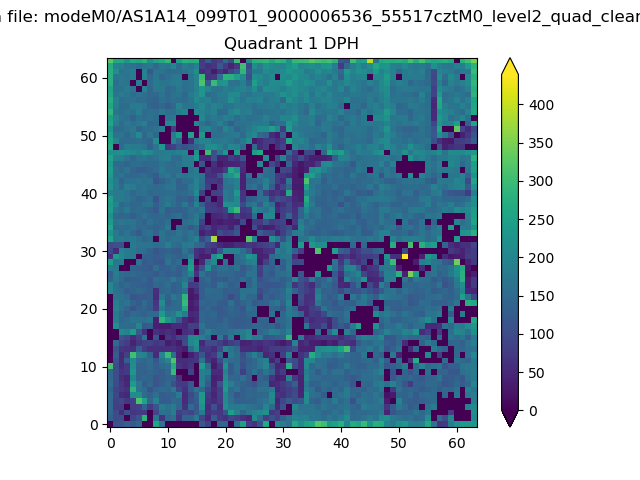 |
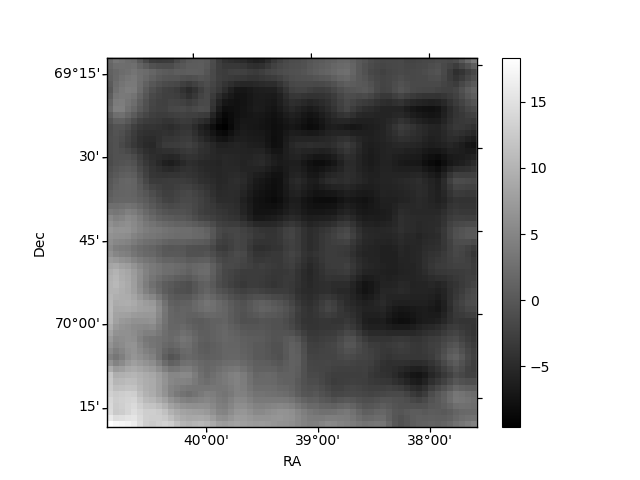
Quadrant B |
|---|---|---|---|
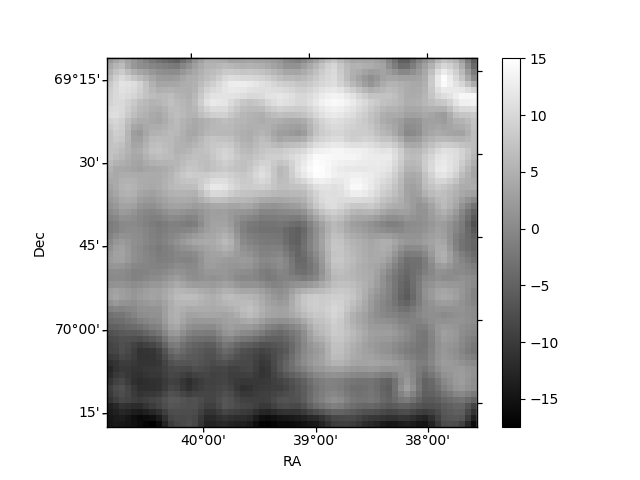
| Quadrant D | 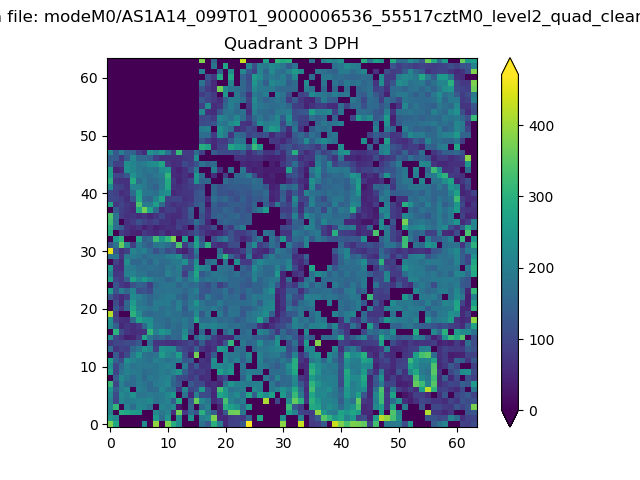 |
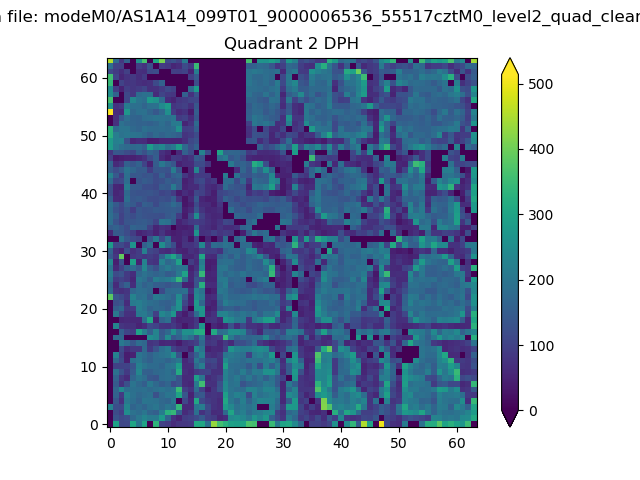 |
Quadrant C |
| Plot type | Count rate plots | Images |
|---|---|---|
| Comparison with Poisson distribution Blue bars denote a histogram of data divided into 1 sec bins. Red curve is a Poisson curve with rate = median count rate of data. |
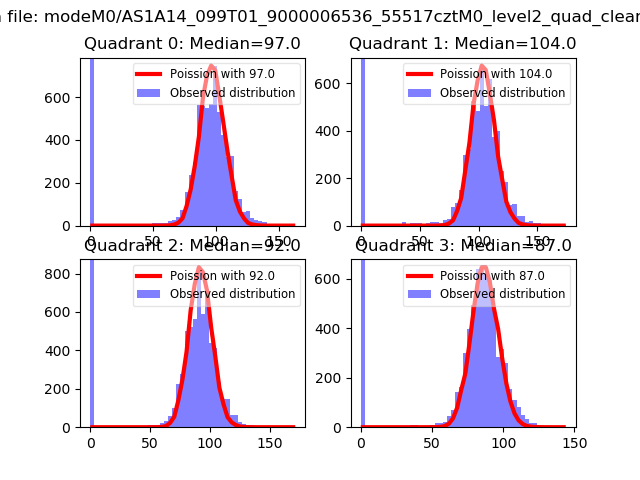 |
 |
| Quadrant-wise count rates Data is divided into 100 sec bins |
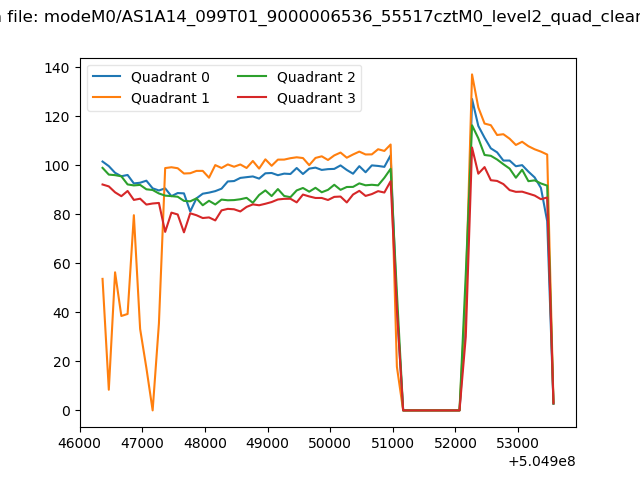 |
|
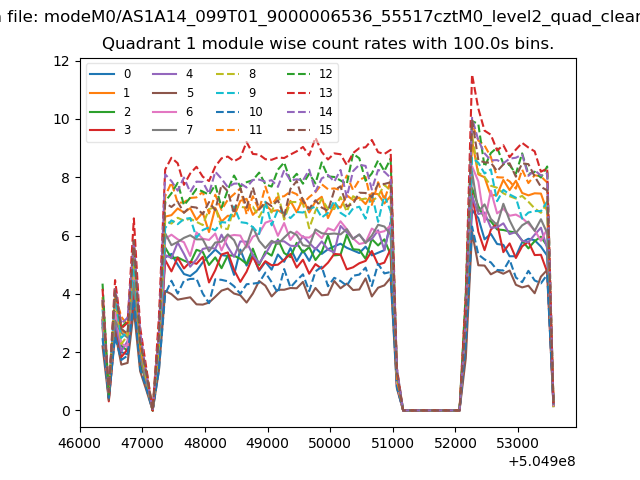
| Module-wise count rates for Quadrant A Data is divided into 100 sec bins |
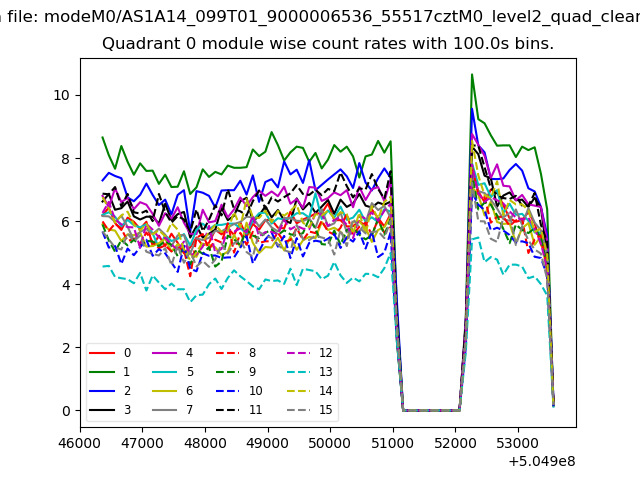 |
 |
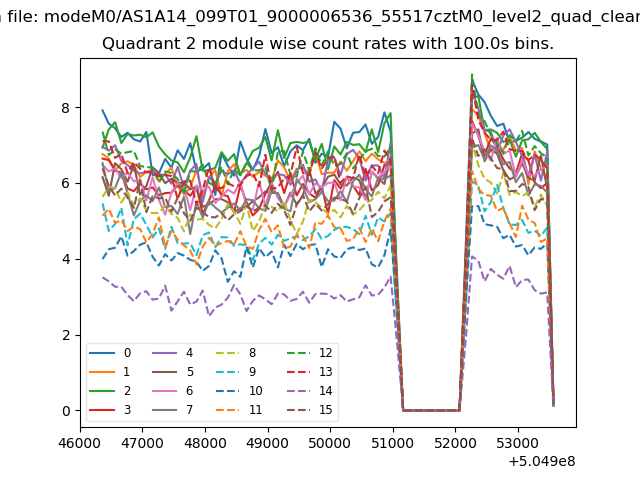
| Module-wise count rates for Quadrant B Data is divided into 100 sec bins |
 |
 |
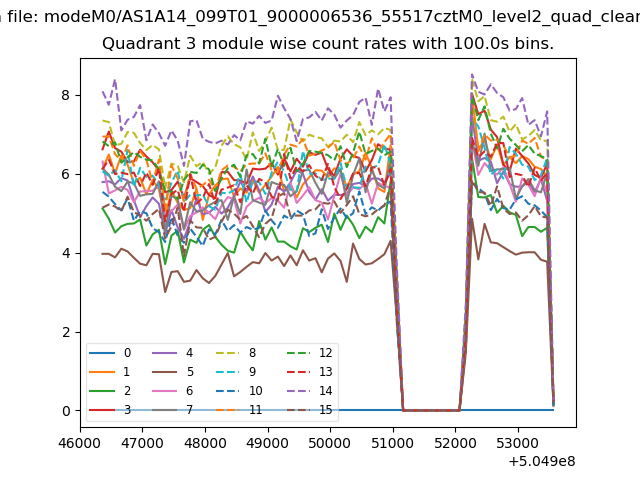
| Module-wise count rates for Quadrant C Data is divided into 100 sec bins |
 |
 |
| Module-wise count rates for Quadrant D Data is divided into 100 sec bins |
 |
 |
| Parameter | Plot |
|---|---|
| CZT HV Monitor | 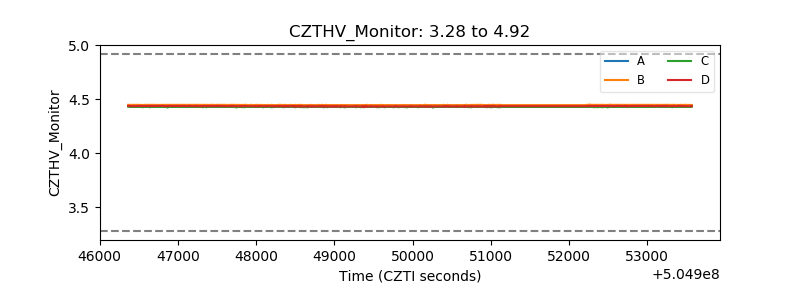 |
| D_VDD | 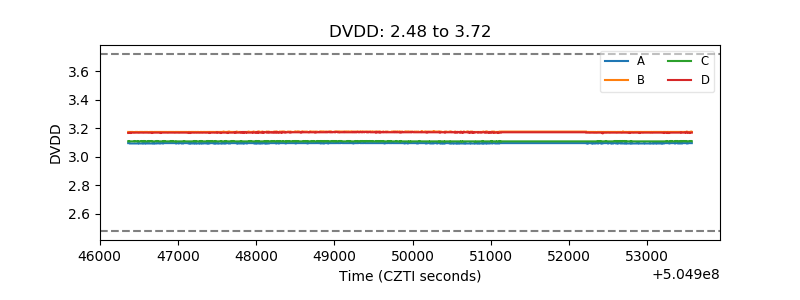 |
| Temperature 1 | 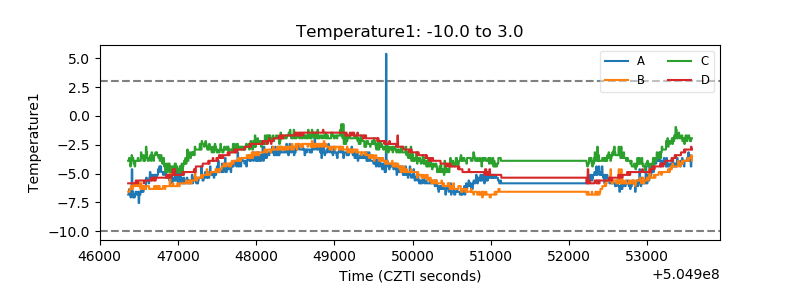 |
| Veto HV Monitor | 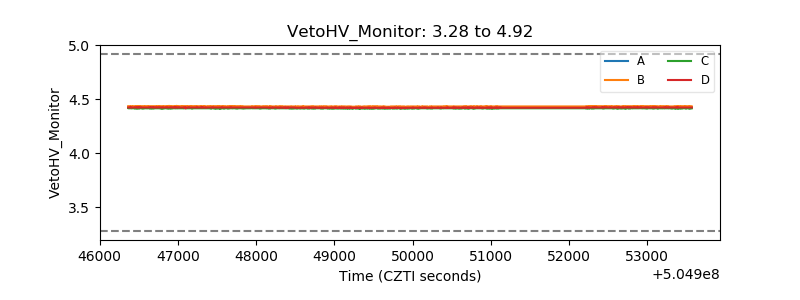 |
| Veto LLD | 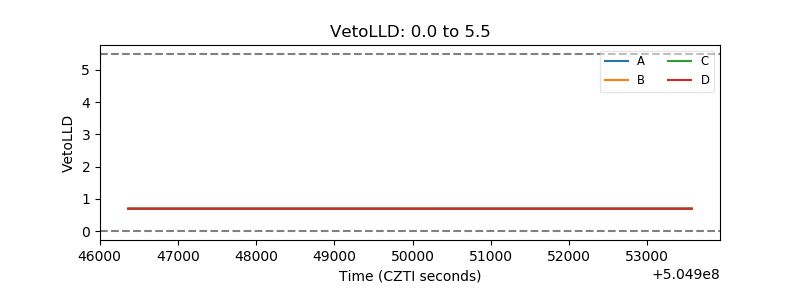 |
| Alpha Counter | 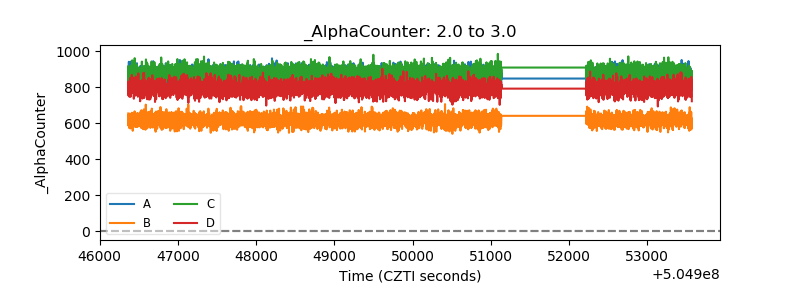 |
| _CPM_Rate | 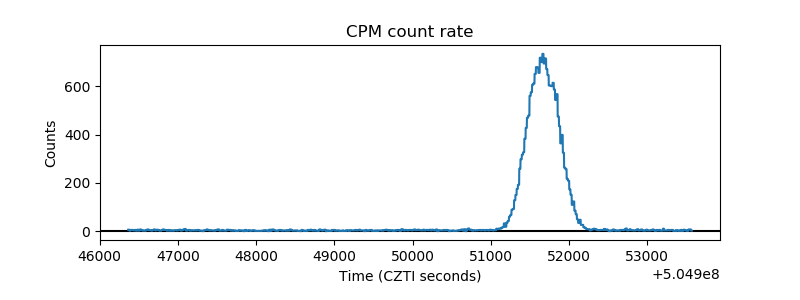 |
| CZT Counter | 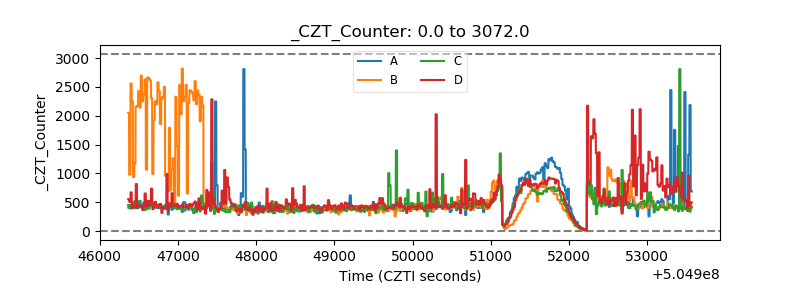 |
| +2.5 Volts monitor |  |
| +5 Volts monitor |  |
| _ROLL_ROT | 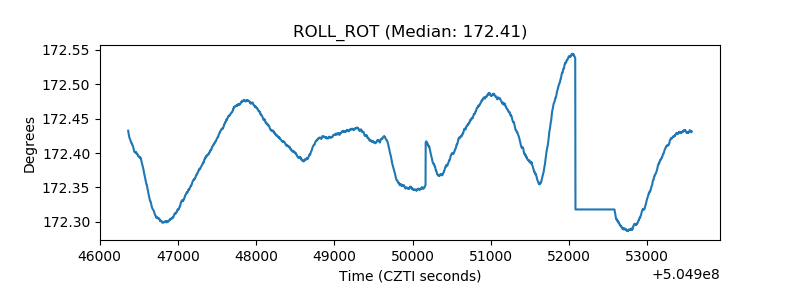 |
| _Roll_DEC | 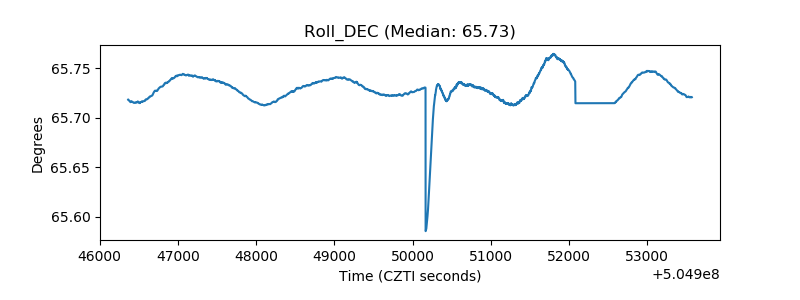 |
| _Roll_RA | 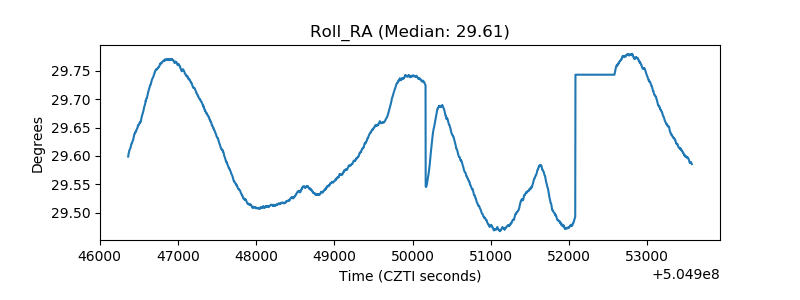 |
| Veto Counter | 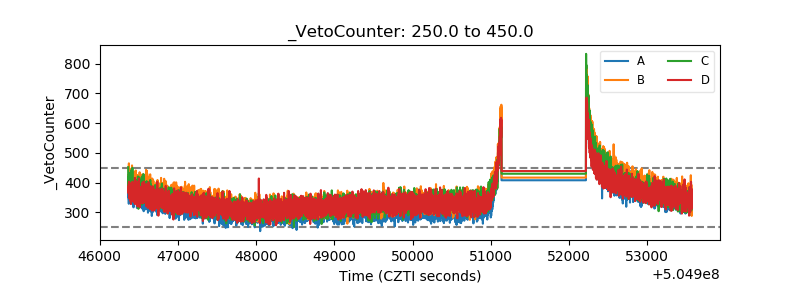 |