| Param | Original file | Final file |
|---|---|---|
| Filename | modeM0/AS1A14_099T01_9000006536_55519cztM0_level2.fits | modeM0/AS1A14_099T01_9000006536_55519cztM0_level2_quad_clean.evt |
| Size (bytes) | 394,012,800 | 98,196,480 |
| Size | 375.8 MB | 93.6 MB |
| Events in quadrant A | 3,354,936 | 649,911 |
| Events in quadrant B | 3,098,071 | 691,446 |
| Events in quadrant C | 3,241,649 | 608,831 |
| Events in quadrant D | 4,385,477 | 570,833 |
| Mode M9 | |||
|---|---|---|---|
| Quadrant | BADHDUFLAG | Total packets | Discarded packets |
| A | 0 | 11 | 0 |
| B | 0 | 12 | 0 |
| C | 0 | 12 | 0 |
| D | 0 | 12 | 0 |
| Mode SS | |||
|---|---|---|---|
| Quadrant | BADHDUFLAG | Total packets | Discarded packets |
| A | 0 | 132 | 0 |
| B | 0 | 132 | 0 |
| C | 0 | 132 | 0 |
| D | 0 | 132 | 0 |
| Mode M0 | |||
|---|---|---|---|
| Quadrant | BADHDUFLAG | Total packets | Discarded packets |
| A | 0 | 14434 | 2 |
| B | 0 | 13931 | 2 |
| C | 0 | 14495 | 2 |
| D | 0 | 17466 | 2 |
| Quadrant | Total seconds | Saturated seconds | Saturation percentage |
|---|---|---|---|
| A | 6488 | 126 | 1.942047% |
| B | 6488 | 153 | 2.358200% |
| C | 6488 | 112 | 1.726264% |
| D | 6488 | 239 | 3.683724% |
Noise dominated data is calculated using 1-second bins in cleaned event files. If a bin has >2000 counts, and if more than 50% of those come from <1% of pixels, then it is considered to be noise-dominated and hence unusable.
| Quadrant | # 1 sec bins | Bins with >0 counts | Bins with >2000 counts | High rate bins dominated by noise | Noise dominated (total time) | Noise dominated (detector-on time) | Marked lightcurve |
|---|---|---|---|---|---|---|---|
| A | 7608 | 6489 | 2 | 2 | 0.03% | 0.03% | 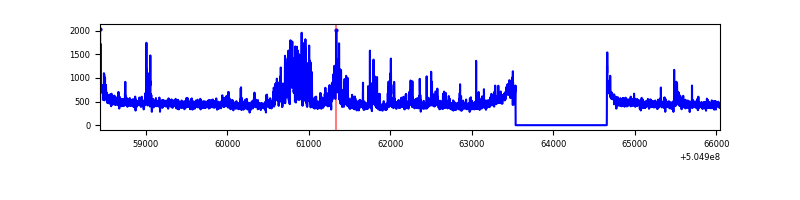 |
| B | 7608 | 6489 | 12 | 12 | 0.16% | 0.18% | 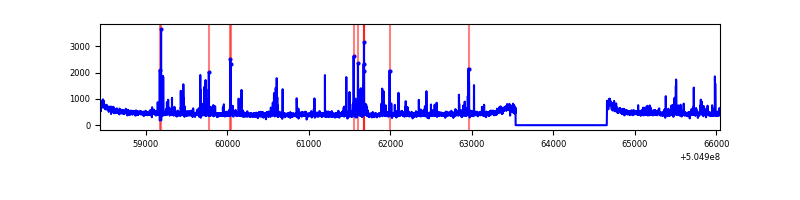 |
| C | 7608 | 6489 | 45 | 45 | 0.59% | 0.69% | 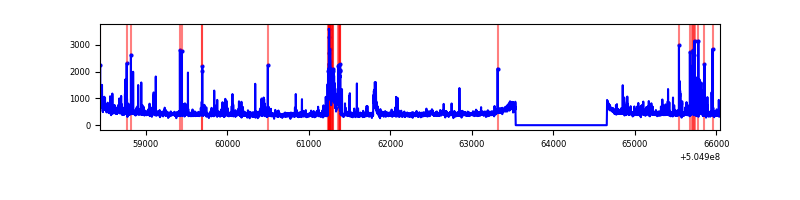 |
| D | 7608 | 6489 | 113 | 113 | 1.49% | 1.74% | 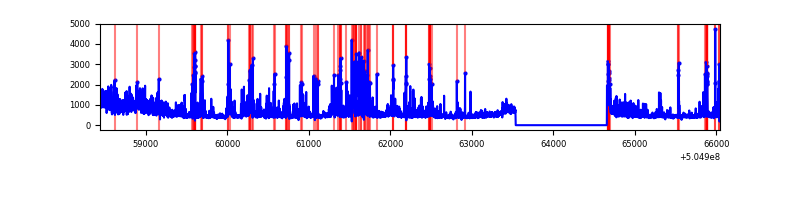 |
Top three noisy pixels from each quadrant. If the there are fewer than three noisy pixels in the level2.evt file, extra rows are filled as -1
| Pixel properties | Quadrant properties | ||||||
|---|---|---|---|---|---|---|---|
| Quadrant | DetID | PixID | Counts | Sigma | Mean | Median | Sigma |
| A | 4 | 159 | 435933 | 2468.31 | 718 | 699 | 176.3 |
| A | 0 | 8 | 37155 | 206.75 | 718 | 699 | 176.3 |
| A | 3 | 62 | 33432 | 185.64 | 718 | 699 | 176.3 |
| B | 10 | 247 | 79157 | 529.18 | 703 | 678 | 148.3 |
| B | 4 | 206 | 54962 | 366.03 | 703 | 678 | 148.3 |
| B | 9 | 254 | 54955 | 365.98 | 703 | 678 | 148.3 |
| C | 15 | 157 | 169575 | 894.84 | 689 | 681 | 188.7 |
| C | 13 | 3 | 121844 | 641.95 | 689 | 681 | 188.7 |
| C | 12 | 252 | 88935 | 467.59 | 689 | 681 | 188.7 |
| D | 7 | 70 | 660193 | 3393.37 | 688 | 657 | 194.4 |
| D | 2 | 153 | 328495 | 1686.75 | 688 | 657 | 194.4 |
| D | 15 | 125 | 186117 | 954.21 | 688 | 657 | 194.4 |
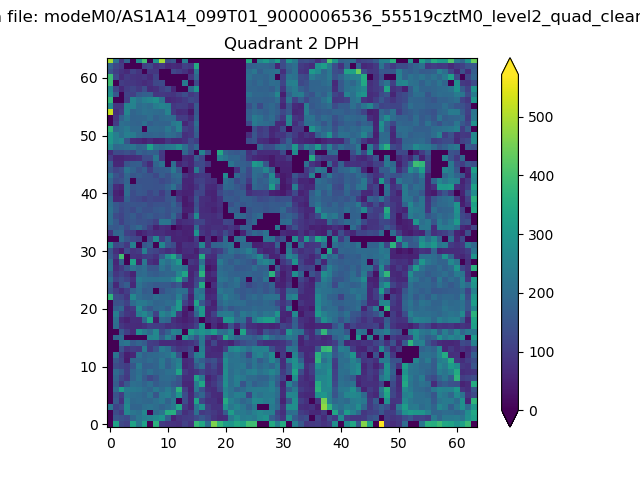
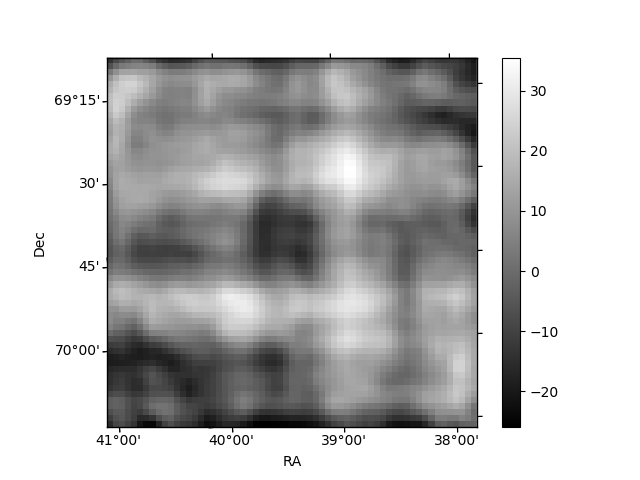
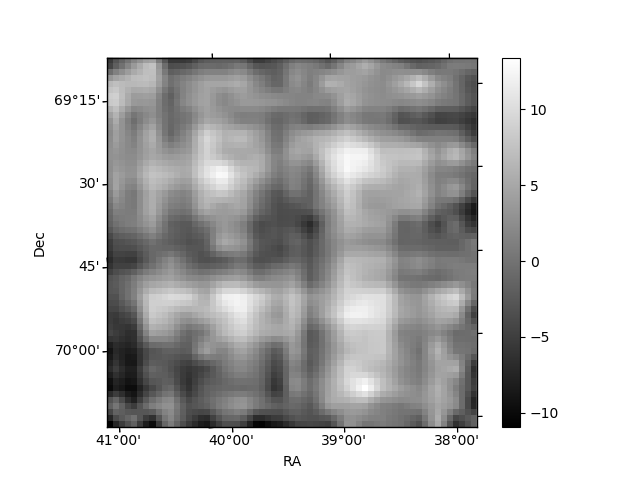
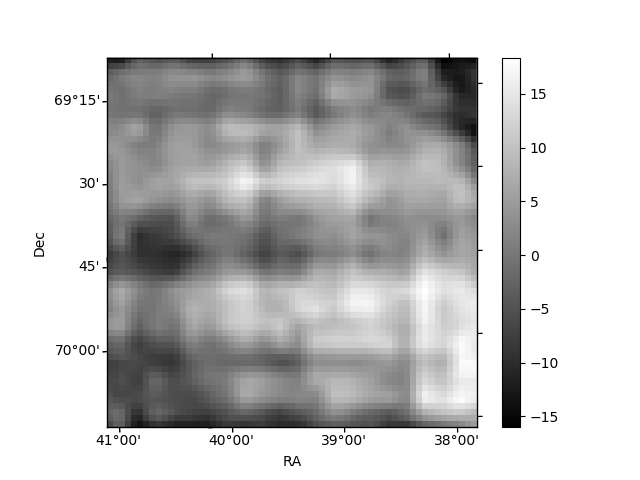
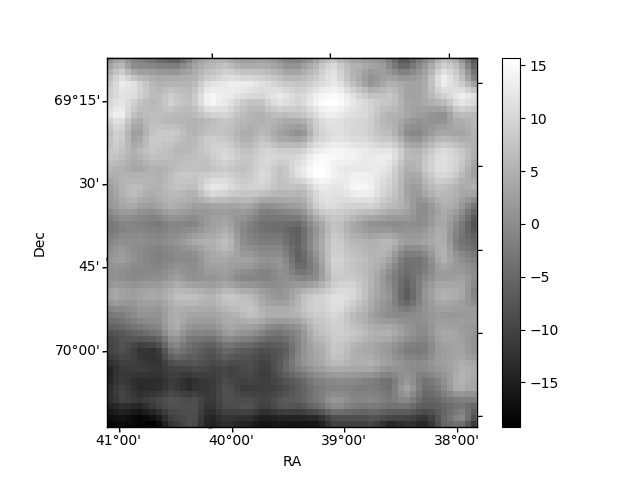
Histogram calculated using DETX and DETY for each event in the final _common_clean file
| Quadrant A | 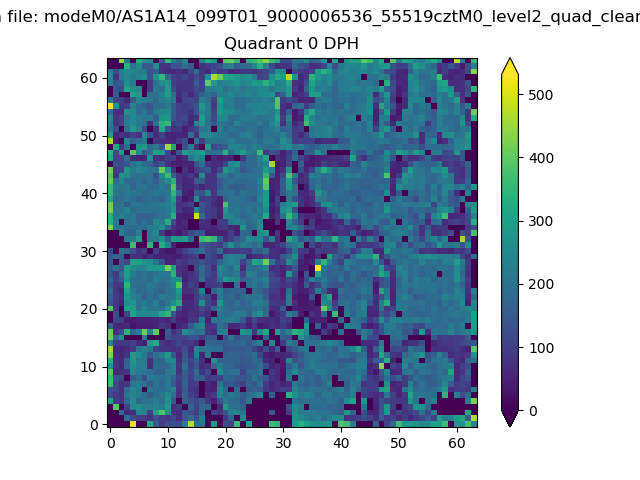 |
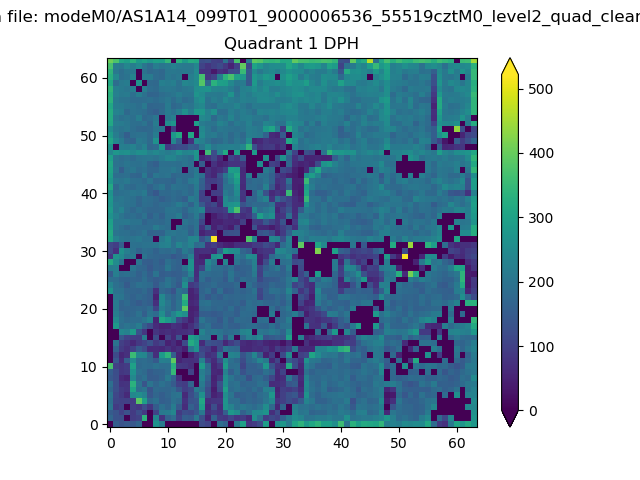 |
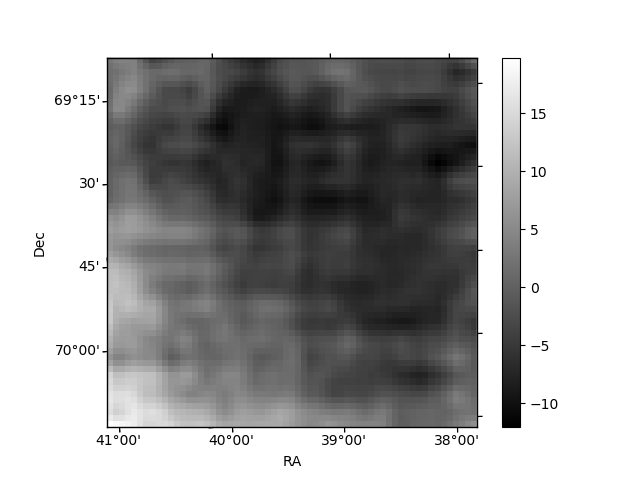
Quadrant B |
|---|---|---|---|
| Quadrant D | 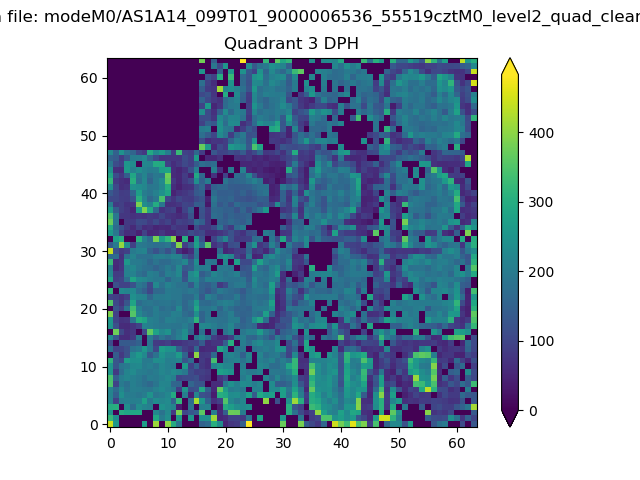 |
 |
Quadrant C |
| Plot type | Count rate plots | Images |
|---|---|---|
| Comparison with Poisson distribution Blue bars denote a histogram of data divided into 1 sec bins. Red curve is a Poisson curve with rate = median count rate of data. |
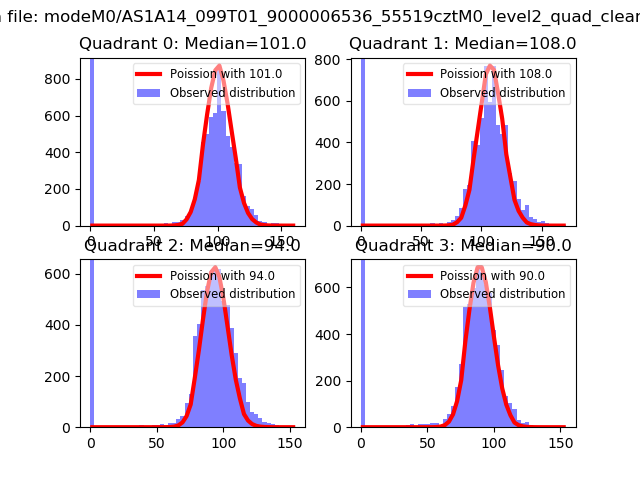 |
 |
| Quadrant-wise count rates Data is divided into 100 sec bins |
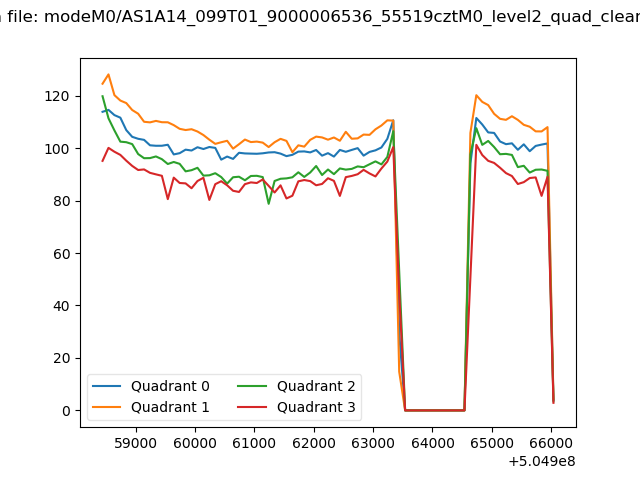 |
|
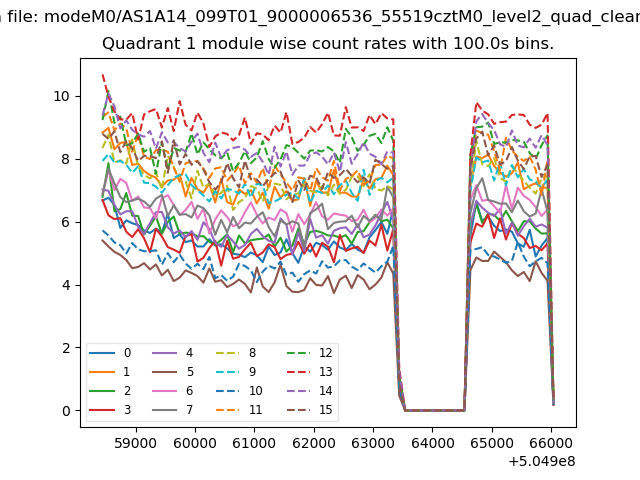
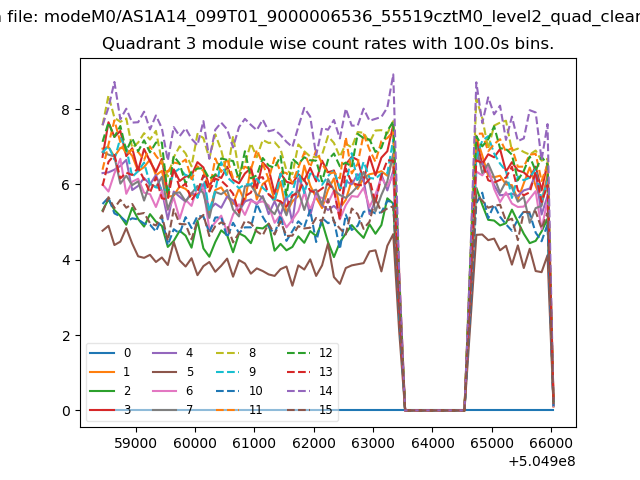
| Module-wise count rates for Quadrant A Data is divided into 100 sec bins |
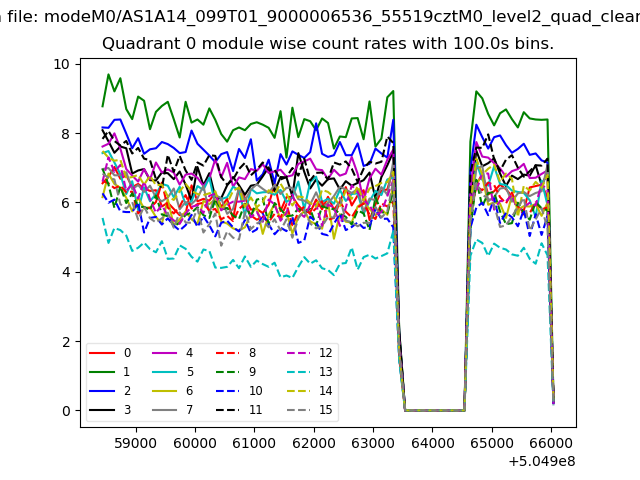 |
 |
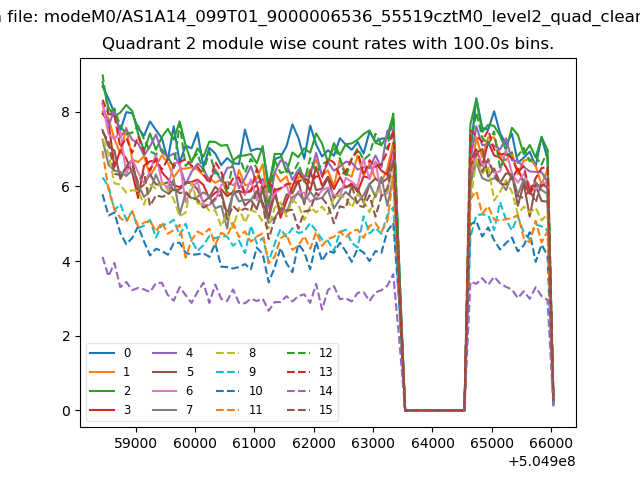
| Module-wise count rates for Quadrant B Data is divided into 100 sec bins |
 |
 |
| Module-wise count rates for Quadrant C Data is divided into 100 sec bins |
 |
 |
| Module-wise count rates for Quadrant D Data is divided into 100 sec bins |
 |
 |
| Parameter | Plot |
|---|---|
| CZT HV Monitor | 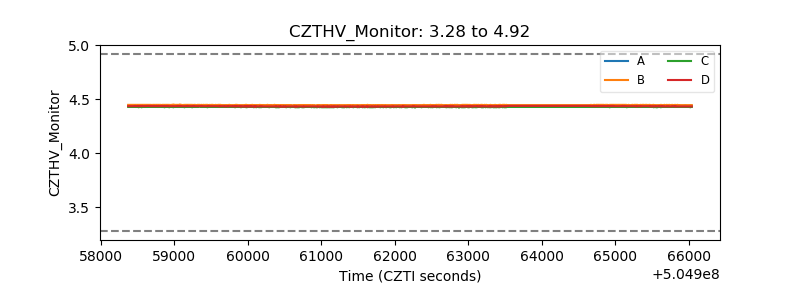 |
| D_VDD | 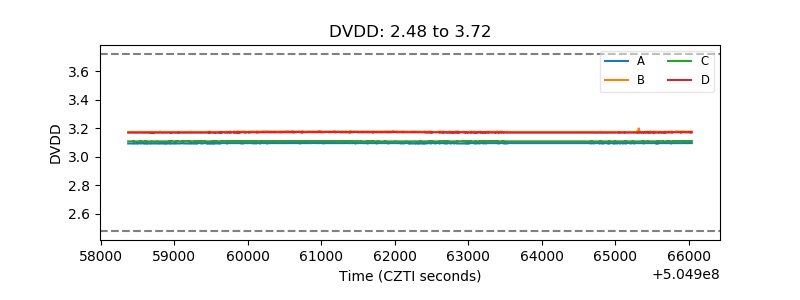 |
| Temperature 1 | 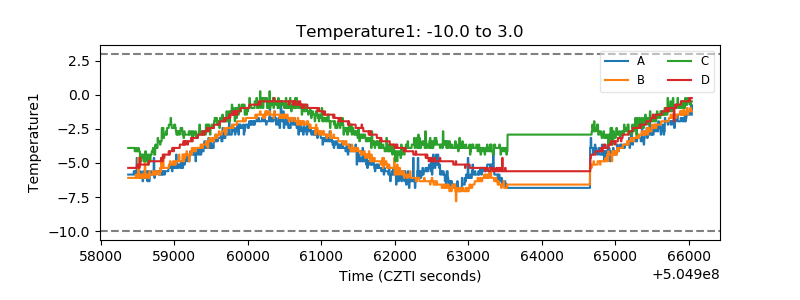 |
| Veto HV Monitor | 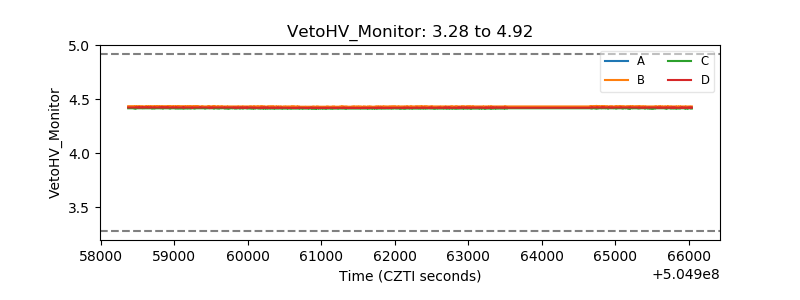 |
| Veto LLD | 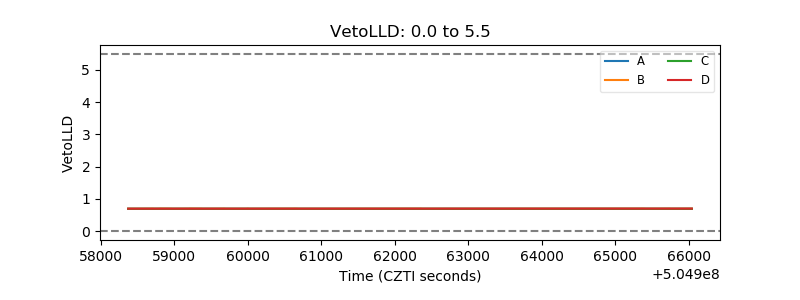 |
| Alpha Counter | 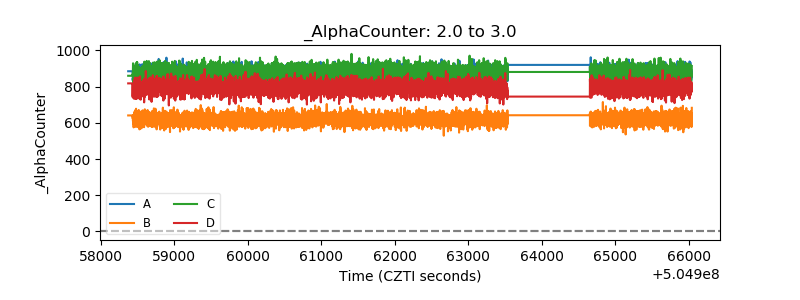 |
| _CPM_Rate | 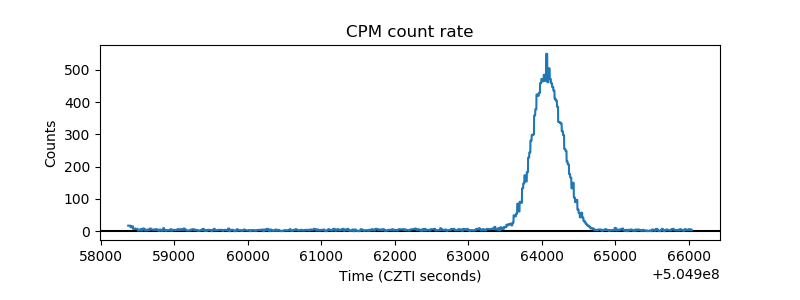 |
| CZT Counter | 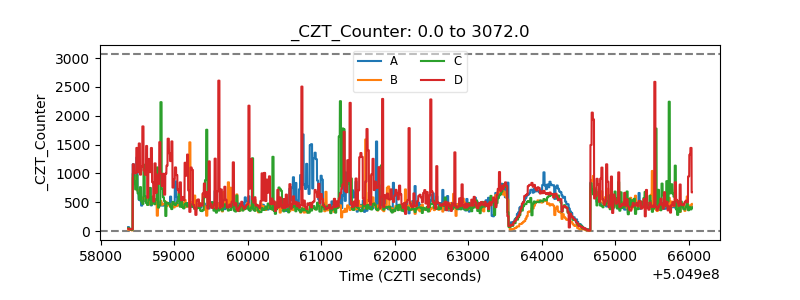 |
| +2.5 Volts monitor |  |
| +5 Volts monitor |  |
| _ROLL_ROT | 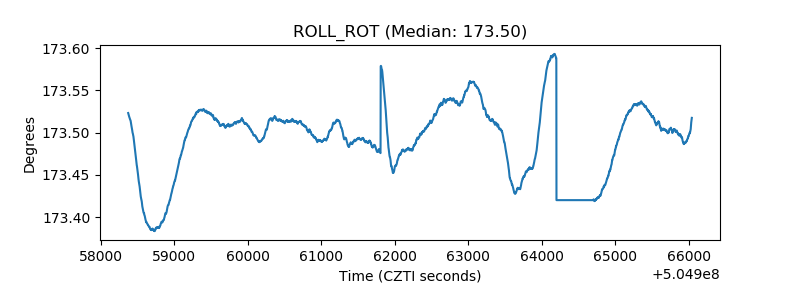 |
| _Roll_DEC | 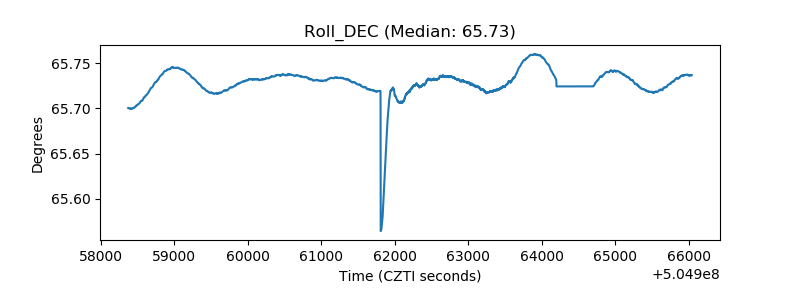 |
| _Roll_RA | 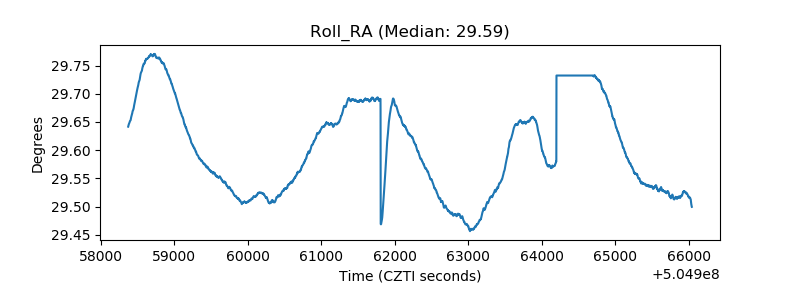 |
| Veto Counter | 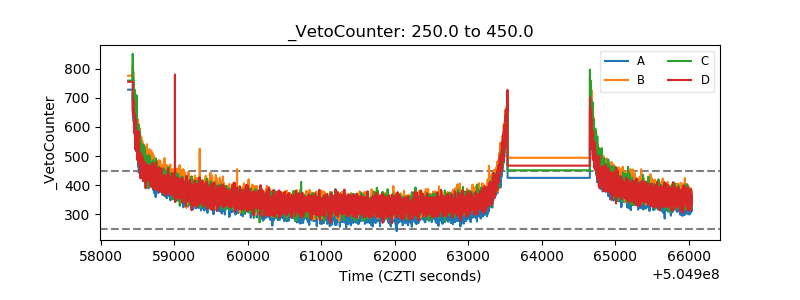 |