| Param | Original file | Final file |
|---|---|---|
| Filename | modeM0/AS1A14_099T01_9000006536_55520cztM0_level2.fits | modeM0/AS1A14_099T01_9000006536_55520cztM0_level2_quad_clean.evt |
| Size (bytes) | 448,315,200 | 97,951,680 |
| Size | 427.5 MB | 93.4 MB |
| Events in quadrant A | 3,054,838 | 661,655 |
| Events in quadrant B | 3,732,085 | 680,761 |
| Events in quadrant C | 3,218,607 | 608,733 |
| Events in quadrant D | 6,066,831 | 545,849 |
| Mode M9 | |||
|---|---|---|---|
| Quadrant | BADHDUFLAG | Total packets | Discarded packets |
| A | 0 | 10 | 0 |
| B | 0 | 10 | 0 |
| C | 0 | 10 | 0 |
| D | 0 | 10 | 0 |
| Mode SS | |||
|---|---|---|---|
| Quadrant | BADHDUFLAG | Total packets | Discarded packets |
| A | 0 | 138 | 0 |
| B | 0 | 138 | 0 |
| C | 0 | 138 | 0 |
| D | 0 | 138 | 0 |
| Mode M0 | |||
|---|---|---|---|
| Quadrant | BADHDUFLAG | Total packets | Discarded packets |
| A | 0 | 13986 | 1 |
| B | 0 | 15856 | 1 |
| C | 0 | 14759 | 1 |
| D | 0 | 22600 | 1 |
| Quadrant | Total seconds | Saturated seconds | Saturation percentage |
|---|---|---|---|
| A | 6720 | 88 | 1.309524% |
| B | 6721 | 334 | 4.969499% |
| C | 6721 | 158 | 2.350841% |
| D | 6721 | 642 | 9.552150% |
Noise dominated data is calculated using 1-second bins in cleaned event files. If a bin has >2000 counts, and if more than 50% of those come from <1% of pixels, then it is considered to be noise-dominated and hence unusable.
| Quadrant | # 1 sec bins | Bins with >0 counts | Bins with >2000 counts | High rate bins dominated by noise | Noise dominated (total time) | Noise dominated (detector-on time) | Marked lightcurve |
|---|---|---|---|---|---|---|---|
| A | 7780 | 6721 | 0 | 0 | 0.00% | 0.00% | 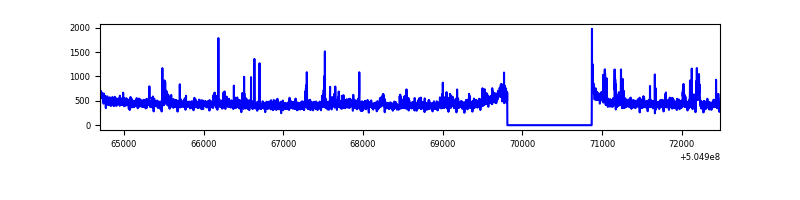 |
| B | 7781 | 6722 | 213 | 213 | 2.74% | 3.17% | 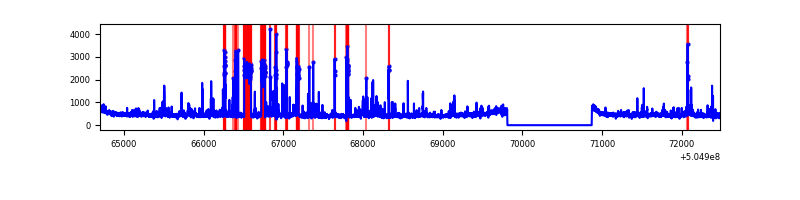 |
| C | 7781 | 6722 | 67 | 67 | 0.86% | 1.00% | 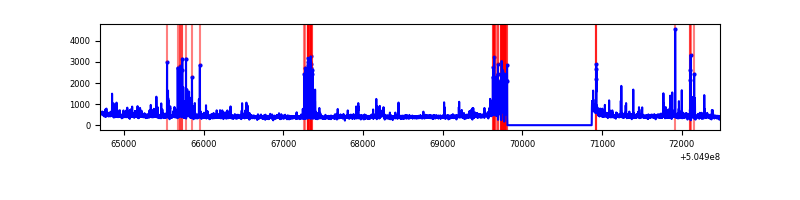 |
| D | 7781 | 6722 | 564 | 564 | 7.25% | 8.39% | 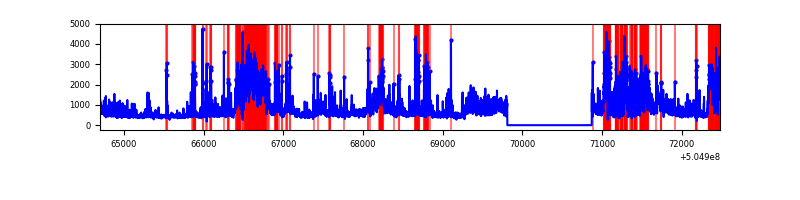 |
Top three noisy pixels from each quadrant. If the there are fewer than three noisy pixels in the level2.evt file, extra rows are filled as -1
| Pixel properties | Quadrant properties | ||||||
|---|---|---|---|---|---|---|---|
| Quadrant | DetID | PixID | Counts | Sigma | Mean | Median | Sigma |
| A | 3 | 62 | 89120 | 489.43 | 728 | 709 | 180.6 |
| A | 4 | 159 | 41165 | 223.96 | 728 | 709 | 180.6 |
| A | 7 | 243 | 26804 | 144.46 | 728 | 709 | 180.6 |
| B | 5 | 236 | 424508 | 2849.75 | 704 | 678 | 148.7 |
| B | 0 | 171 | 164615 | 1102.28 | 704 | 678 | 148.7 |
| B | 5 | 172 | 112460 | 751.6 | 704 | 678 | 148.7 |
| C | 13 | 3 | 348866 | 1838.61 | 690 | 682 | 189.4 |
| C | 12 | 252 | 87930 | 460.72 | 690 | 682 | 189.4 |
| C | 14 | 254 | 30425 | 157.06 | 690 | 682 | 189.4 |
| D | 7 | 70 | 812954 | 4226.14 | 683 | 653 | 192.2 |
| D | 2 | 31 | 617434 | 3208.92 | 683 | 653 | 192.2 |
| D | 8 | 160 | 603473 | 3136.28 | 683 | 653 | 192.2 |
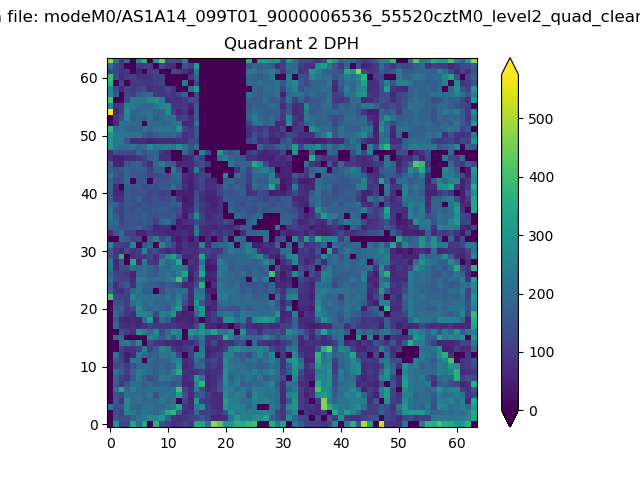
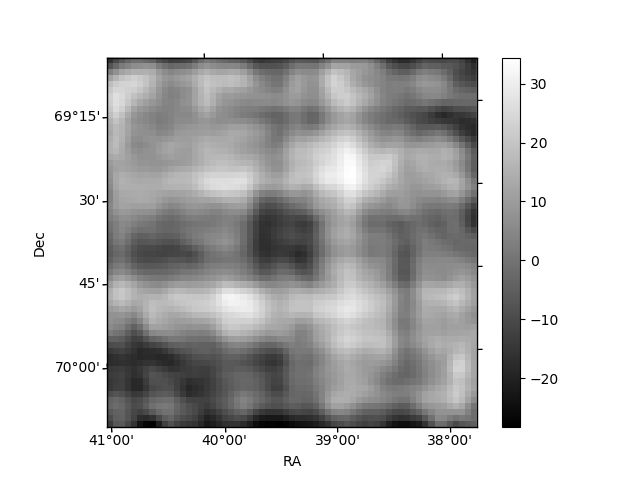
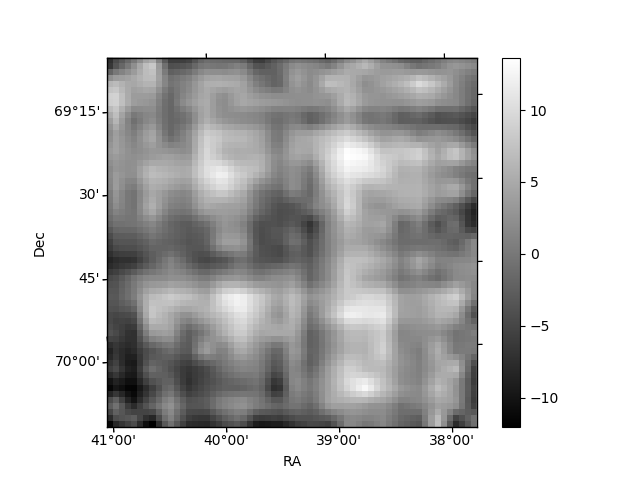
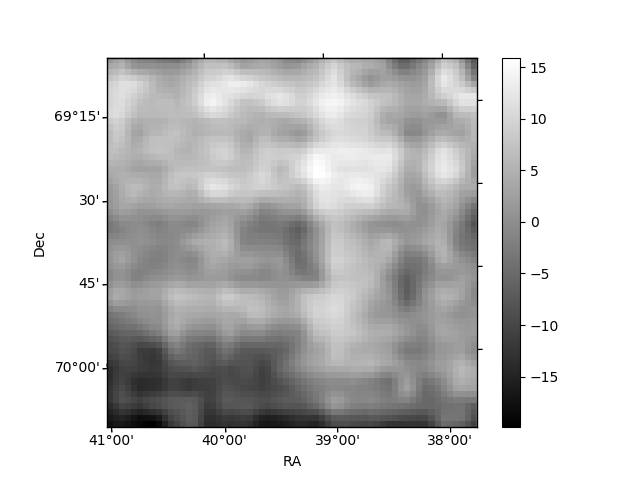
Histogram calculated using DETX and DETY for each event in the final _common_clean file
| Quadrant A | 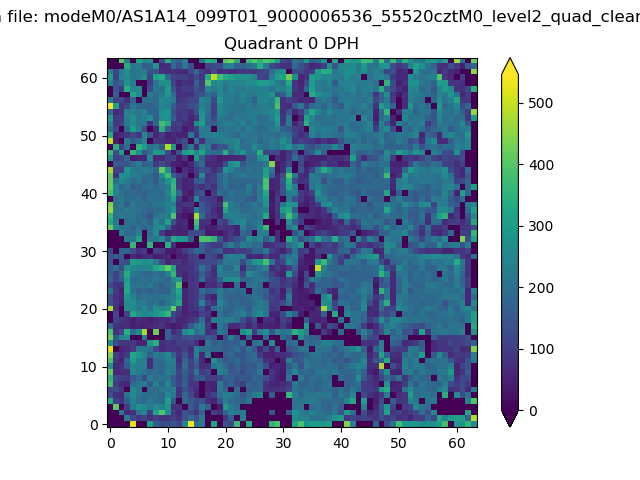 |
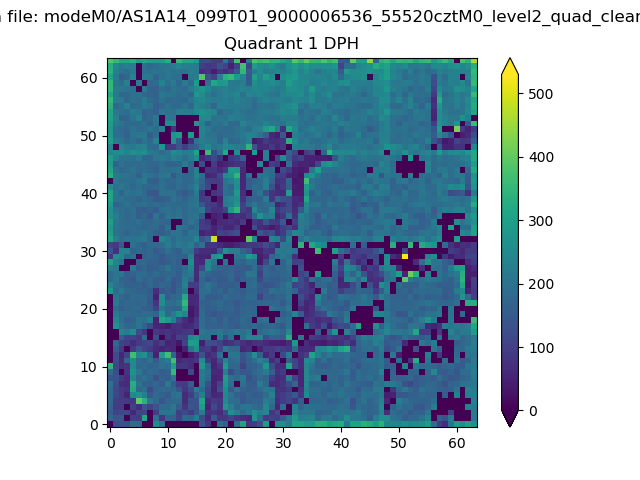 |
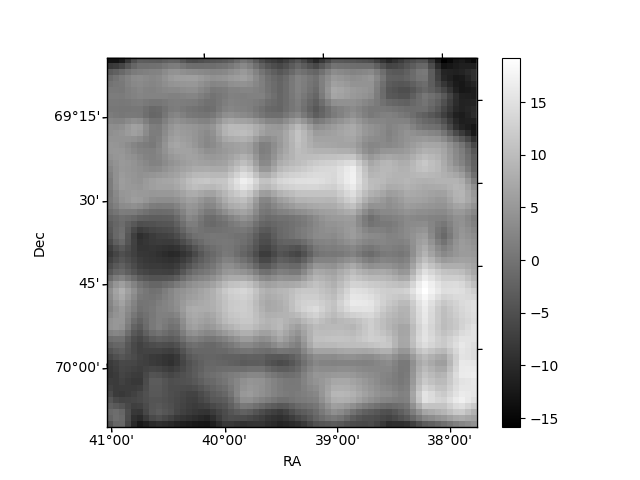
Quadrant B |
|---|---|---|---|
| Quadrant D | 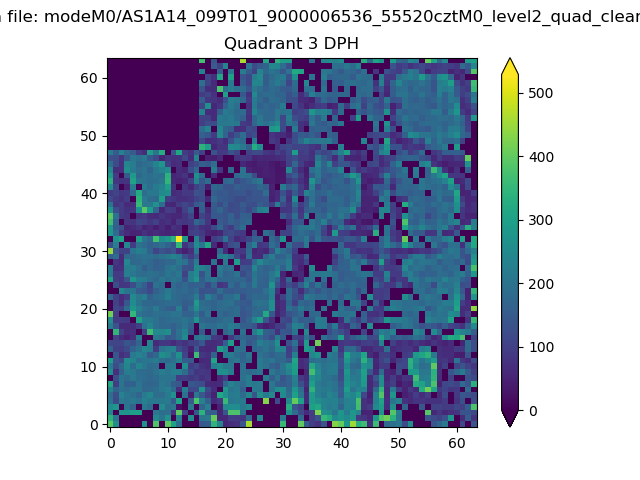 |
 |
Quadrant C |
| Plot type | Count rate plots | Images |
|---|---|---|
| Comparison with Poisson distribution Blue bars denote a histogram of data divided into 1 sec bins. Red curve is a Poisson curve with rate = median count rate of data. |
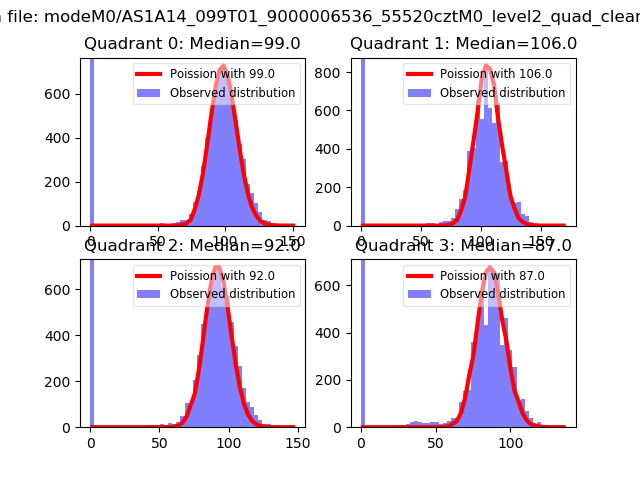 |
 |
| Quadrant-wise count rates Data is divided into 100 sec bins |
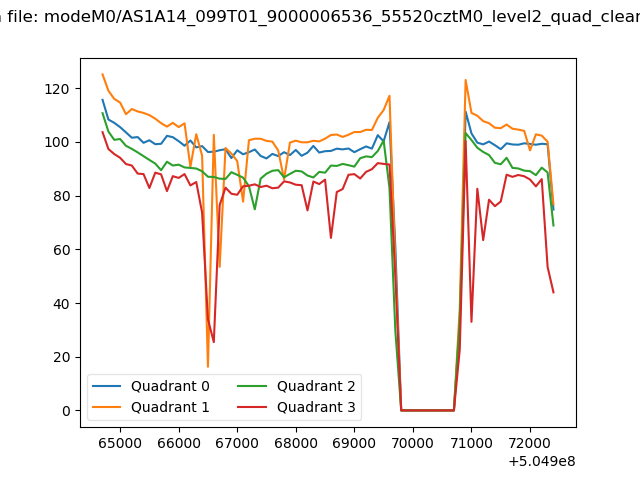 |
|
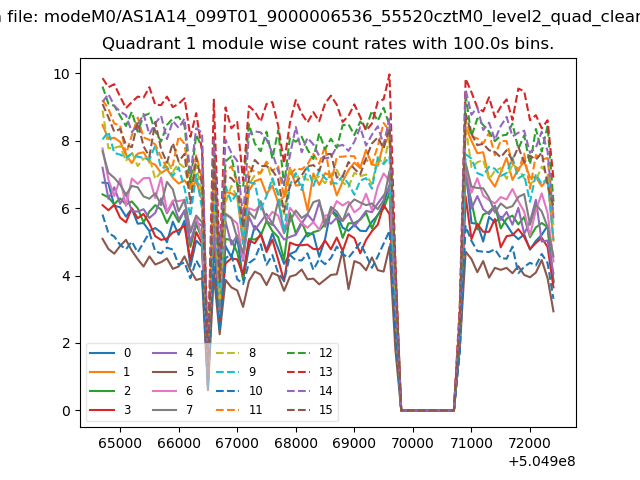
| Module-wise count rates for Quadrant A Data is divided into 100 sec bins |
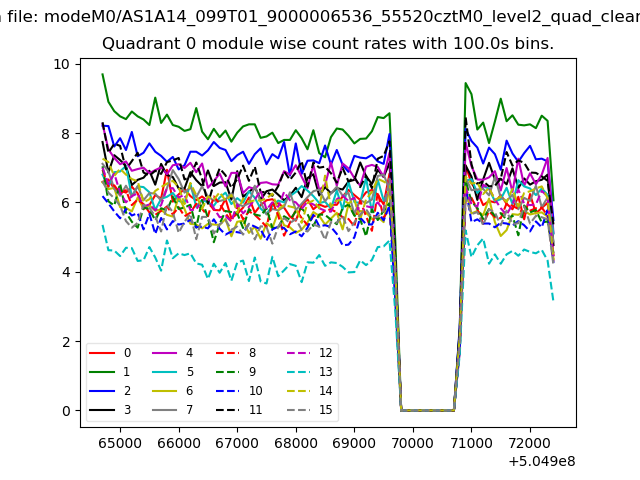 |
 |
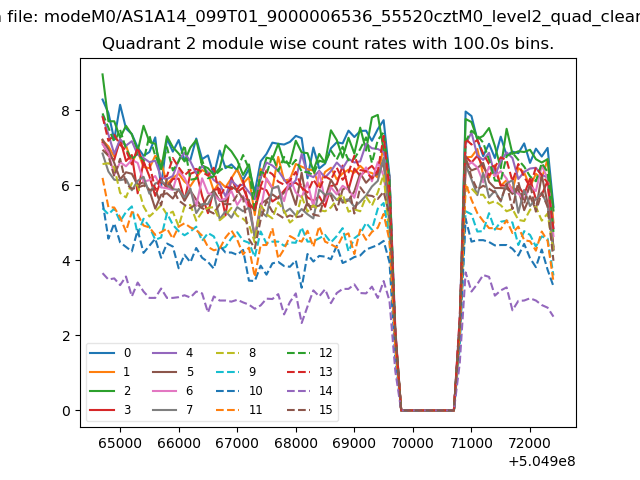
| Module-wise count rates for Quadrant B Data is divided into 100 sec bins |
 |
 |
| Module-wise count rates for Quadrant C Data is divided into 100 sec bins |
 |
 |
| Module-wise count rates for Quadrant D Data is divided into 100 sec bins |
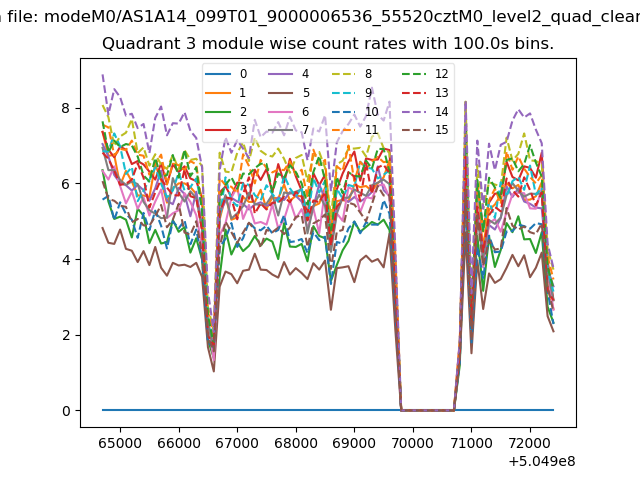 |
 |
| Parameter | Plot |
|---|---|
| CZT HV Monitor | 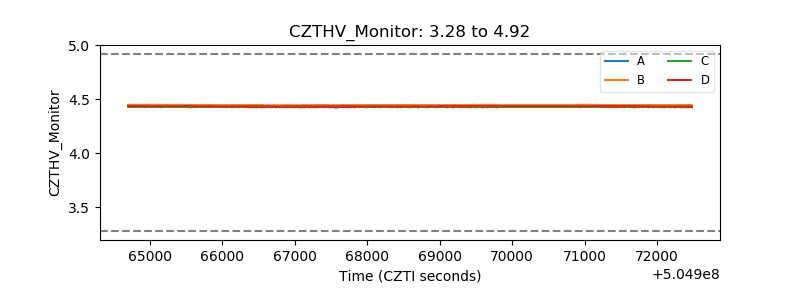 |
| D_VDD | 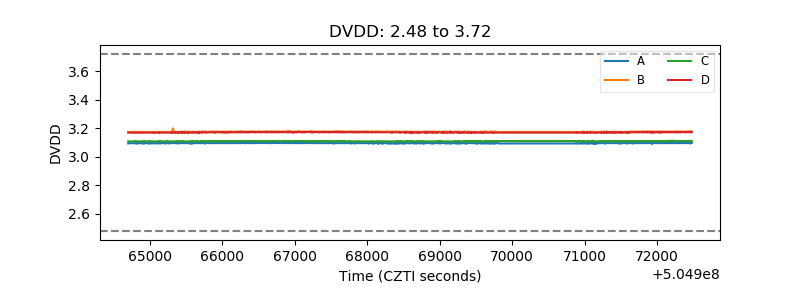 |
| Temperature 1 | 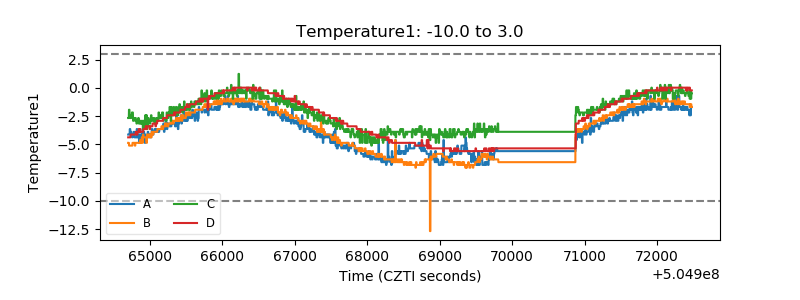 |
| Veto HV Monitor |  |
| Veto LLD | 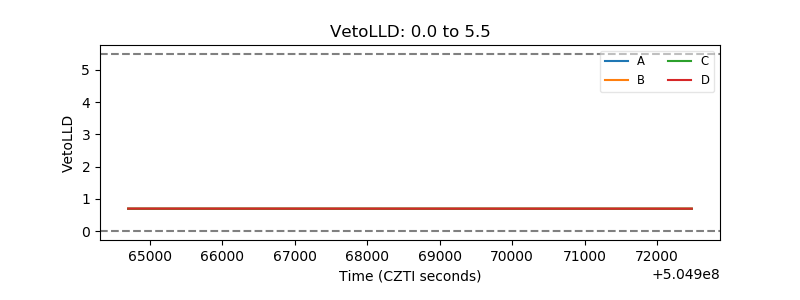 |
| Alpha Counter | 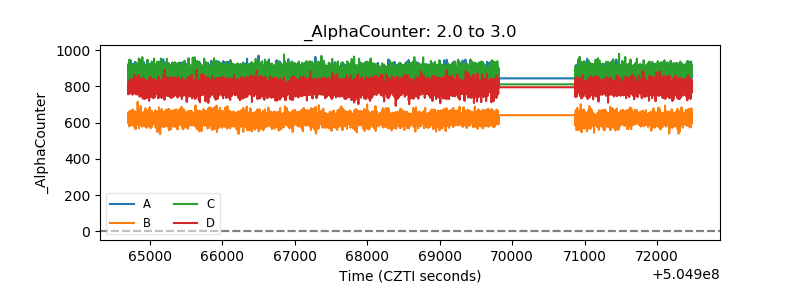 |
| _CPM_Rate | 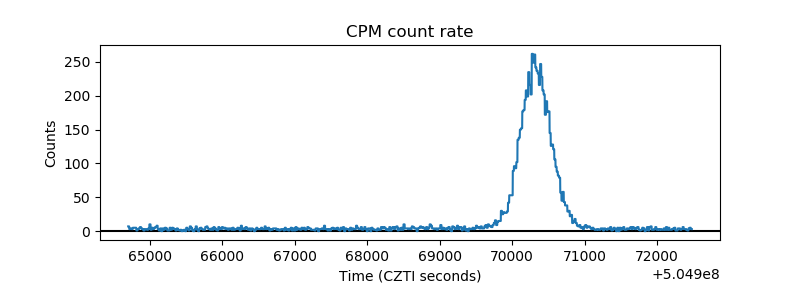 |
| CZT Counter | 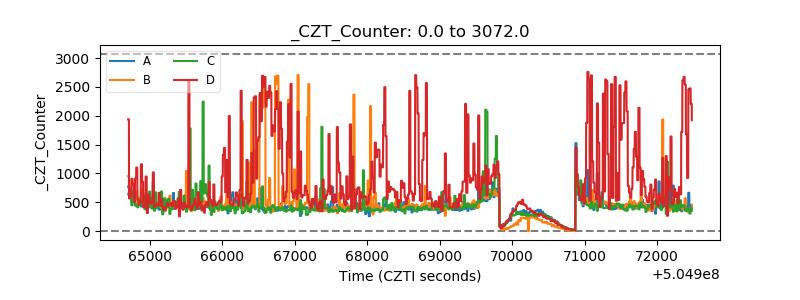 |
| +2.5 Volts monitor |  |
| +5 Volts monitor |  |
| _ROLL_ROT | 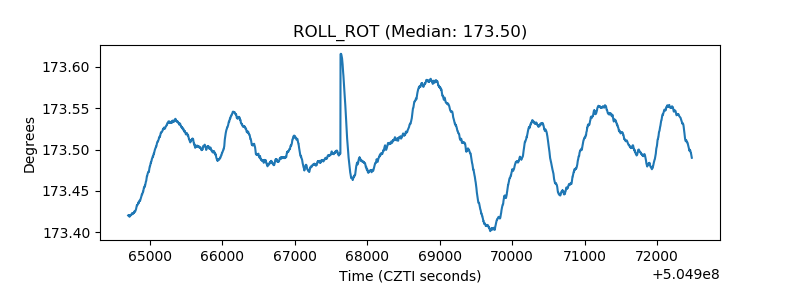 |
| _Roll_DEC | 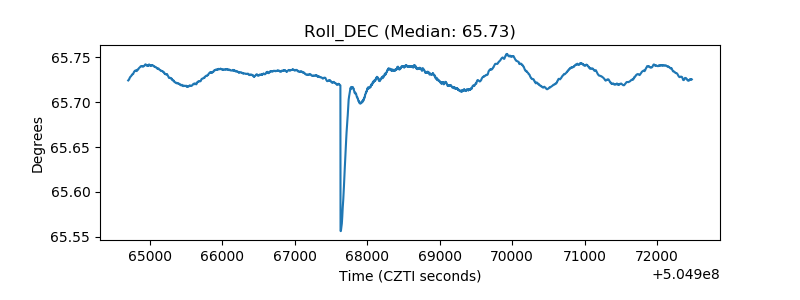 |
| _Roll_RA | 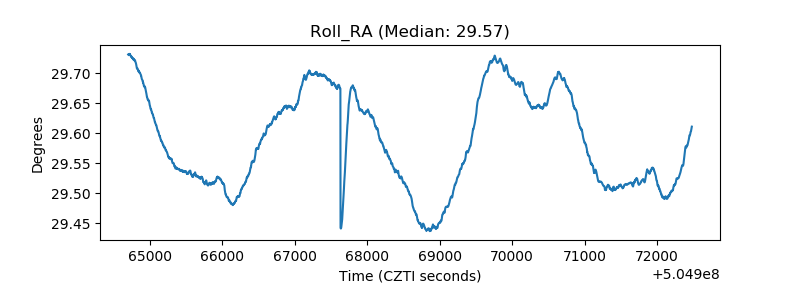 |
| Veto Counter | 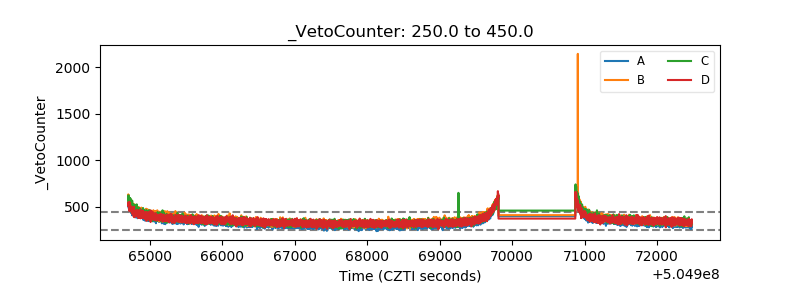 |