| Param | Original file | Final file |
|---|---|---|
| Filename | modeM0/AS1A14_099T01_9000006536_55522cztM0_level2.fits | modeM0/AS1A14_099T01_9000006536_55522cztM0_level2_quad_clean.evt |
| Size (bytes) | 573,387,840 | 100,800,000 |
| Size | 546.8 MB | 96.1 MB |
| Events in quadrant A | 3,353,674 | 701,797 |
| Events in quadrant B | 4,552,009 | 716,987 |
| Events in quadrant C | 3,613,809 | 659,822 |
| Events in quadrant D | 9,129,936 | 458,408 |
| Mode M9 | |||
|---|---|---|---|
| Quadrant | BADHDUFLAG | Total packets | Discarded packets |
| A | 0 | 5 | 0 |
| B | 0 | 6 | 0 |
| C | 0 | 6 | 0 |
| D | 0 | 6 | 0 |
| Mode SS | |||
|---|---|---|---|
| Quadrant | BADHDUFLAG | Total packets | Discarded packets |
| A | 0 | 150 | 0 |
| B | 0 | 150 | 0 |
| C | 0 | 150 | 0 |
| D | 0 | 150 | 0 |
| Mode M0 | |||
|---|---|---|---|
| Quadrant | BADHDUFLAG | Total packets | Discarded packets |
| A | 0 | 15647 | 2 |
| B | 0 | 18896 | 2 |
| C | 0 | 16534 | 2 |
| D | 0 | 32323 | 2 |
| Quadrant | Total seconds | Saturated seconds | Saturation percentage |
|---|---|---|---|
| A | 7400 | 83 | 1.121622% |
| B | 7399 | 470 | 6.352210% |
| C | 7399 | 132 | 1.784025% |
| D | 7399 | 2161 | 29.206650% |
Noise dominated data is calculated using 1-second bins in cleaned event files. If a bin has >2000 counts, and if more than 50% of those come from <1% of pixels, then it is considered to be noise-dominated and hence unusable.
| Quadrant | # 1 sec bins | Bins with >0 counts | Bins with >2000 counts | High rate bins dominated by noise | Noise dominated (total time) | Noise dominated (detector-on time) | Marked lightcurve |
|---|---|---|---|---|---|---|---|
| A | 7740 | 7401 | 12 | 12 | 0.16% | 0.16% | 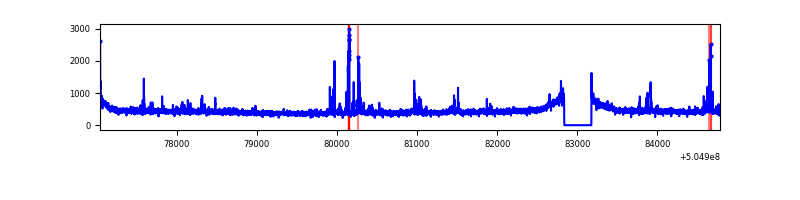 |
| B | 7739 | 7400 | 279 | 279 | 3.61% | 3.77% | 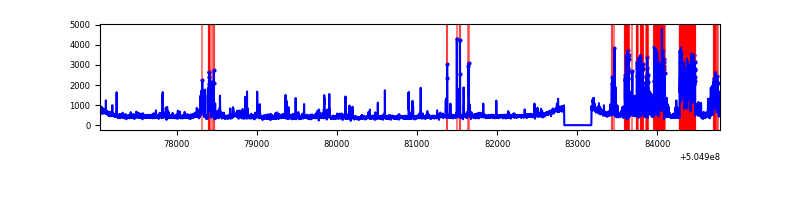 |
| C | 7739 | 7400 | 63 | 63 | 0.81% | 0.85% | 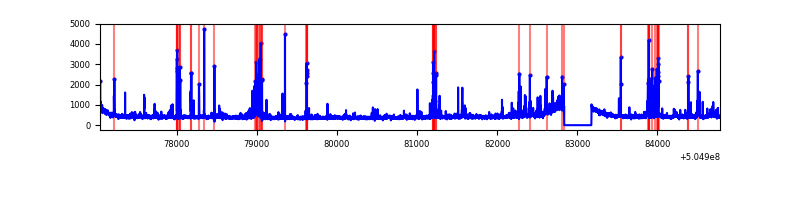 |
| D | 7739 | 7400 | 1604 | 1604 | 20.73% | 21.68% | 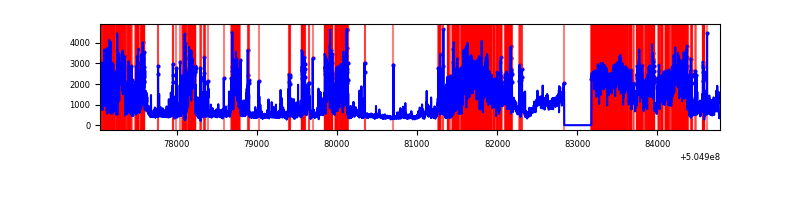 |
Top three noisy pixels from each quadrant. If the there are fewer than three noisy pixels in the level2.evt file, extra rows are filled as -1
| Pixel properties | Quadrant properties | ||||||
|---|---|---|---|---|---|---|---|
| Quadrant | DetID | PixID | Counts | Sigma | Mean | Median | Sigma |
| A | 4 | 205 | 111457 | 565.48 | 799 | 780 | 195.7 |
| A | 3 | 14 | 23483 | 116.0 | 799 | 780 | 195.7 |
| A | 13 | 254 | 18331 | 89.67 | 799 | 780 | 195.7 |
| B | 4 | 156 | 973485 | 5908.87 | 773 | 746 | 164.6 |
| B | 10 | 247 | 110053 | 663.98 | 773 | 746 | 164.6 |
| B | 5 | 172 | 106015 | 639.45 | 773 | 746 | 164.6 |
| C | 13 | 3 | 326112 | 1553.39 | 778 | 770 | 209.4 |
| C | 10 | 19 | 68762 | 324.64 | 778 | 770 | 209.4 |
| C | 14 | 254 | 43064 | 201.94 | 778 | 770 | 209.4 |
| D | 11 | 129 | 4067284 | 21459.97 | 669 | 638 | 189.5 |
| D | 2 | 249 | 890736 | 4697.11 | 669 | 638 | 189.5 |
| D | 8 | 160 | 818020 | 4313.38 | 669 | 638 | 189.5 |
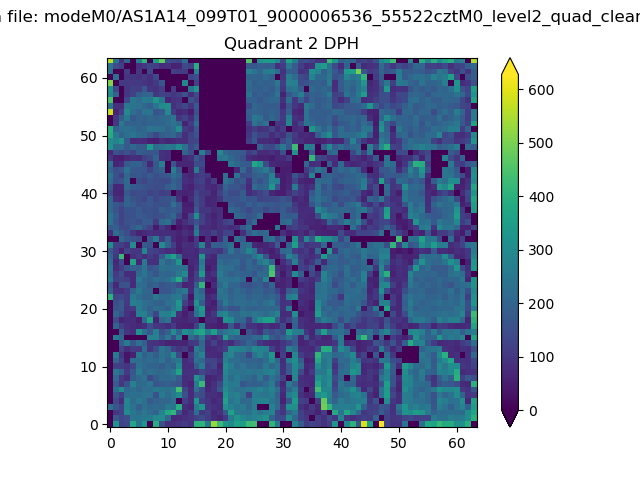
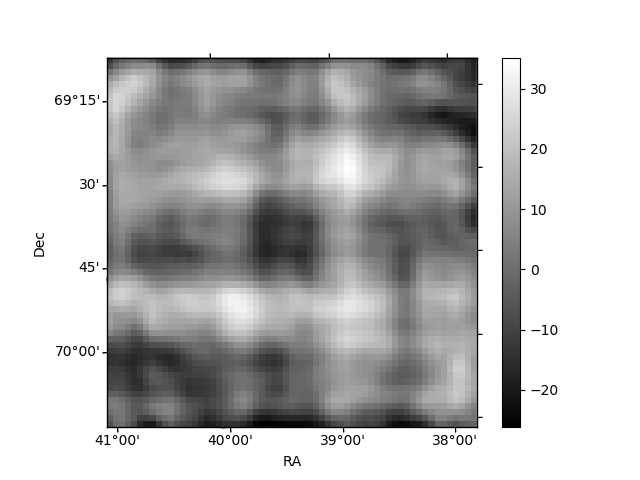
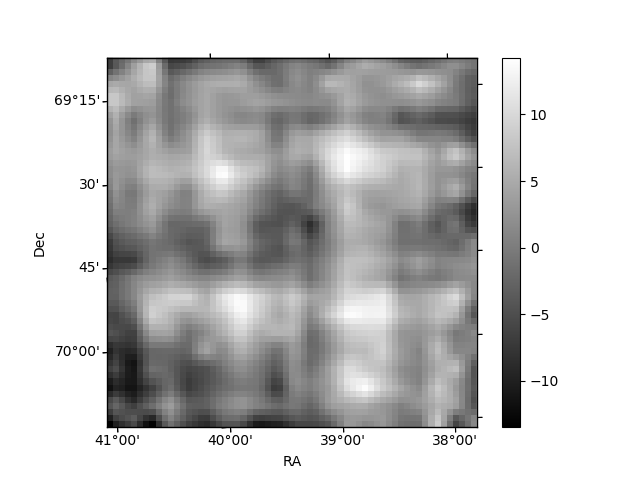
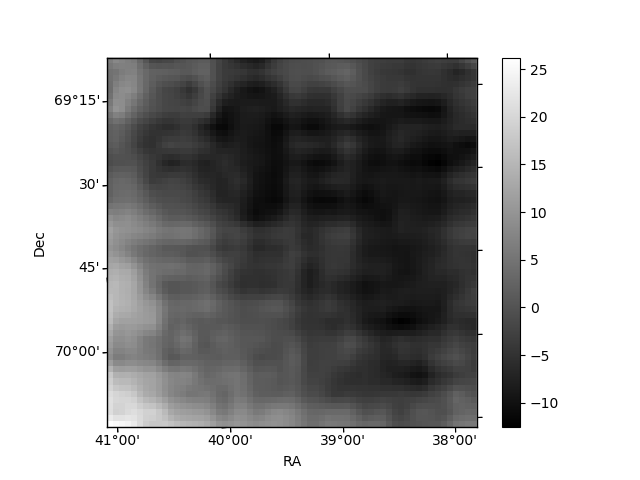
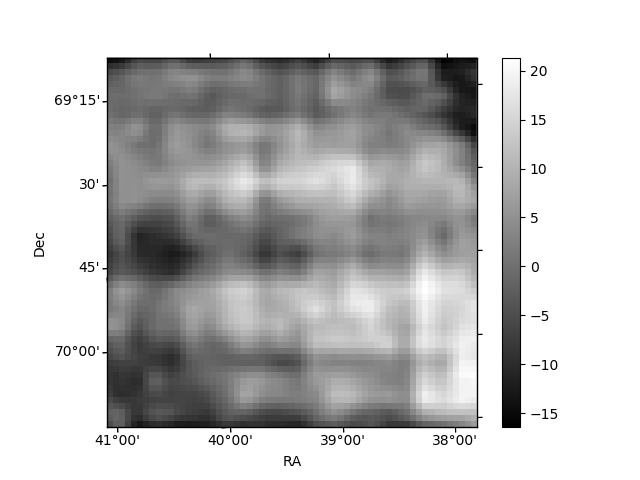
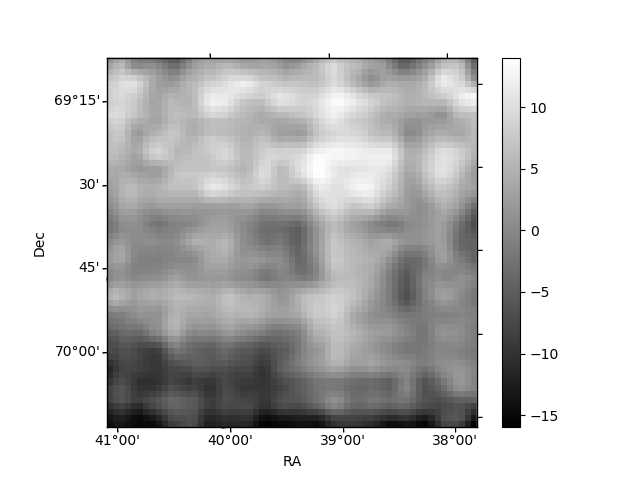
Histogram calculated using DETX and DETY for each event in the final _common_clean file
| Quadrant A | 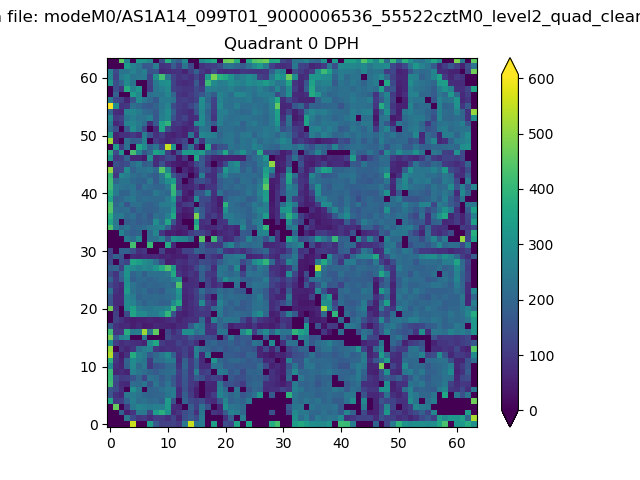 |
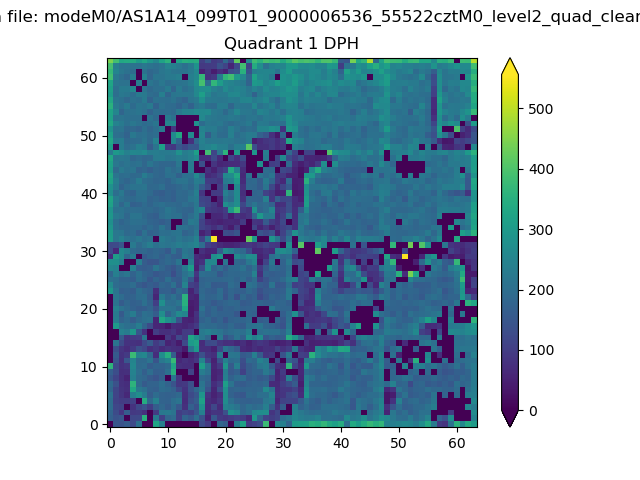 |
Quadrant B |
|---|---|---|---|
| Quadrant D | 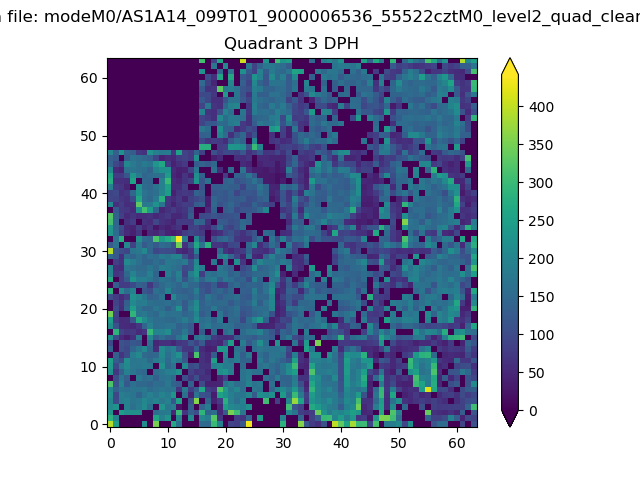 |
 |
Quadrant C |
| Plot type | Count rate plots | Images |
|---|---|---|
| Comparison with Poisson distribution Blue bars denote a histogram of data divided into 1 sec bins. Red curve is a Poisson curve with rate = median count rate of data. |
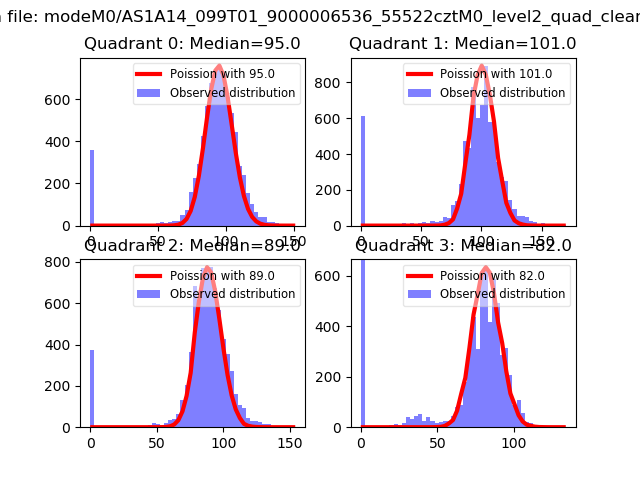 |
 |
| Quadrant-wise count rates Data is divided into 100 sec bins |
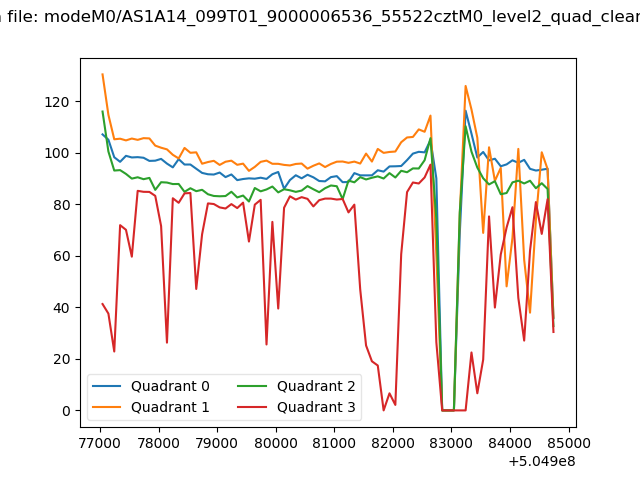 |
|
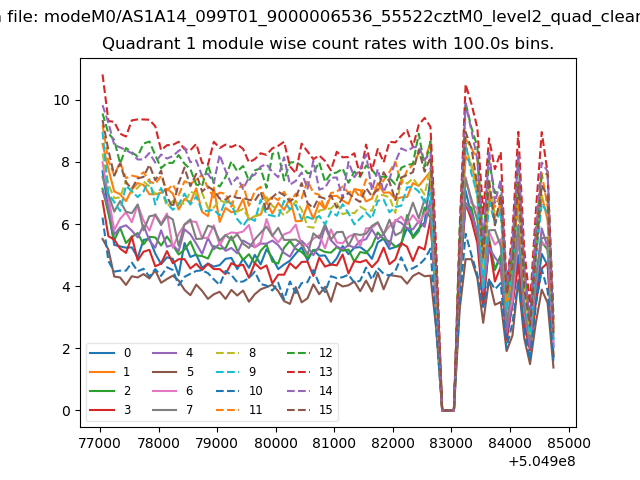
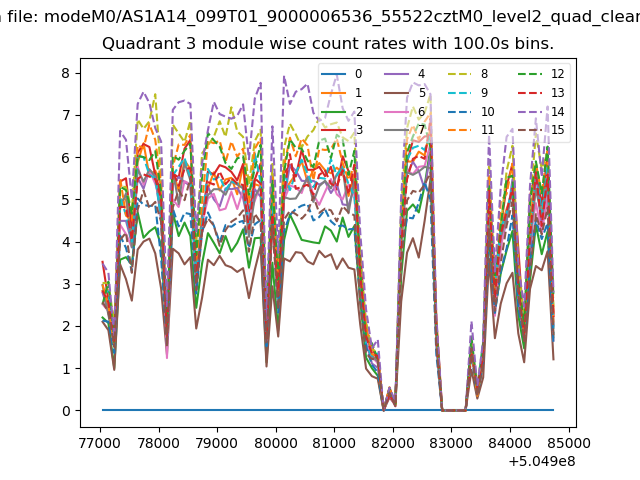
| Module-wise count rates for Quadrant A Data is divided into 100 sec bins |
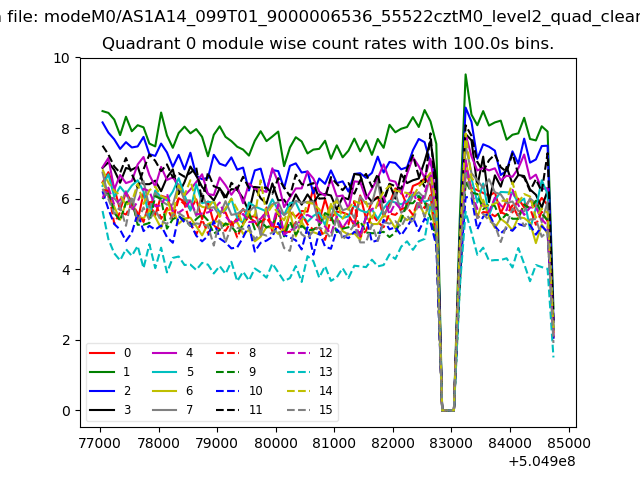 |
 |
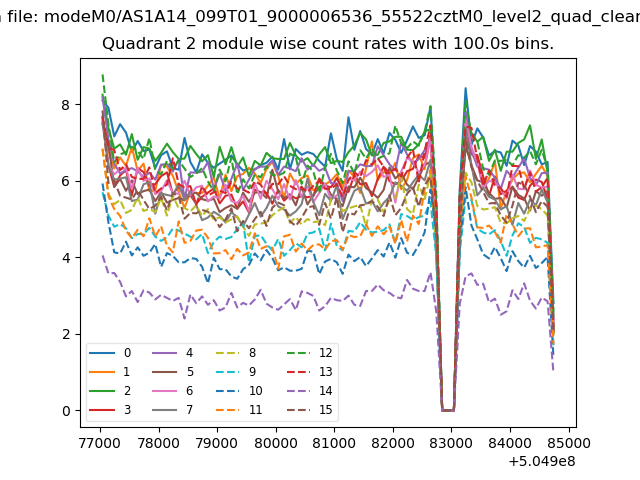
| Module-wise count rates for Quadrant B Data is divided into 100 sec bins |
 |
 |
| Module-wise count rates for Quadrant C Data is divided into 100 sec bins |
 |
 |
| Module-wise count rates for Quadrant D Data is divided into 100 sec bins |
 |
 |
| Parameter | Plot |
|---|---|
| CZT HV Monitor | 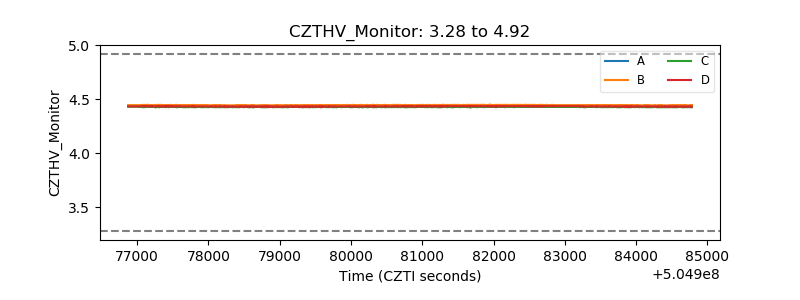 |
| D_VDD | 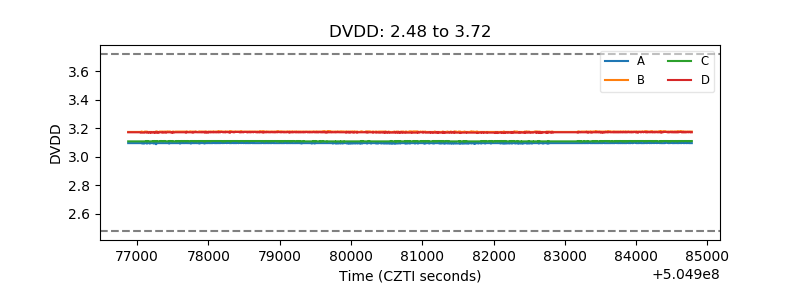 |
| Temperature 1 | 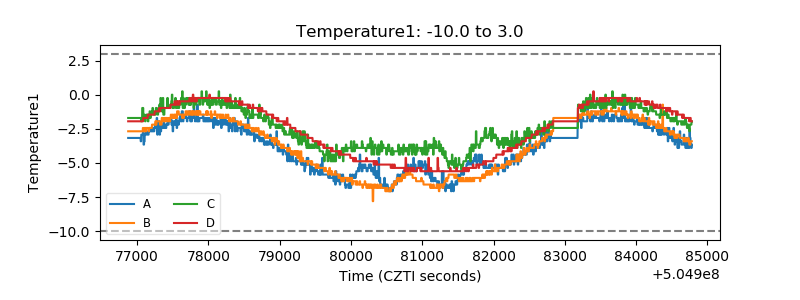 |
| Veto HV Monitor | 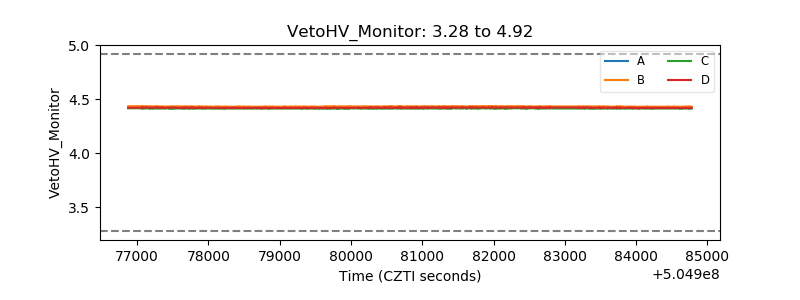 |
| Veto LLD | 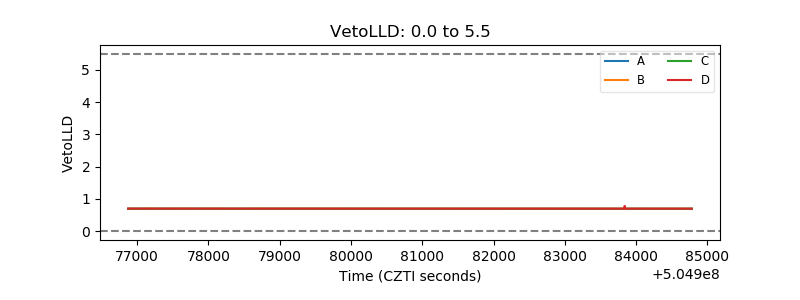 |
| Alpha Counter | 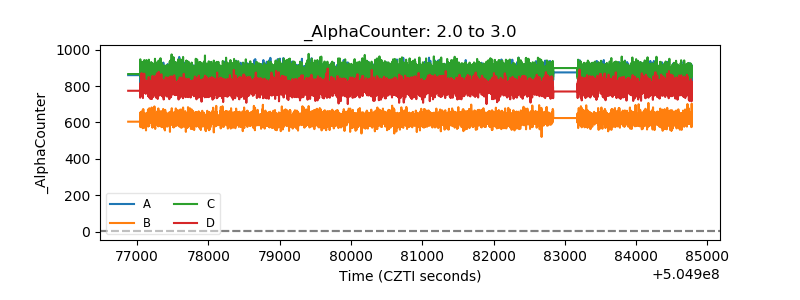 |
| _CPM_Rate | 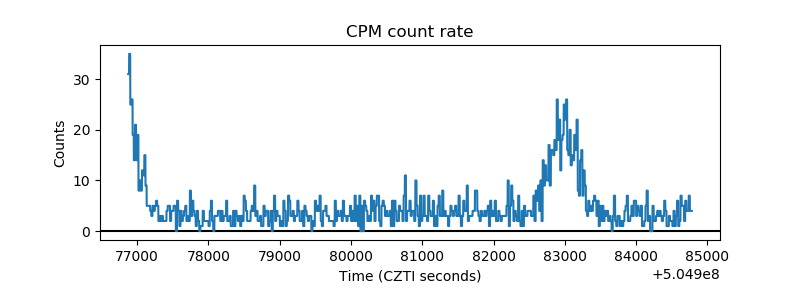 |
| CZT Counter | 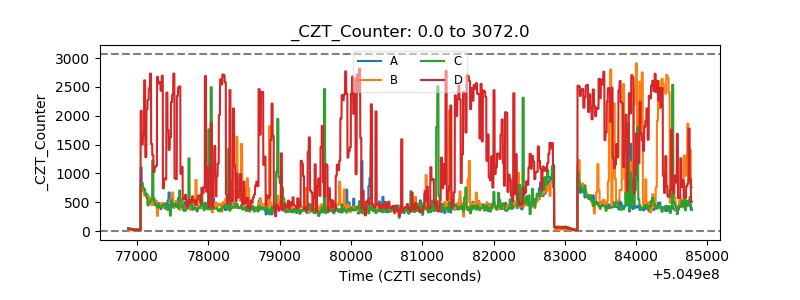 |
| +2.5 Volts monitor |  |
| +5 Volts monitor |  |
| _ROLL_ROT | 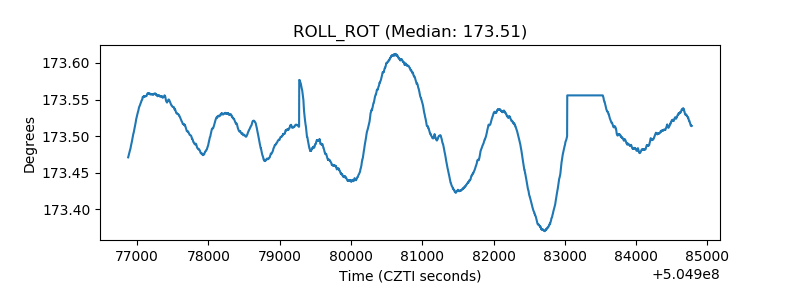 |
| _Roll_DEC | 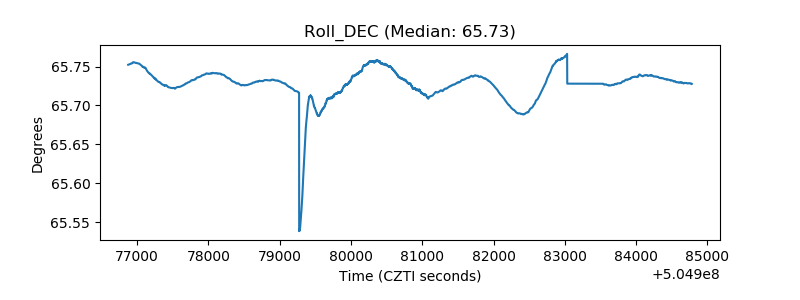 |
| _Roll_RA | 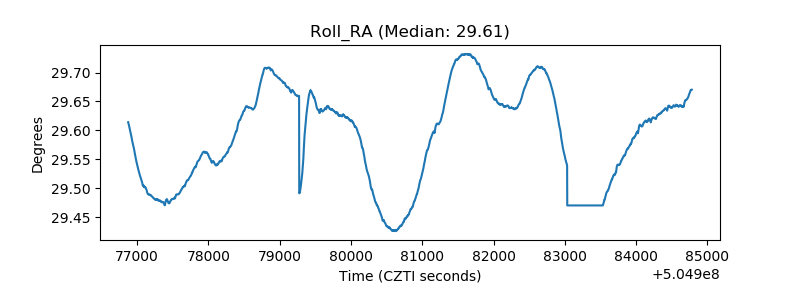 |
| Veto Counter | 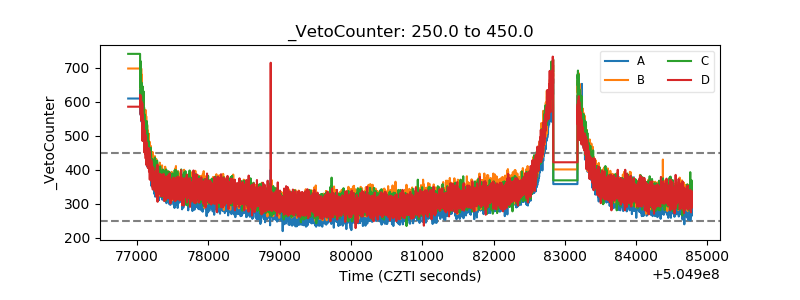 |