| Param | Original file | Final file |
|---|---|---|
| Filename | modeM0/AS1A14_099T01_9000006536_55523cztM0_level2.fits | modeM0/AS1A14_099T01_9000006536_55523cztM0_level2_quad_clean.evt |
| Size (bytes) | 475,963,200 | 105,338,880 |
| Size | 453.9 MB | 100.5 MB |
| Events in quadrant A | 3,327,454 | 702,588 |
| Events in quadrant B | 4,556,492 | 715,657 |
| Events in quadrant C | 3,734,547 | 656,799 |
| Events in quadrant D | 5,419,218 | 594,457 |
| Mode SS | |||
|---|---|---|---|
| Quadrant | BADHDUFLAG | Total packets | Discarded packets |
| A | 0 | 150 | 0 |
| B | 0 | 150 | 0 |
| C | 0 | 150 | 0 |
| D | 0 | 150 | 0 |
| Mode M0 | |||
|---|---|---|---|
| Quadrant | BADHDUFLAG | Total packets | Discarded packets |
| A | 0 | 15659 | 0 |
| B | 0 | 19179 | 0 |
| C | 0 | 16902 | 0 |
| D | 0 | 21403 | 0 |
| Quadrant | Total seconds | Saturated seconds | Saturation percentage |
|---|---|---|---|
| A | 7470 | 25 | 0.334672% |
| B | 7470 | 384 | 5.140562% |
| C | 7471 | 104 | 1.392049% |
| D | 7471 | 493 | 6.598849% |
Noise dominated data is calculated using 1-second bins in cleaned event files. If a bin has >2000 counts, and if more than 50% of those come from <1% of pixels, then it is considered to be noise-dominated and hence unusable.
| Quadrant | # 1 sec bins | Bins with >0 counts | Bins with >2000 counts | High rate bins dominated by noise | Noise dominated (total time) | Noise dominated (detector-on time) | Marked lightcurve |
|---|---|---|---|---|---|---|---|
| A | 7470 | 7470 | 20 | 20 | 0.27% | 0.27% | 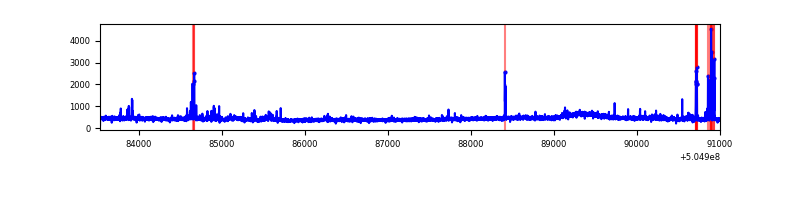 |
| B | 7470 | 7470 | 296 | 296 | 3.96% | 3.96% | 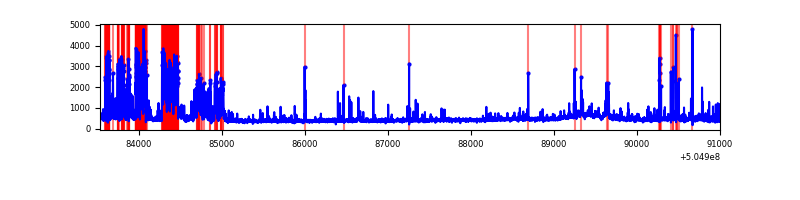 |
| C | 7471 | 7471 | 87 | 87 | 1.16% | 1.16% | 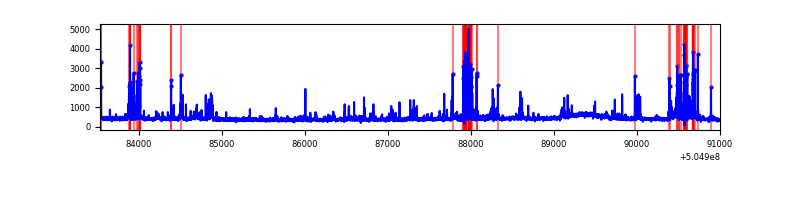 |
| D | 7471 | 7471 | 446 | 446 | 5.97% | 5.97% | 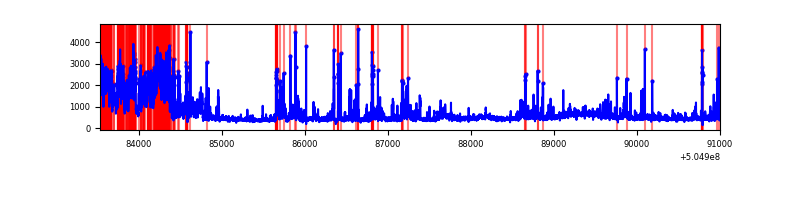 |
Top three noisy pixels from each quadrant. If the there are fewer than three noisy pixels in the level2.evt file, extra rows are filled as -1
| Pixel properties | Quadrant properties | ||||||
|---|---|---|---|---|---|---|---|
| Quadrant | DetID | PixID | Counts | Sigma | Mean | Median | Sigma |
| A | 0 | 8 | 96499 | 489.36 | 785 | 763 | 195.6 |
| A | 3 | 14 | 41331 | 207.36 | 785 | 763 | 195.6 |
| A | 4 | 205 | 37900 | 189.83 | 785 | 763 | 195.6 |
| B | 4 | 156 | 1079140 | 6658.81 | 759 | 732 | 162.0 |
| B | 0 | 171 | 120963 | 742.39 | 759 | 732 | 162.0 |
| B | 10 | 247 | 109440 | 671.24 | 759 | 732 | 162.0 |
| C | 13 | 3 | 245836 | 1178.93 | 762 | 753 | 207.9 |
| C | 9 | 38 | 210923 | 1010.99 | 762 | 753 | 207.9 |
| C | 10 | 19 | 80284 | 382.57 | 762 | 753 | 207.9 |
| D | 11 | 129 | 1730812 | 8151.46 | 747 | 714 | 212.2 |
| D | 2 | 153 | 150027 | 703.5 | 747 | 714 | 212.2 |
| D | 2 | 249 | 119993 | 561.99 | 747 | 714 | 212.2 |
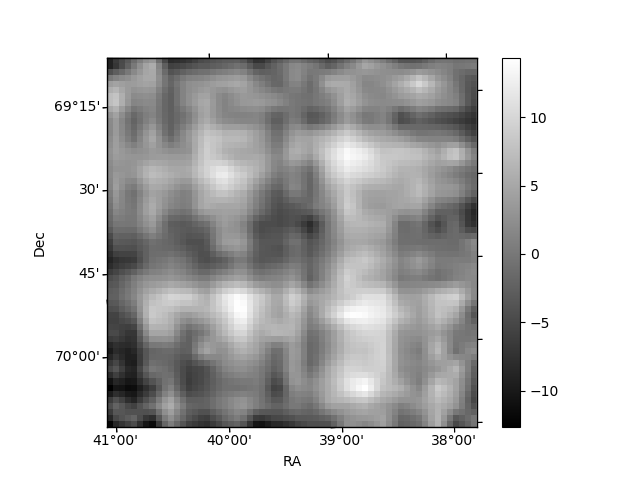
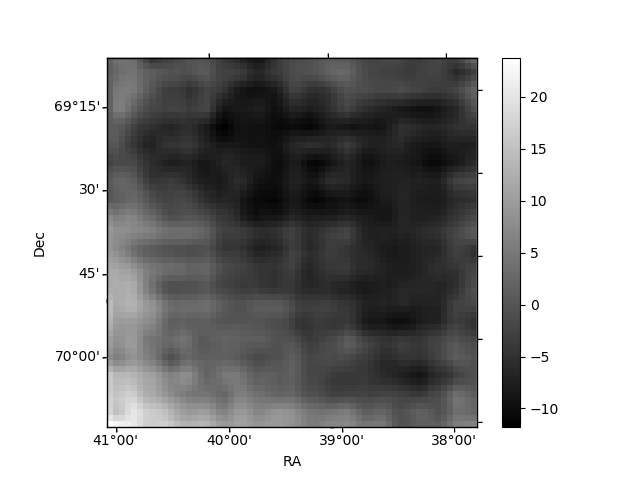
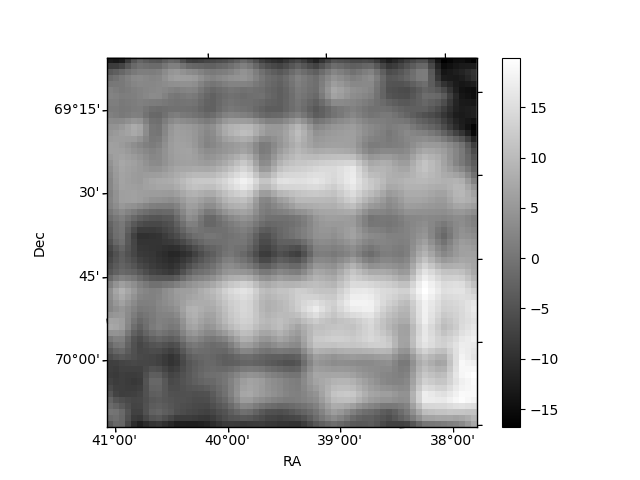
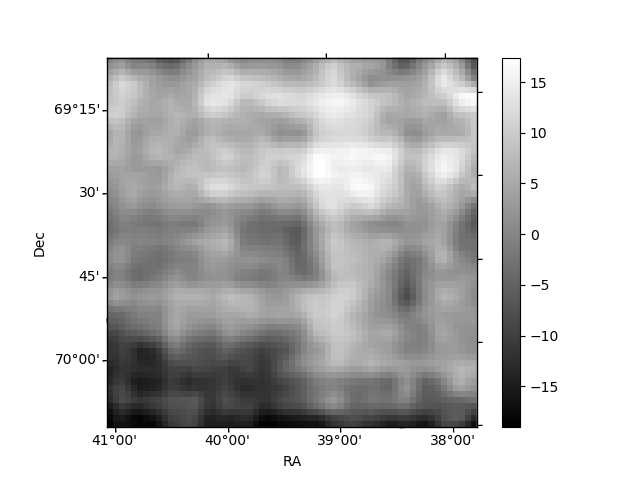
Histogram calculated using DETX and DETY for each event in the final _common_clean file
| Quadrant A | 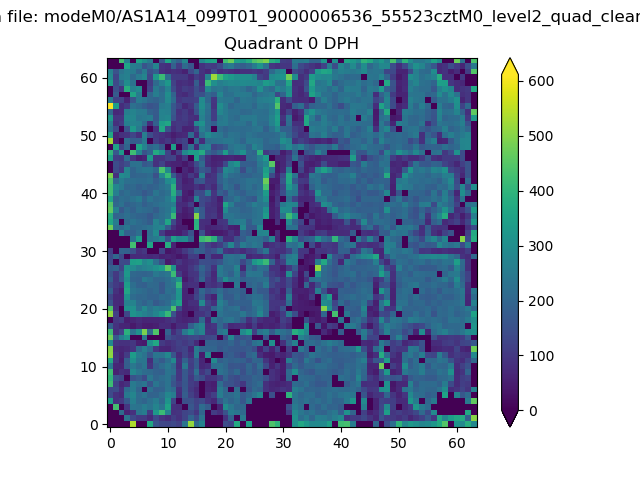 |
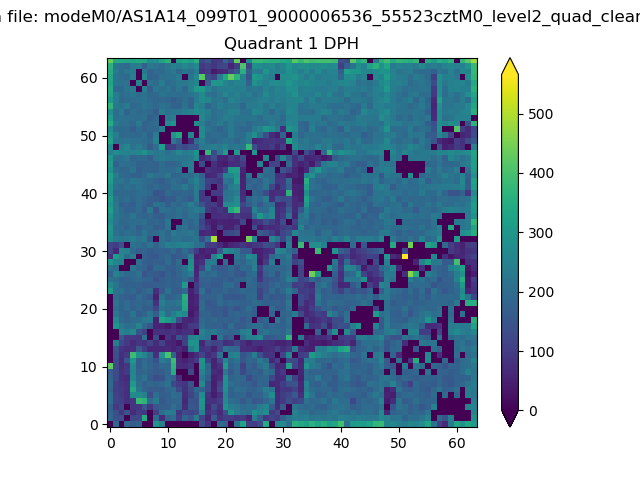 |
Quadrant B |
|---|---|---|---|
| Quadrant D | 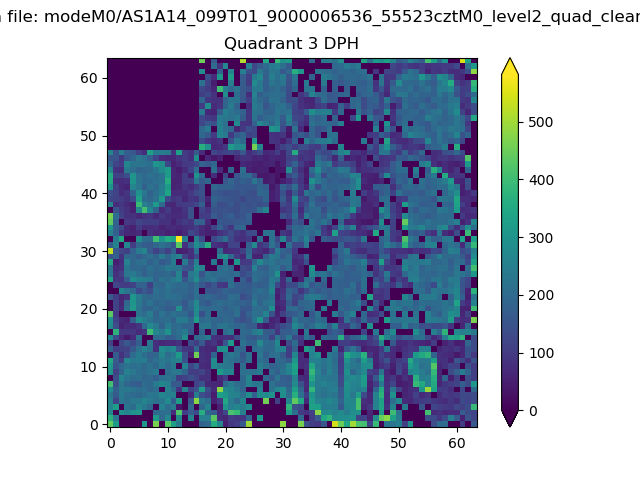 |
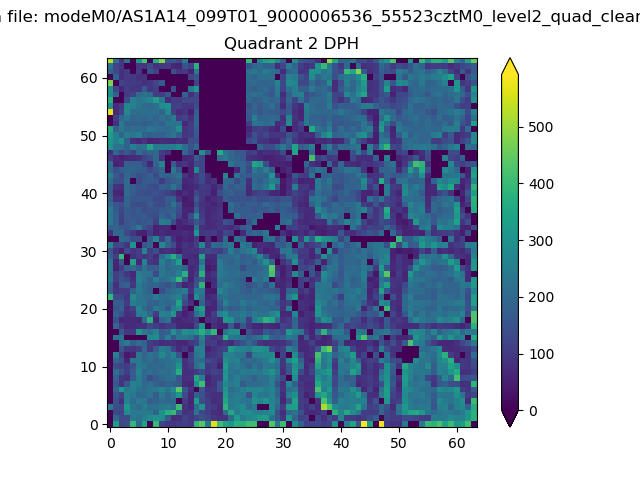 |
Quadrant C |
| Plot type | Count rate plots | Images |
|---|---|---|
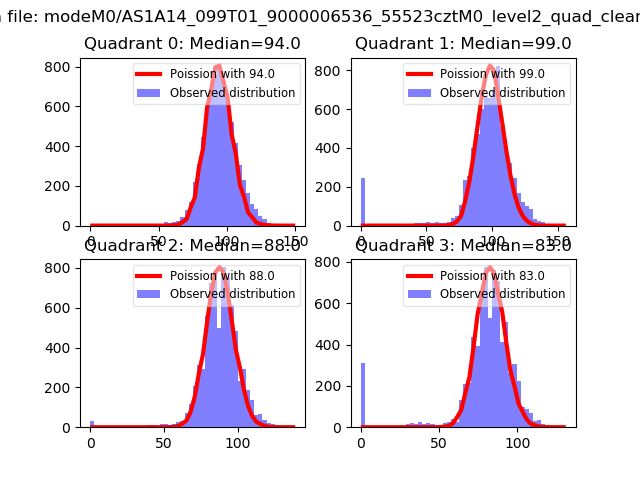
| Comparison with Poisson distribution Blue bars denote a histogram of data divided into 1 sec bins. Red curve is a Poisson curve with rate = median count rate of data. |
 |
 |
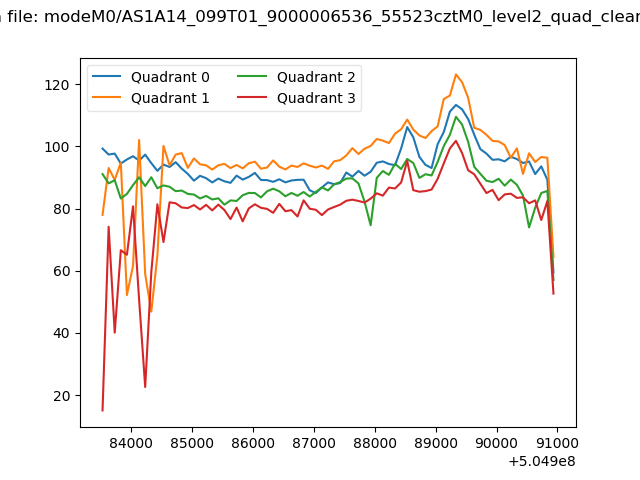
| Quadrant-wise count rates Data is divided into 100 sec bins |
 |
|
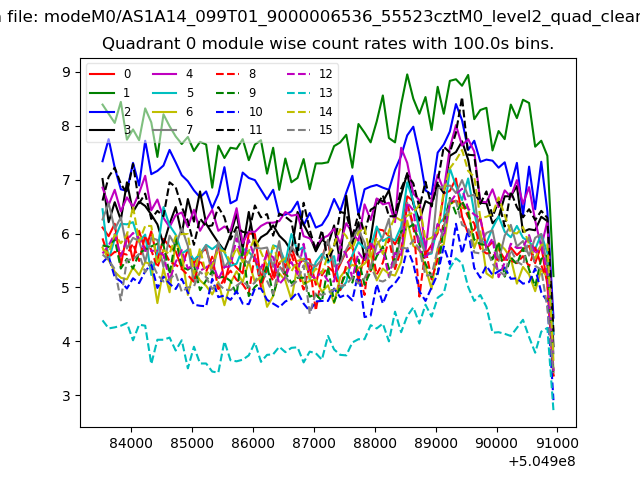
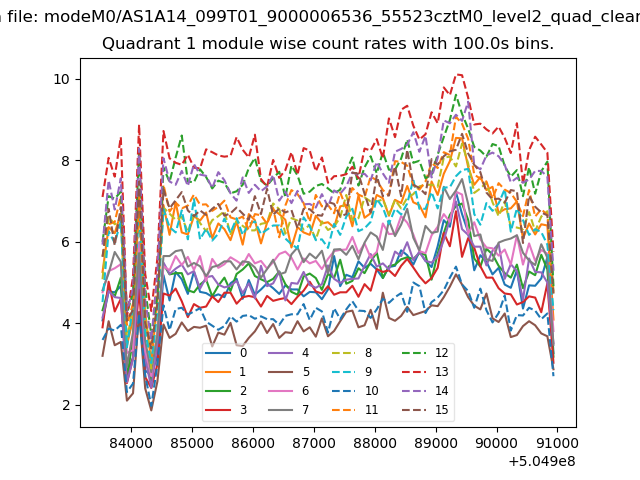
| Module-wise count rates for Quadrant A Data is divided into 100 sec bins |
 |
 |
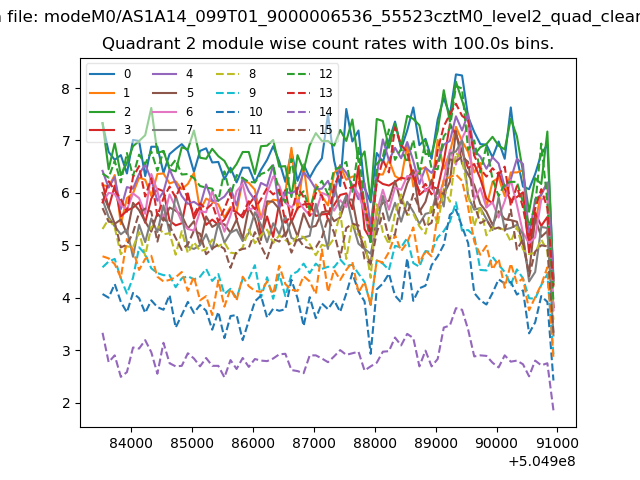
| Module-wise count rates for Quadrant B Data is divided into 100 sec bins |
 |
 |
| Module-wise count rates for Quadrant C Data is divided into 100 sec bins |
 |
 |
| Module-wise count rates for Quadrant D Data is divided into 100 sec bins |
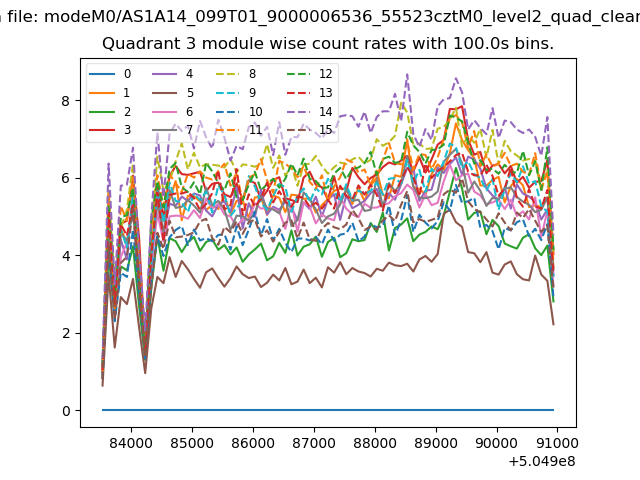 |
 |
| Parameter | Plot |
|---|---|
| CZT HV Monitor |  |
| D_VDD | 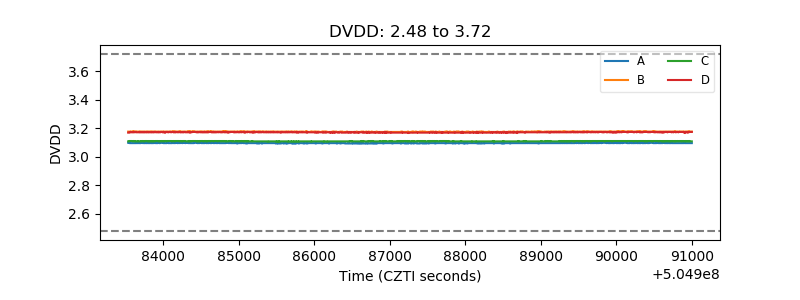 |
| Temperature 1 | 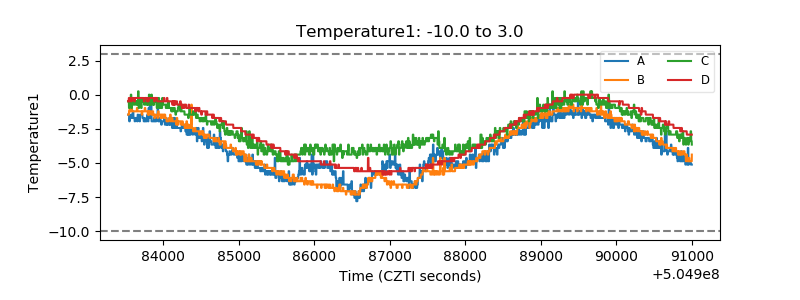 |
| Veto HV Monitor | 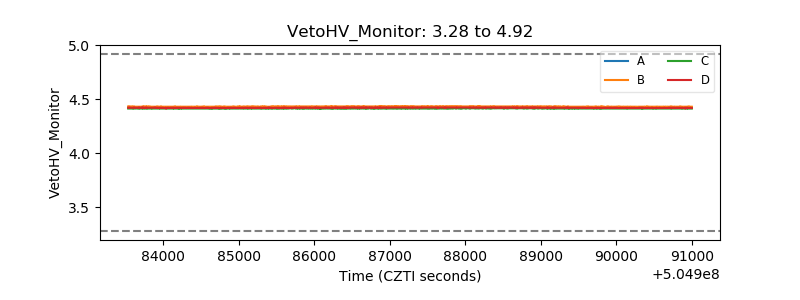 |
| Veto LLD | 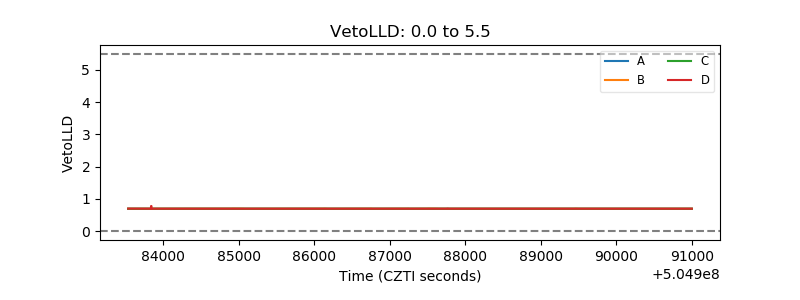 |
| Alpha Counter | 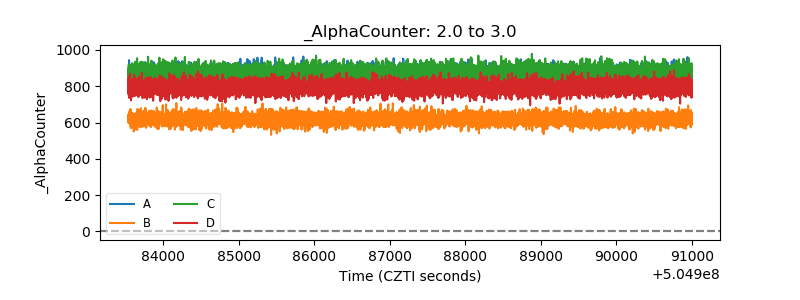 |
| _CPM_Rate | 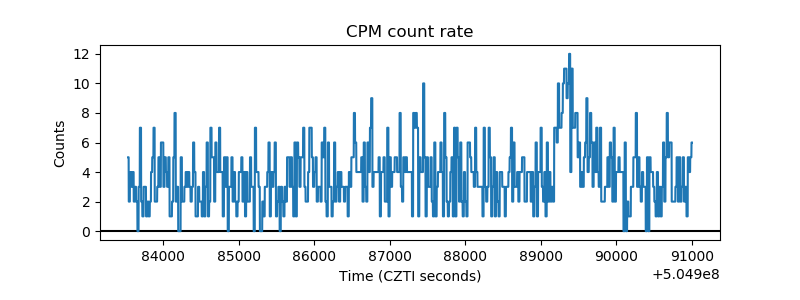 |
| CZT Counter | 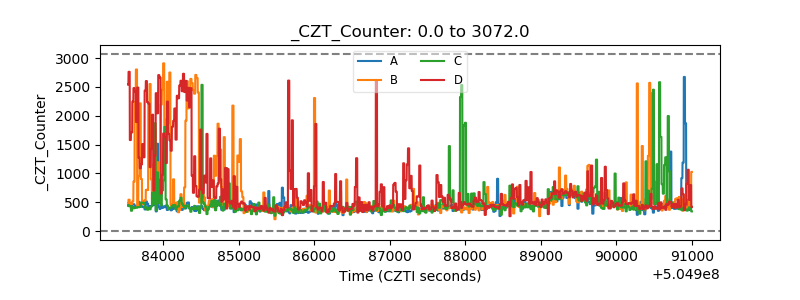 |
| +2.5 Volts monitor |  |
| +5 Volts monitor |  |
| _ROLL_ROT | 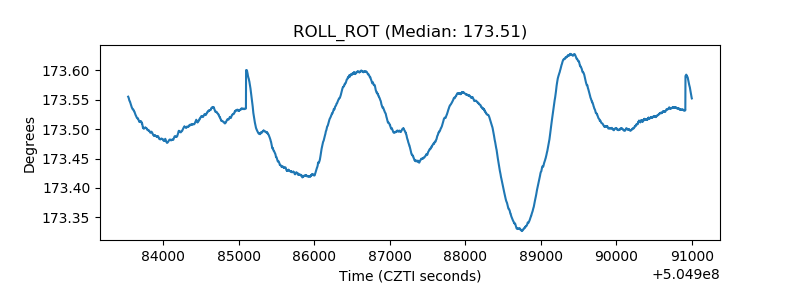 |
| _Roll_DEC | 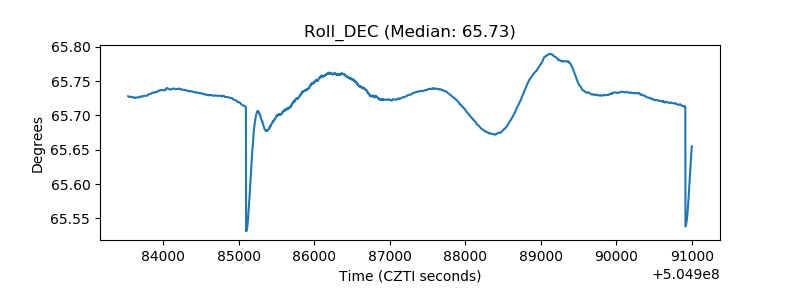 |
| _Roll_RA | 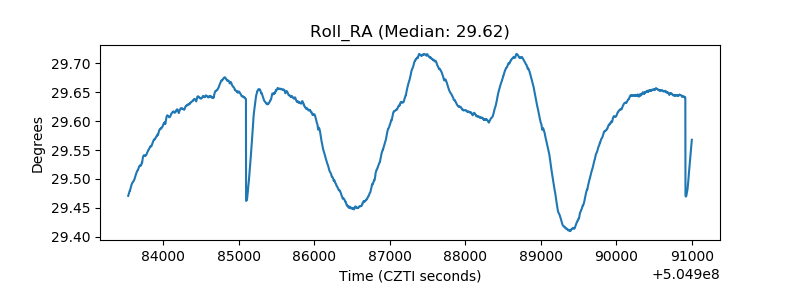 |
| Veto Counter | 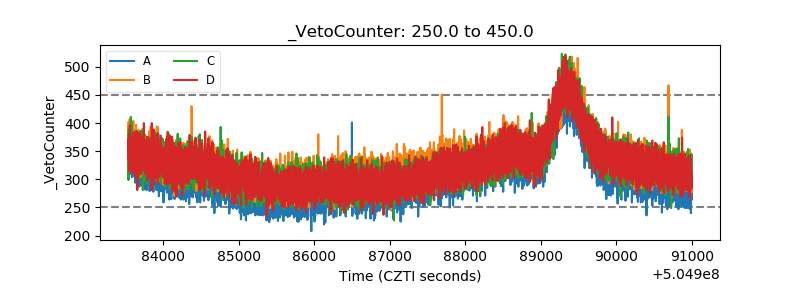 |