| Param | Original file | Final file |
|---|---|---|
| Filename | modeM0/AS1A14_099T01_9000006536_55524cztM0_level2.fits | modeM0/AS1A14_099T01_9000006536_55524cztM0_level2_quad_clean.evt |
| Size (bytes) | 482,621,760 | 117,858,240 |
| Size | 460.3 MB | 112.4 MB |
| Events in quadrant A | 4,268,056 | 765,624 |
| Events in quadrant B | 4,014,240 | 821,155 |
| Events in quadrant C | 3,890,660 | 726,412 |
| Events in quadrant D | 5,053,845 | 684,667 |
| Mode SS | |||
|---|---|---|---|
| Quadrant | BADHDUFLAG | Total packets | Discarded packets |
| A | 0 | 164 | 0 |
| B | 0 | 164 | 0 |
| C | 0 | 164 | 0 |
| D | 0 | 164 | 0 |
| Mode M0 | |||
|---|---|---|---|
| Quadrant | BADHDUFLAG | Total packets | Discarded packets |
| A | 0 | 18837 | 0 |
| B | 0 | 18079 | 0 |
| C | 0 | 18051 | 0 |
| D | 0 | 20962 | 0 |
| Quadrant | Total seconds | Saturated seconds | Saturation percentage |
|---|---|---|---|
| A | 8212 | 145 | 1.765709% |
| B | 8213 | 63 | 0.767077% |
| C | 8213 | 82 | 0.998417% |
| D | 8213 | 186 | 2.264702% |
Noise dominated data is calculated using 1-second bins in cleaned event files. If a bin has >2000 counts, and if more than 50% of those come from <1% of pixels, then it is considered to be noise-dominated and hence unusable.
| Quadrant | # 1 sec bins | Bins with >0 counts | Bins with >2000 counts | High rate bins dominated by noise | Noise dominated (total time) | Noise dominated (detector-on time) | Marked lightcurve |
|---|---|---|---|---|---|---|---|
| A | 8212 | 8212 | 121 | 121 | 1.47% | 1.47% | 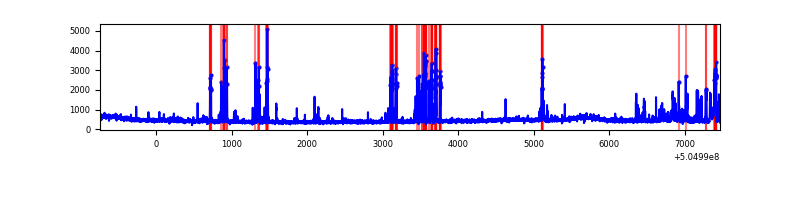 |
| B | 8213 | 8213 | 30 | 30 | 0.37% | 0.37% | 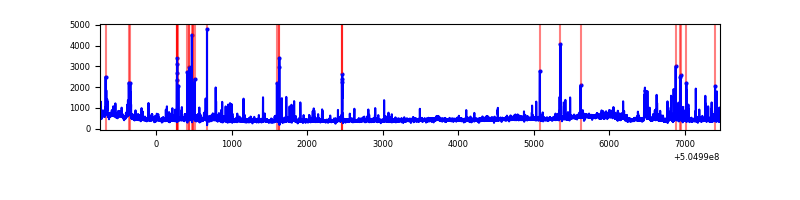 |
| C | 8213 | 8213 | 56 | 56 | 0.68% | 0.68% | 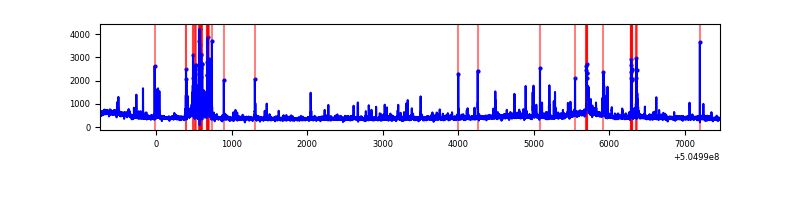 |
| D | 8213 | 8213 | 139 | 139 | 1.69% | 1.69% | 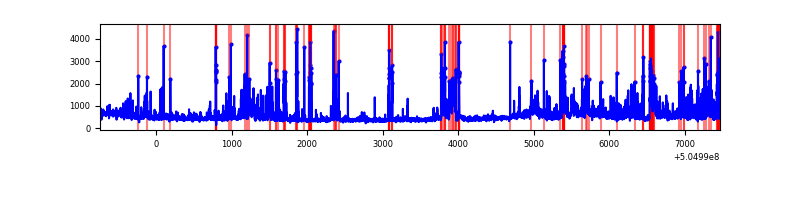 |
Top three noisy pixels from each quadrant. If the there are fewer than three noisy pixels in the level2.evt file, extra rows are filled as -1
| Pixel properties | Quadrant properties | ||||||
|---|---|---|---|---|---|---|---|
| Quadrant | DetID | PixID | Counts | Sigma | Mean | Median | Sigma |
| A | 0 | 8 | 529699 | 2444.31 | 868 | 844 | 216.4 |
| A | 3 | 114 | 154356 | 709.52 | 868 | 844 | 216.4 |
| A | 4 | 159 | 124707 | 572.48 | 868 | 844 | 216.4 |
| B | 0 | 171 | 171496 | 930.67 | 859 | 828 | 183.4 |
| B | 7 | 0 | 134619 | 729.58 | 859 | 828 | 183.4 |
| B | 5 | 236 | 70922 | 382.23 | 859 | 828 | 183.4 |
| C | 13 | 3 | 213898 | 921.57 | 848 | 842 | 231.2 |
| C | 10 | 19 | 99610 | 427.22 | 848 | 842 | 231.2 |
| C | 14 | 254 | 54316 | 231.3 | 848 | 842 | 231.2 |
| D | 11 | 129 | 400353 | 1655.7 | 846 | 808 | 241.3 |
| D | 2 | 153 | 398499 | 1648.02 | 846 | 808 | 241.3 |
| D | 15 | 125 | 252364 | 1042.44 | 846 | 808 | 241.3 |
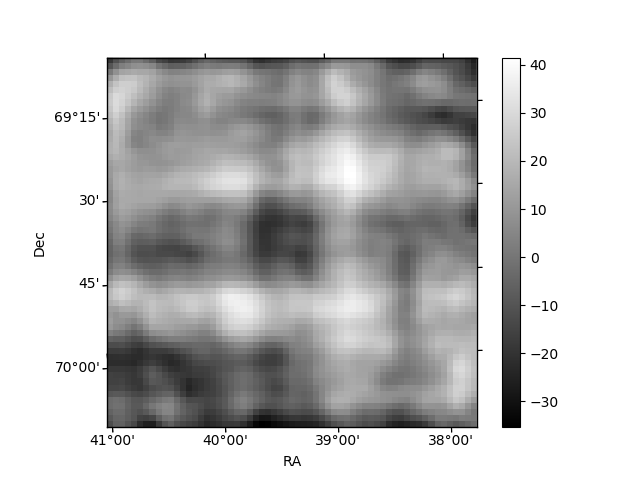
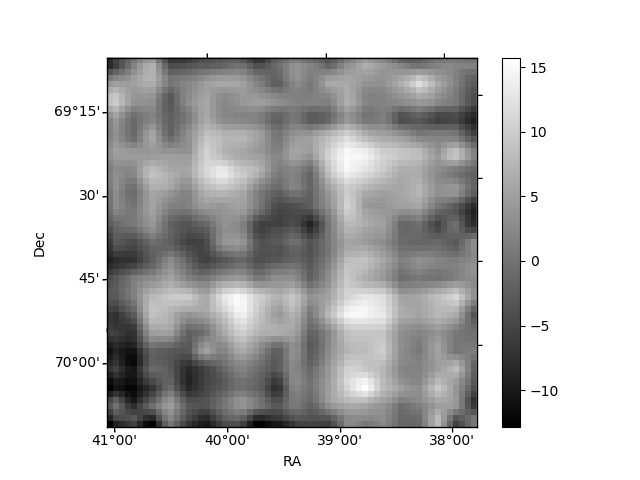
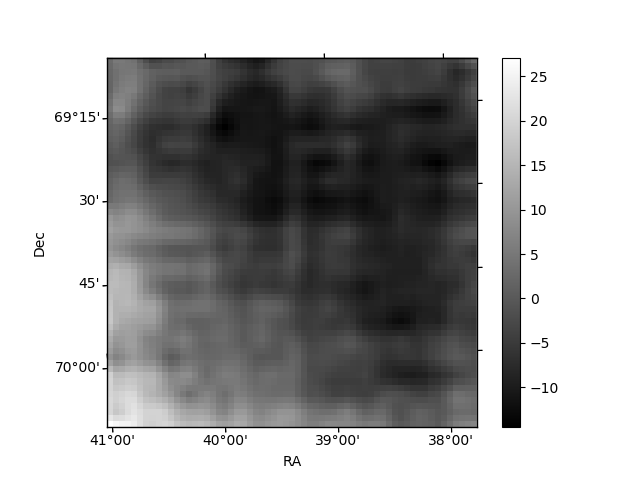
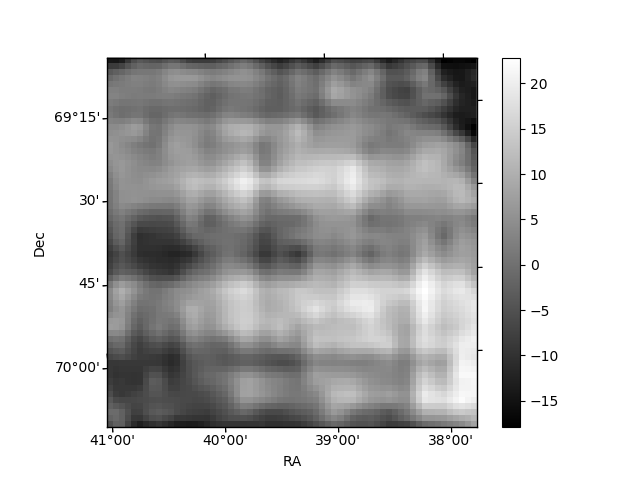
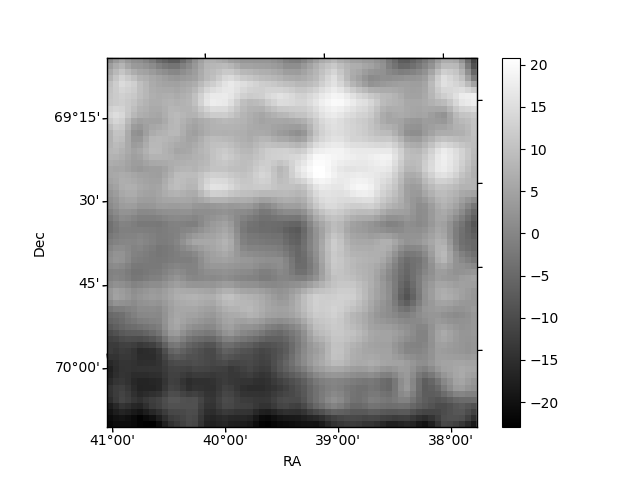
Histogram calculated using DETX and DETY for each event in the final _common_clean file
| Quadrant A | 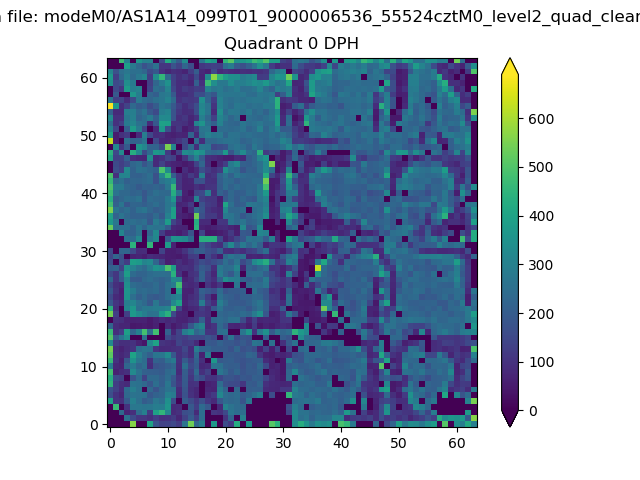 |
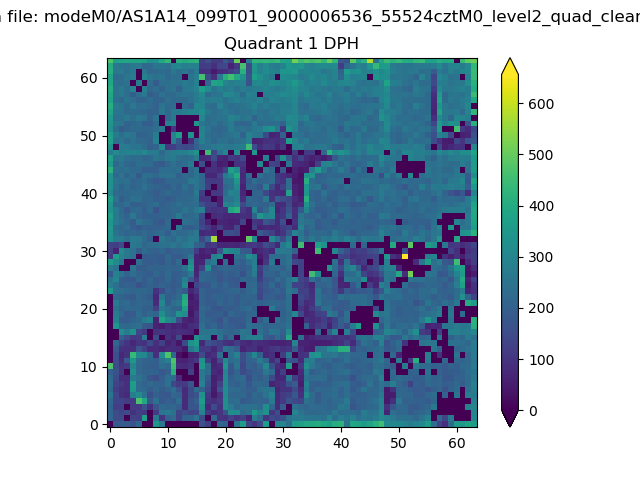 |
Quadrant B |
|---|---|---|---|
| Quadrant D | 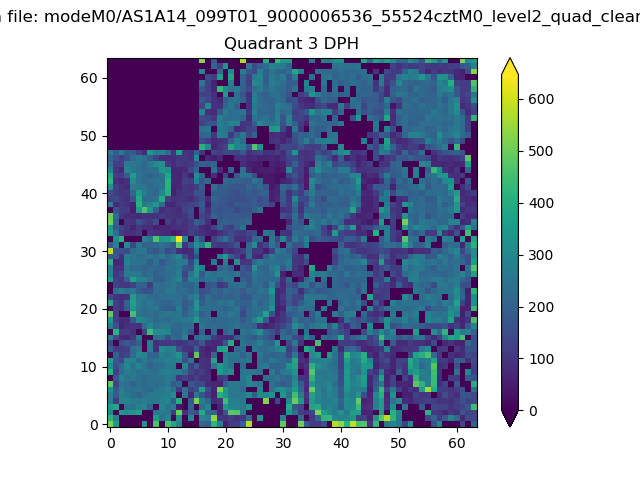 |
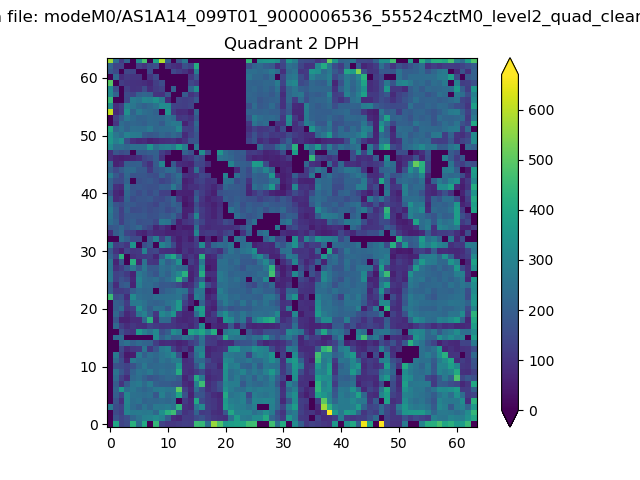 |
Quadrant C |
| Plot type | Count rate plots | Images |
|---|---|---|
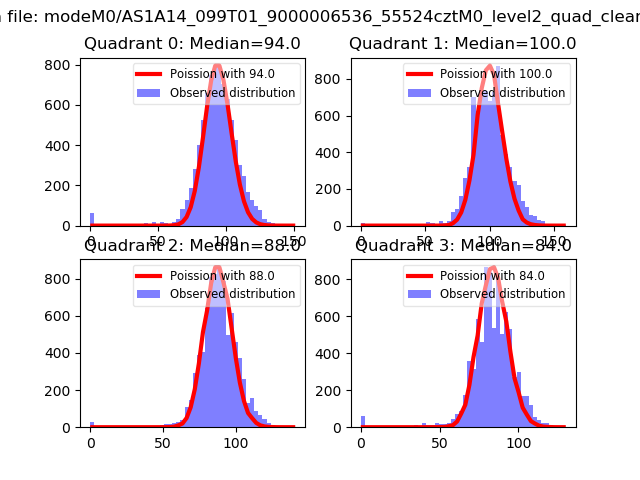
| Comparison with Poisson distribution Blue bars denote a histogram of data divided into 1 sec bins. Red curve is a Poisson curve with rate = median count rate of data. |
 |
 |
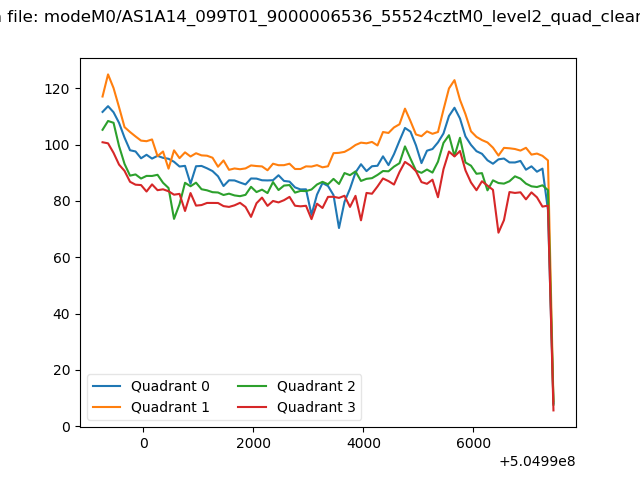
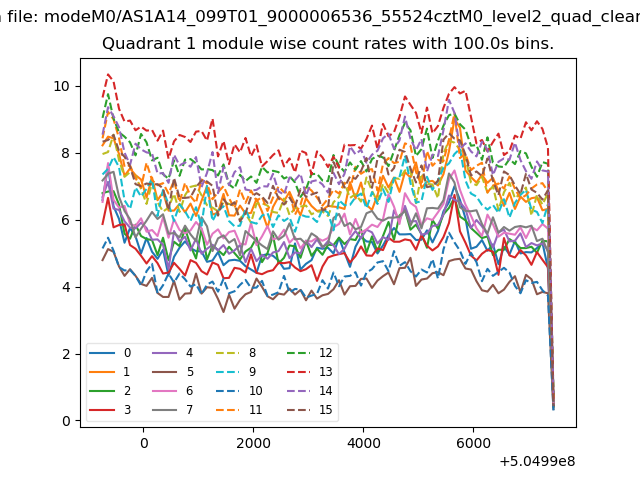
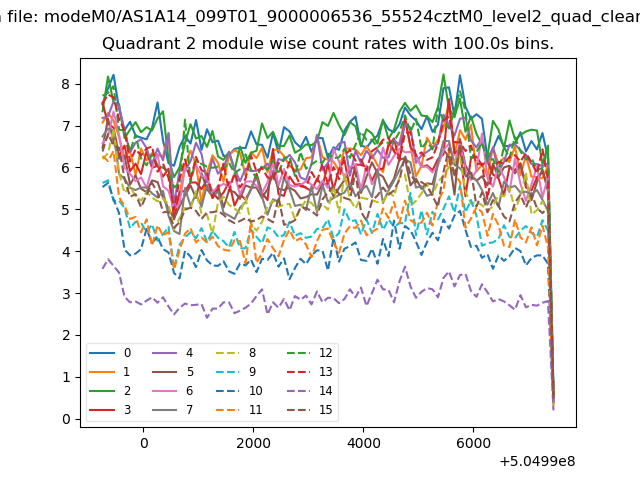
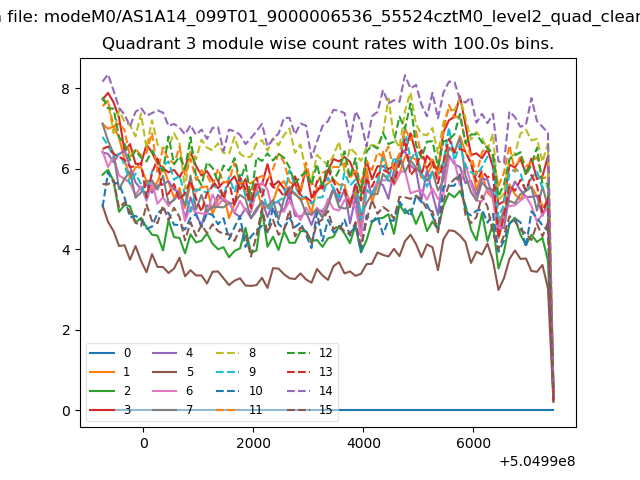
| Quadrant-wise count rates Data is divided into 100 sec bins |
 |
|
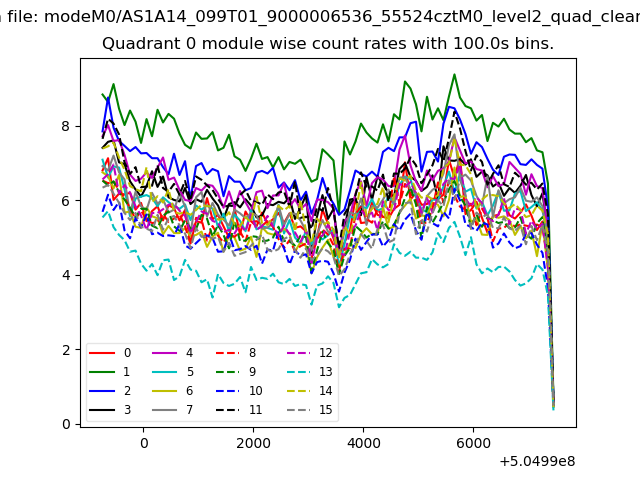
| Module-wise count rates for Quadrant A Data is divided into 100 sec bins |
 |
 |
| Module-wise count rates for Quadrant B Data is divided into 100 sec bins |
 |
 |
| Module-wise count rates for Quadrant C Data is divided into 100 sec bins |
 |
 |
| Module-wise count rates for Quadrant D Data is divided into 100 sec bins |
 |
 |
| Parameter | Plot |
|---|---|
| CZT HV Monitor | 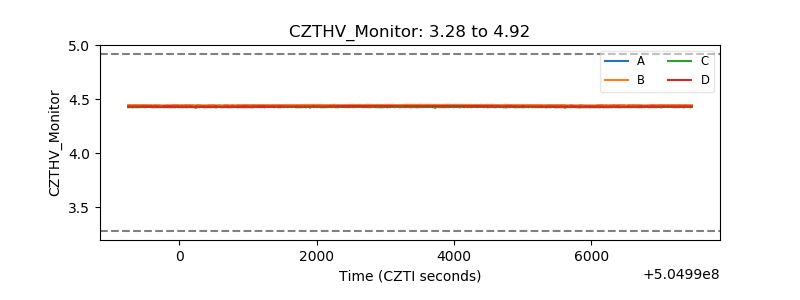 |
| D_VDD | 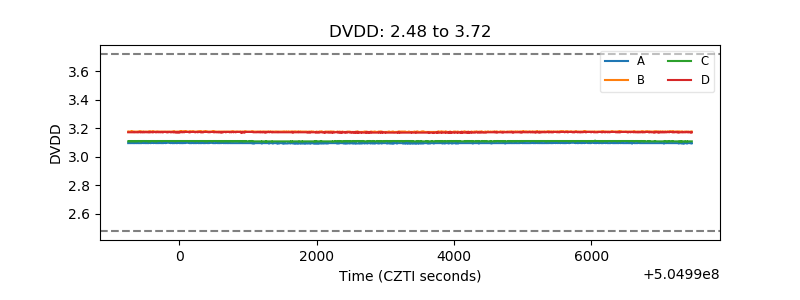 |
| Temperature 1 | 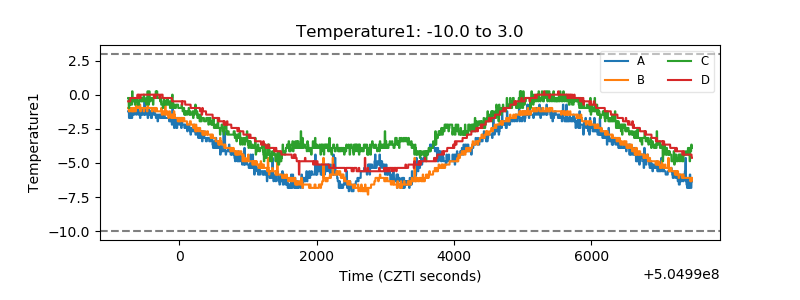 |
| Veto HV Monitor | 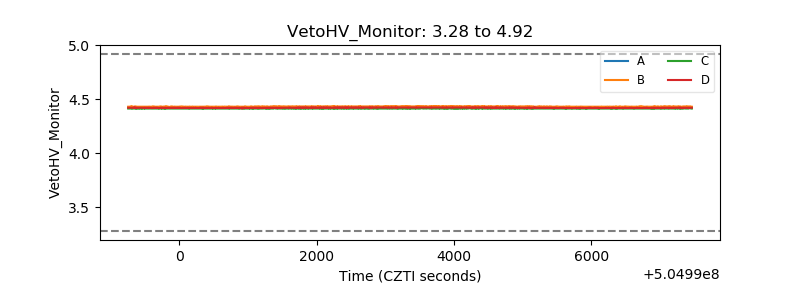 |
| Veto LLD | 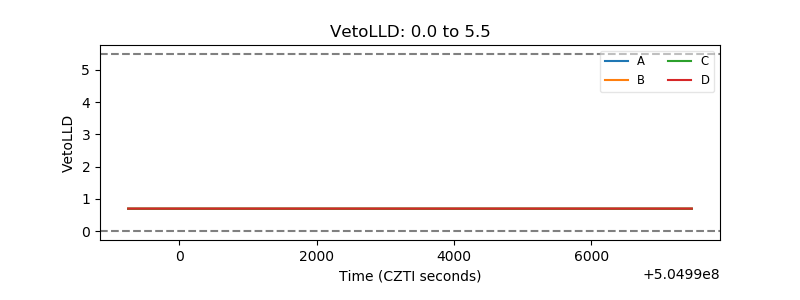 |
| Alpha Counter | 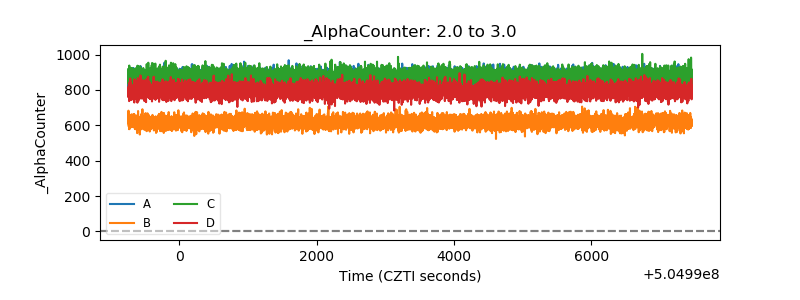 |
| _CPM_Rate | 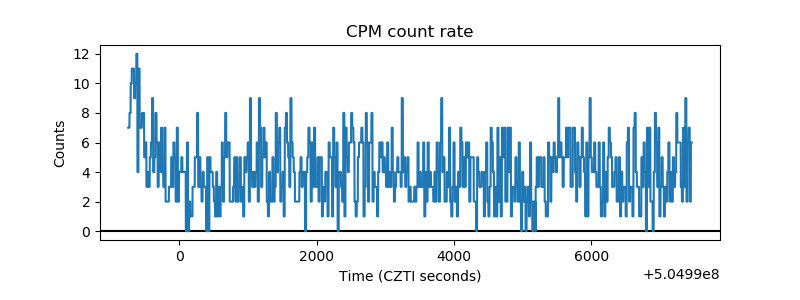 |
| CZT Counter | 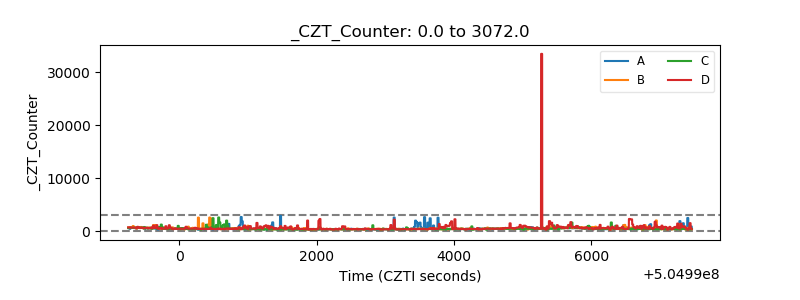 |
| +2.5 Volts monitor |  |
| +5 Volts monitor |  |
| _ROLL_ROT | 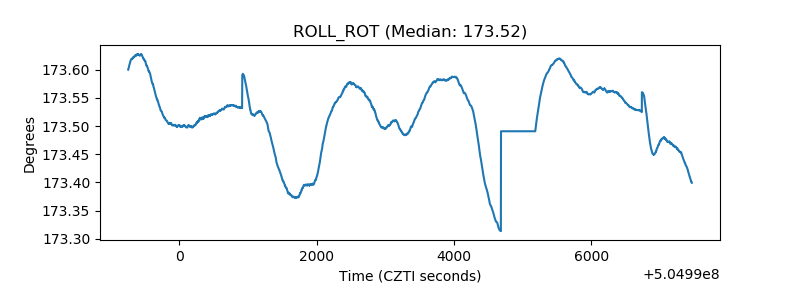 |
| _Roll_DEC | 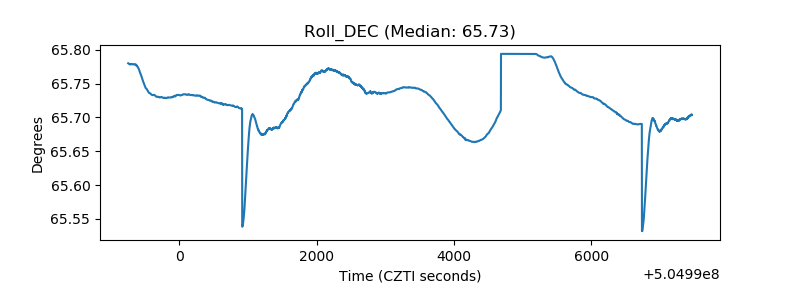 |
| _Roll_RA | 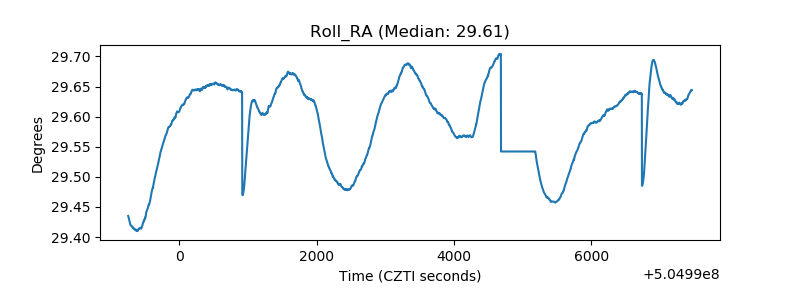 |
| Veto Counter | 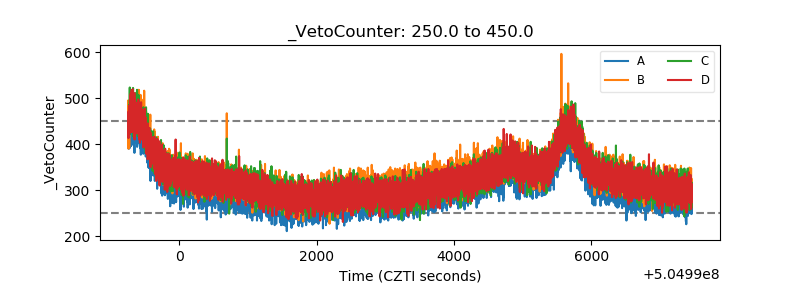 |