| Param | Original file | Final file |
|---|---|---|
| Filename | modeM0/AS1A14_099T01_9000006536_55527cztM0_level2.fits | modeM0/AS1A14_099T01_9000006536_55527cztM0_level2_quad_clean.evt |
| Size (bytes) | 673,943,040 | 143,104,320 |
| Size | 642.7 MB | 136.5 MB |
| Events in quadrant A | 6,190,218 | 913,711 |
| Events in quadrant B | 6,217,520 | 976,705 |
| Events in quadrant C | 5,225,591 | 890,308 |
| Events in quadrant D | 6,499,925 | 825,548 |
| Mode M9 | |||
|---|---|---|---|
| Quadrant | BADHDUFLAG | Total packets | Discarded packets |
| A | 0 | 2 | 1 |
| B | 0 | 2 | 2 |
| C | 0 | 2 | 2 |
| D | 0 | 2 | 2 |
| Mode SS | |||
|---|---|---|---|
| Quadrant | BADHDUFLAG | Total packets | Discarded packets |
| A | 0 | 236 | 26 |
| B | 0 | 235 | 23 |
| C | 0 | 236 | 20 |
| D | 0 | 236 | 30 |
| Mode M0 | |||
|---|---|---|---|
| Quadrant | BADHDUFLAG | Total packets | Discarded packets |
| A | 0 | 30848 | 4608 |
| B | 0 | 31572 | 5030 |
| C | 0 | 27445 | 3572 |
| D | 0 | 33235 | 6165 |
| Quadrant | Total seconds | Saturated seconds | Saturation percentage |
|---|---|---|---|
| A | 10478 | 407 | 3.884329% |
| B | 10482 | 421 | 4.016409% |
| C | 10555 | 174 | 1.648508% |
| D | 10404 | 285 | 2.739331% |
Noise dominated data is calculated using 1-second bins in cleaned event files. If a bin has >2000 counts, and if more than 50% of those come from <1% of pixels, then it is considered to be noise-dominated and hence unusable.
| Quadrant | # 1 sec bins | Bins with >0 counts | Bins with >2000 counts | High rate bins dominated by noise | Noise dominated (total time) | Noise dominated (detector-on time) | Marked lightcurve |
|---|---|---|---|---|---|---|---|
| A | 13112 | 10839 | 272 | 272 | 2.07% | 2.51% | 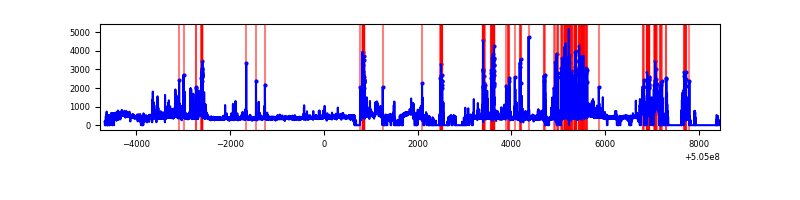 |
| B | 13073 | 10873 | 139 | 139 | 1.06% | 1.28% | 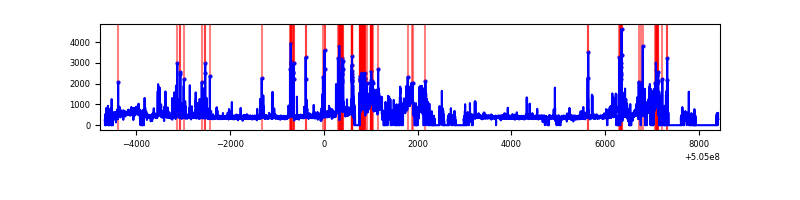 |
| C | 13101 | 10928 | 91 | 91 | 0.69% | 0.83% | 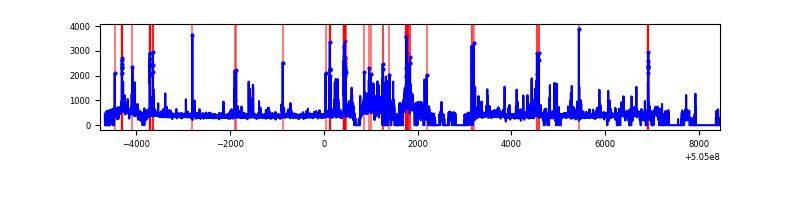 |
| D | 13162 | 10755 | 240 | 240 | 1.82% | 2.23% | 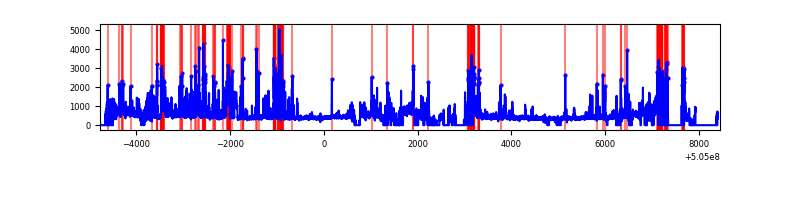 |
Top three noisy pixels from each quadrant. If the there are fewer than three noisy pixels in the level2.evt file, extra rows are filled as -1
| Pixel properties | Quadrant properties | ||||||
|---|---|---|---|---|---|---|---|
| Quadrant | DetID | PixID | Counts | Sigma | Mean | Median | Sigma |
| A | 0 | 8 | 790789 | 2968.91 | 1076 | 1049 | 266.0 |
| A | 4 | 159 | 528787 | 1983.95 | 1076 | 1049 | 266.0 |
| A | 7 | 14 | 284415 | 1065.27 | 1076 | 1049 | 266.0 |
| B | 5 | 172 | 1338373 | 5799.99 | 1070 | 1031 | 230.6 |
| B | 7 | 0 | 187803 | 810.02 | 1070 | 1031 | 230.6 |
| B | 5 | 236 | 123299 | 530.27 | 1070 | 1031 | 230.6 |
| C | 9 | 38 | 428813 | 1473.38 | 1066 | 1057 | 290.3 |
| C | 15 | 147 | 161030 | 551.02 | 1066 | 1057 | 290.3 |
| C | 13 | 3 | 154978 | 530.17 | 1066 | 1057 | 290.3 |
| D | 11 | 129 | 639531 | 2149.76 | 1045 | 999 | 297.0 |
| D | 8 | 245 | 452202 | 1519.07 | 1045 | 999 | 297.0 |
| D | 15 | 125 | 356544 | 1197.02 | 1045 | 999 | 297.0 |
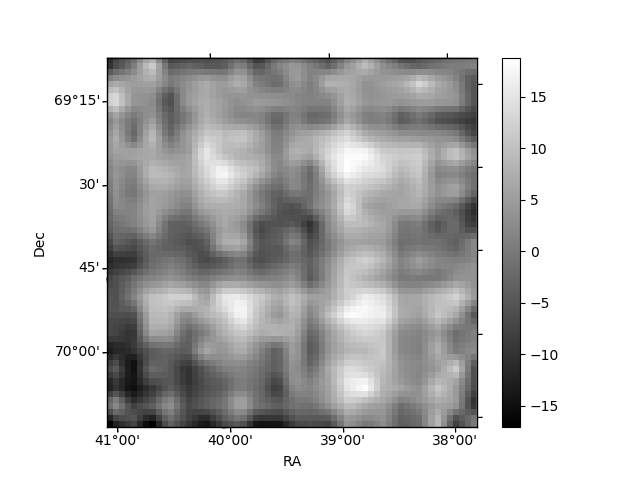
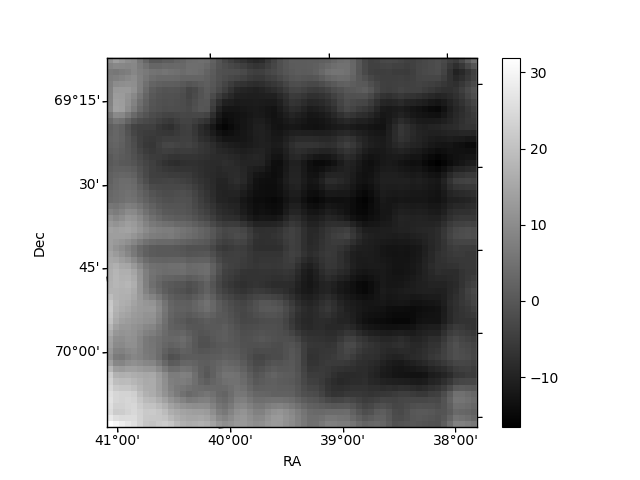
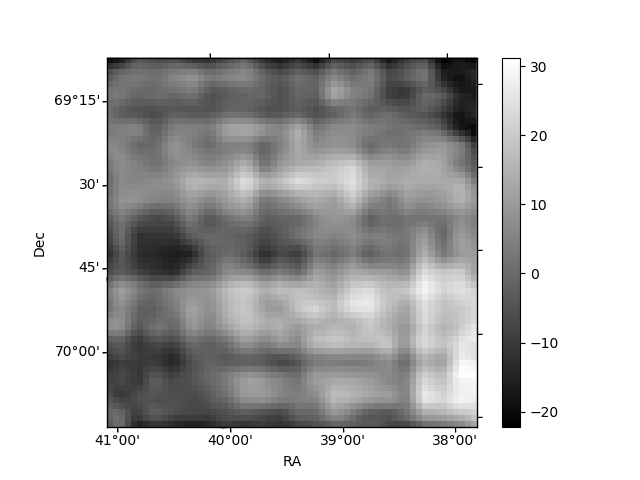
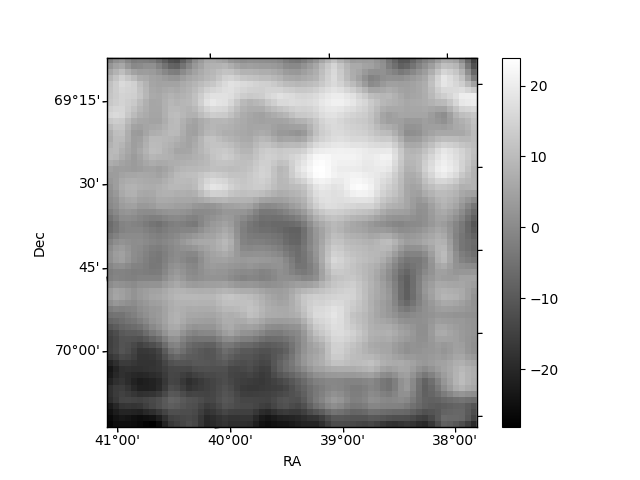
Histogram calculated using DETX and DETY for each event in the final _common_clean file
| Quadrant A | 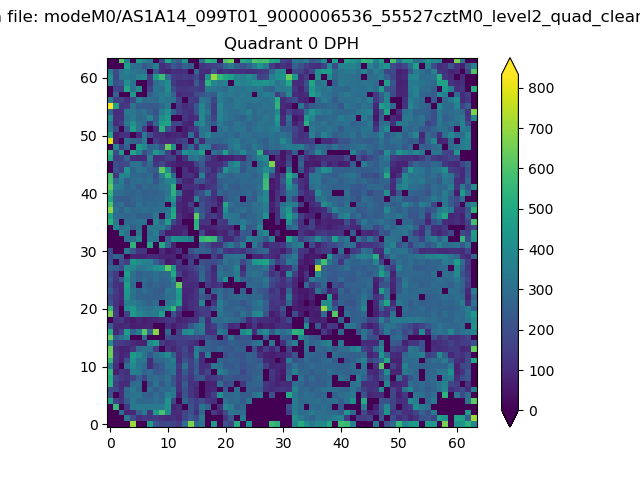 |
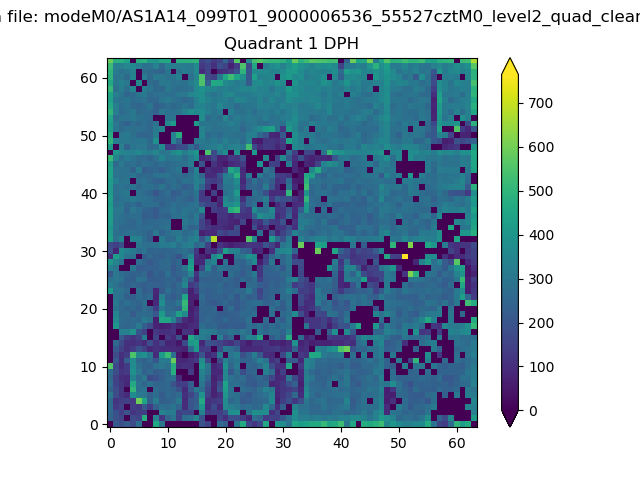 |
Quadrant B |
|---|---|---|---|
| Quadrant D | 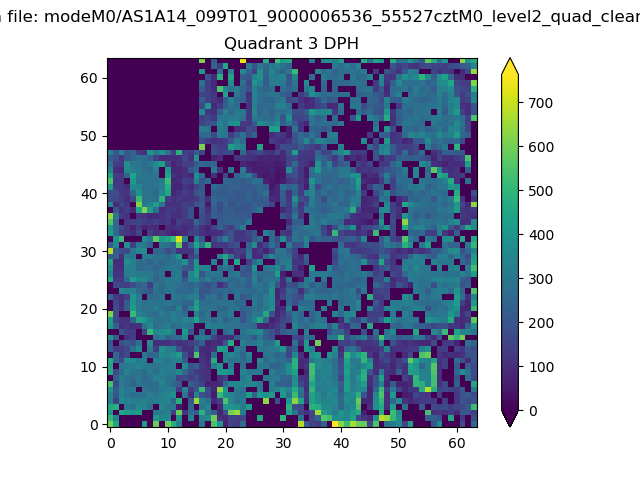 |
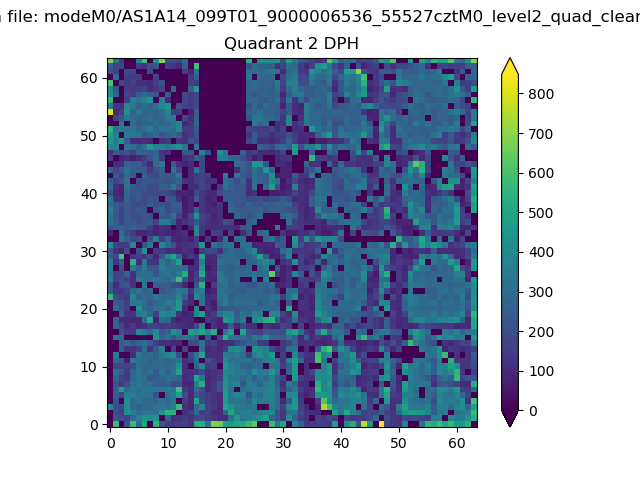 |
Quadrant C |
| Plot type | Count rate plots | Images |
|---|---|---|
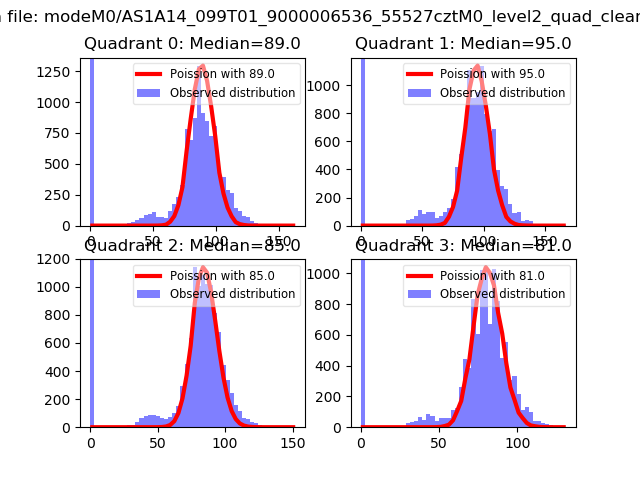
| Comparison with Poisson distribution Blue bars denote a histogram of data divided into 1 sec bins. Red curve is a Poisson curve with rate = median count rate of data. |
 |
 |
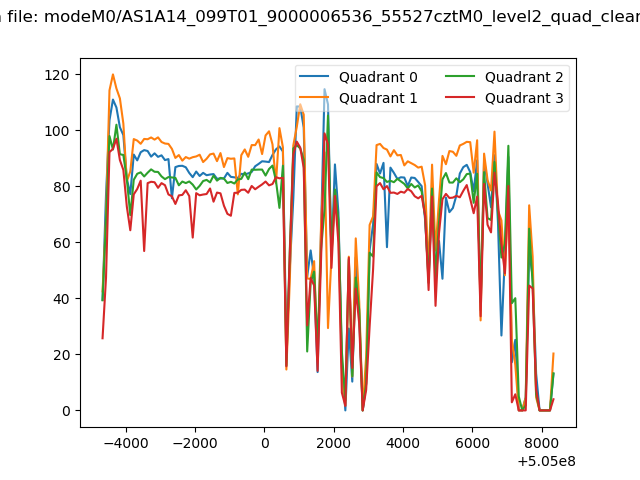
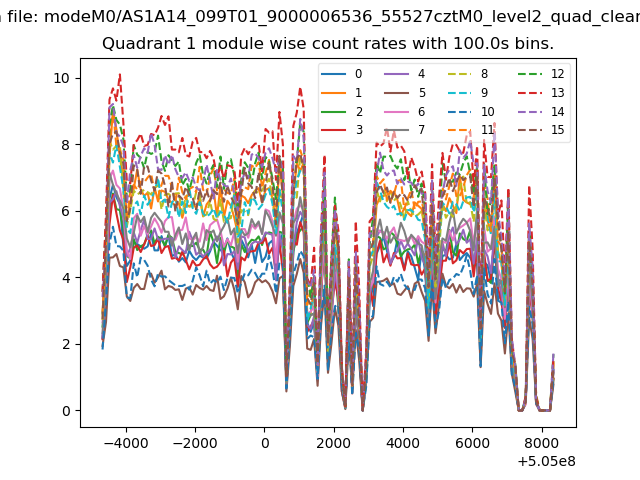
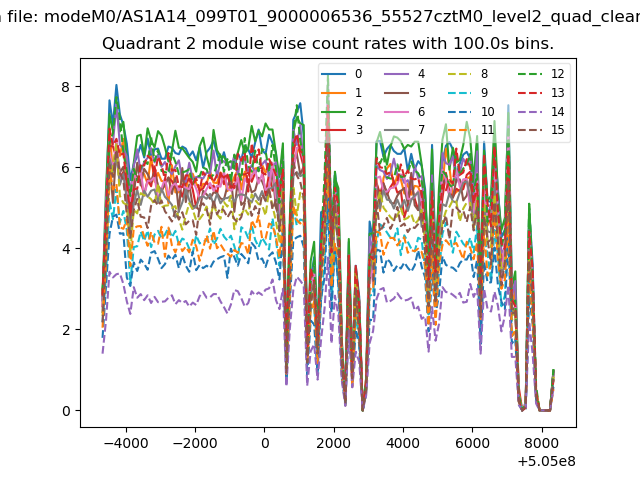
| Quadrant-wise count rates Data is divided into 100 sec bins |
 |
|
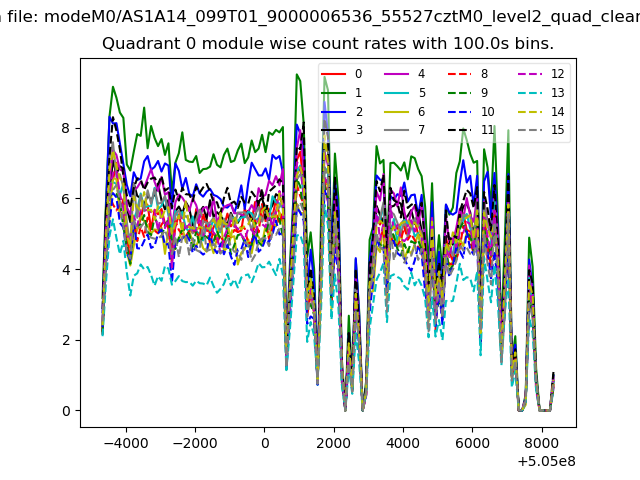
| Module-wise count rates for Quadrant A Data is divided into 100 sec bins |
 |
 |
| Module-wise count rates for Quadrant B Data is divided into 100 sec bins |
 |
 |
| Module-wise count rates for Quadrant C Data is divided into 100 sec bins |
 |
 |
| Module-wise count rates for Quadrant D Data is divided into 100 sec bins |
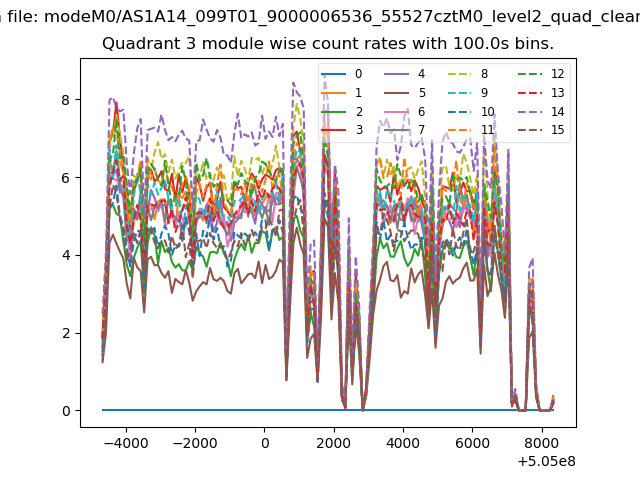 |
 |
| Parameter | Plot |
|---|---|
| CZT HV Monitor | 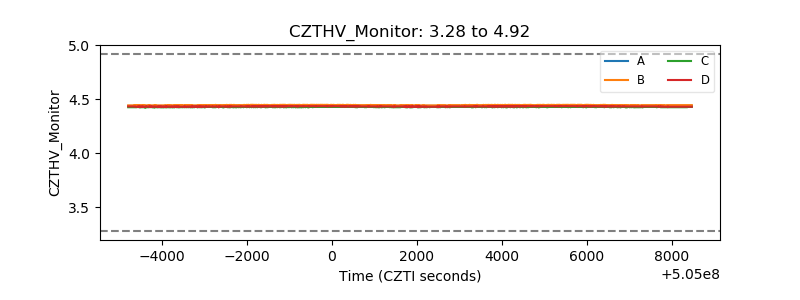 |
| D_VDD | 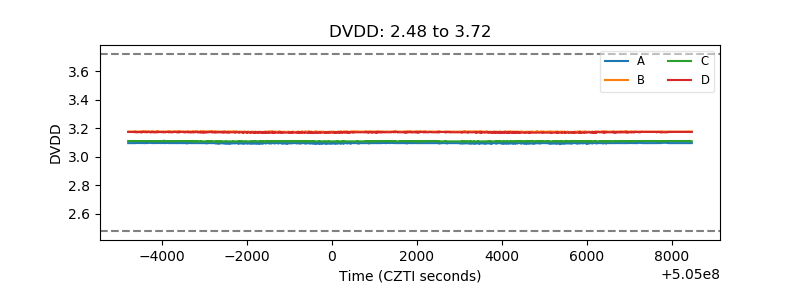 |
| Temperature 1 | 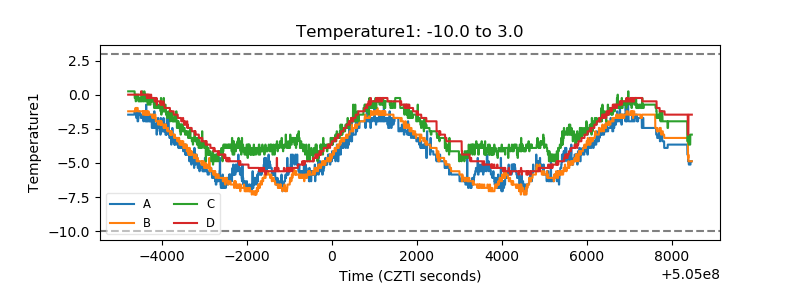 |
| Veto HV Monitor | 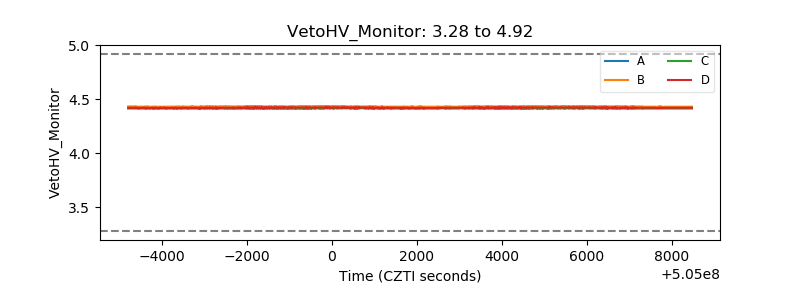 |
| Veto LLD | 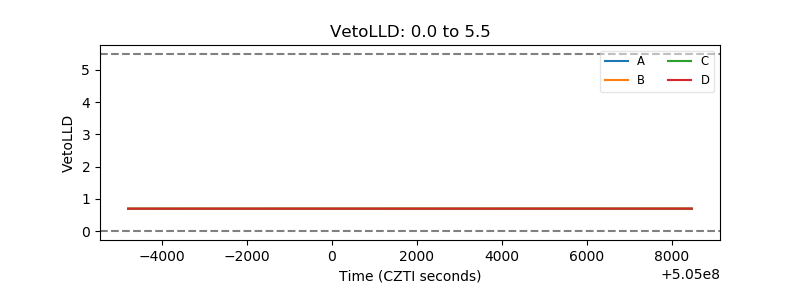 |
| Alpha Counter | 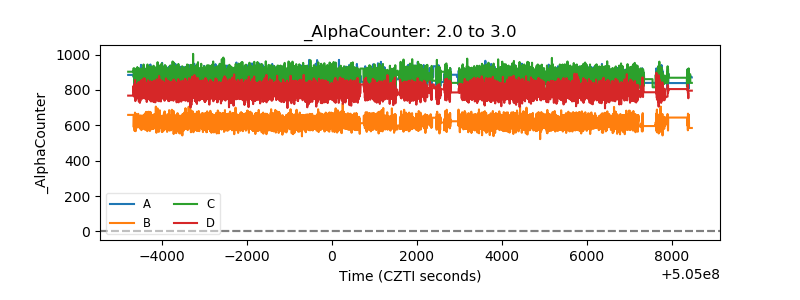 |
| _CPM_Rate | 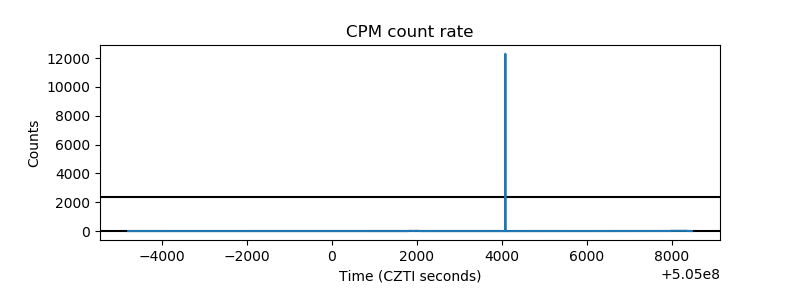 |
| CZT Counter | 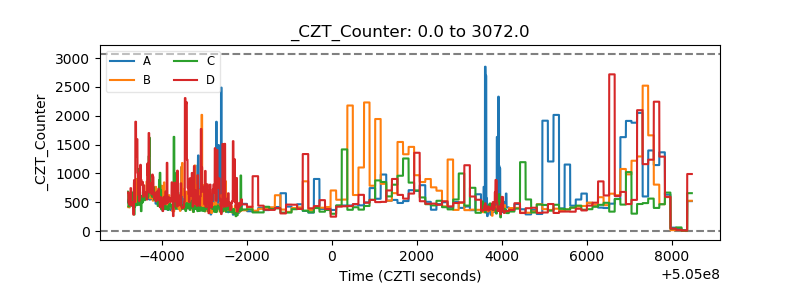 |
| +2.5 Volts monitor |  |
| +5 Volts monitor |  |
| _ROLL_ROT | 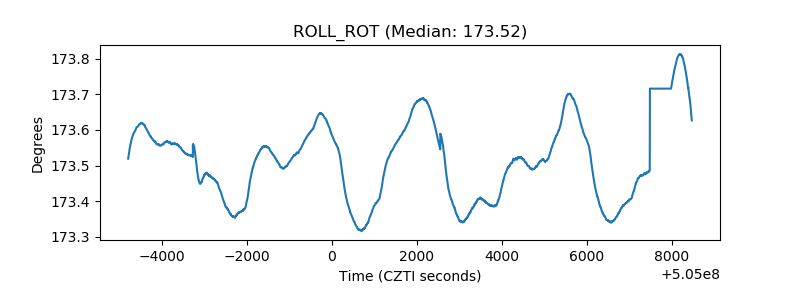 |
| _Roll_DEC | 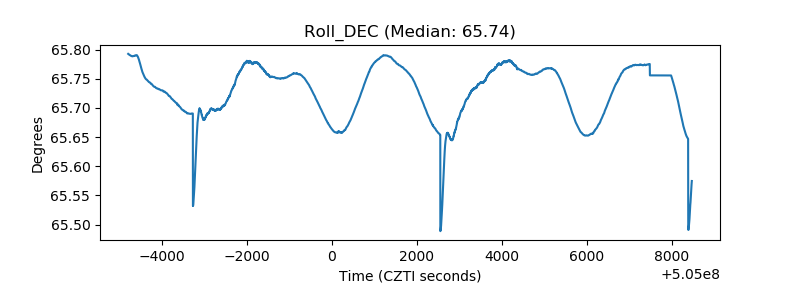 |
| _Roll_RA | 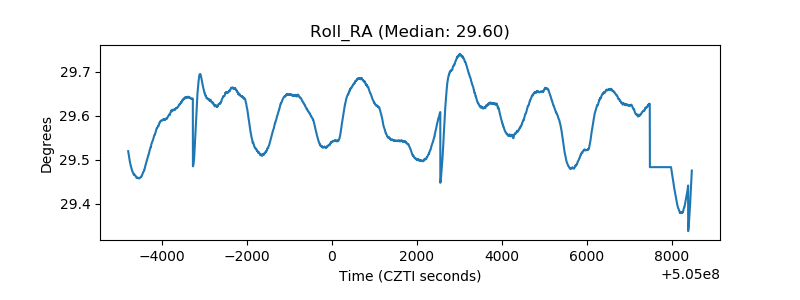 |
| Veto Counter | 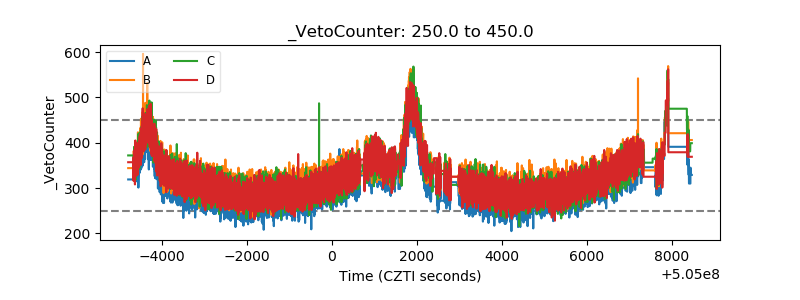 |