| Param | Original file | Final file |
|---|---|---|
| Filename | modeM0/AS1A14_099T01_9000006536_55528cztM0_level2.fits | modeM0/AS1A14_099T01_9000006536_55528cztM0_level2_quad_clean.evt |
| Size (bytes) | 518,673,600 | 101,957,760 |
| Size | 494.6 MB | 97.2 MB |
| Events in quadrant A | 3,655,195 | 675,599 |
| Events in quadrant B | 3,327,345 | 726,927 |
| Events in quadrant C | 4,447,478 | 639,674 |
| Events in quadrant D | 7,190,892 | 526,843 |
| Mode M9 | |||
|---|---|---|---|
| Quadrant | BADHDUFLAG | Total packets | Discarded packets |
| A | 0 | 14 | 0 |
| B | 0 | 14 | 0 |
| C | 0 | 14 | 0 |
| D | 0 | 14 | 0 |
| Mode SS | |||
|---|---|---|---|
| Quadrant | BADHDUFLAG | Total packets | Discarded packets |
| A | 0 | 152 | 0 |
| B | 0 | 152 | 0 |
| C | 0 | 152 | 0 |
| D | 0 | 152 | 0 |
| Mode M0 | |||
|---|---|---|---|
| Quadrant | BADHDUFLAG | Total packets | Discarded packets |
| A | 0 | 16525 | 2 |
| B | 0 | 15554 | 2 |
| C | 0 | 18735 | 2 |
| D | 0 | 26885 | 2 |
| Quadrant | Total seconds | Saturated seconds | Saturation percentage |
|---|---|---|---|
| A | 7444 | 118 | 1.585169% |
| B | 7445 | 83 | 1.114842% |
| C | 7445 | 255 | 3.425118% |
| D | 7445 | 1226 | 16.467428% |
Noise dominated data is calculated using 1-second bins in cleaned event files. If a bin has >2000 counts, and if more than 50% of those come from <1% of pixels, then it is considered to be noise-dominated and hence unusable.
| Quadrant | # 1 sec bins | Bins with >0 counts | Bins with >2000 counts | High rate bins dominated by noise | Noise dominated (total time) | Noise dominated (detector-on time) | Marked lightcurve |
|---|---|---|---|---|---|---|---|
| A | 8804 | 7446 | 73 | 73 | 0.83% | 0.98% | 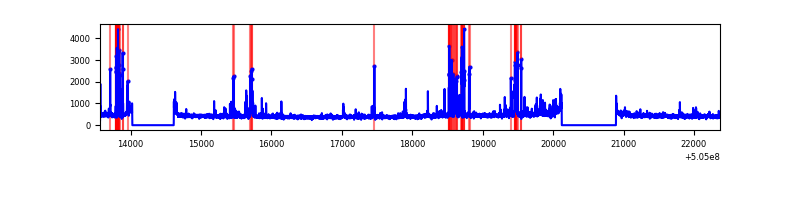 |
| B | 8805 | 7447 | 15 | 15 | 0.17% | 0.20% | 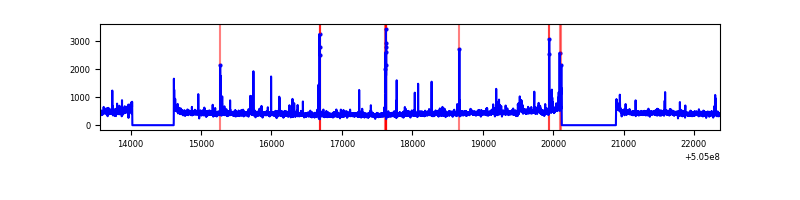 |
| C | 8805 | 7447 | 196 | 196 | 2.23% | 2.63% | 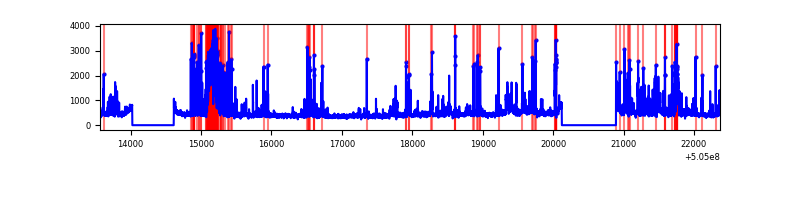 |
| D | 8805 | 7447 | 1018 | 1018 | 11.56% | 13.67% | 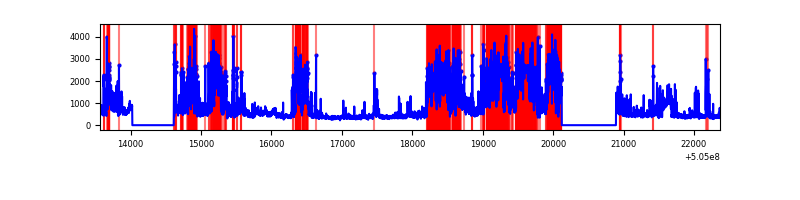 |
Top three noisy pixels from each quadrant. If the there are fewer than three noisy pixels in the level2.evt file, extra rows are filled as -1
| Pixel properties | Quadrant properties | ||||||
|---|---|---|---|---|---|---|---|
| Quadrant | DetID | PixID | Counts | Sigma | Mean | Median | Sigma |
| A | 0 | 8 | 431744 | 2241.92 | 774 | 753 | 192.2 |
| A | 4 | 205 | 85744 | 442.1 | 774 | 753 | 192.2 |
| A | 4 | 159 | 50680 | 259.71 | 774 | 753 | 192.2 |
| B | 0 | 171 | 68995 | 413.26 | 771 | 743 | 165.2 |
| B | 7 | 252 | 31698 | 187.43 | 771 | 743 | 165.2 |
| B | 5 | 236 | 31223 | 184.55 | 771 | 743 | 165.2 |
| C | 9 | 38 | 594262 | 2884.86 | 752 | 746 | 205.7 |
| C | 15 | 147 | 583327 | 2831.71 | 752 | 746 | 205.7 |
| C | 13 | 3 | 107223 | 517.55 | 752 | 746 | 205.7 |
| D | 11 | 129 | 3415128 | 17368.5 | 692 | 659 | 196.6 |
| D | 8 | 160 | 258462 | 1311.38 | 692 | 659 | 196.6 |
| D | 8 | 245 | 222100 | 1126.41 | 692 | 659 | 196.6 |
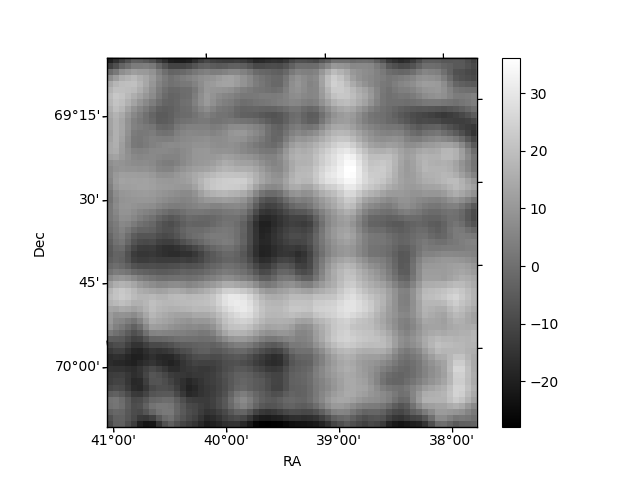
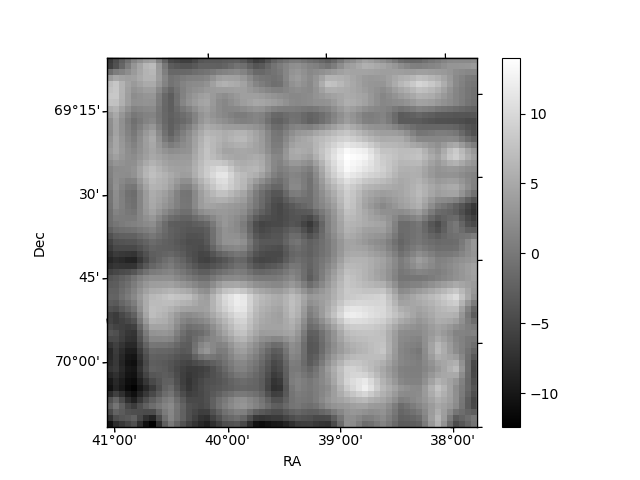
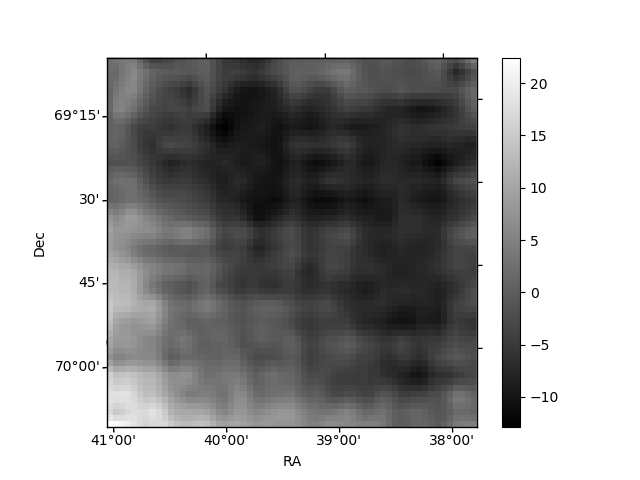
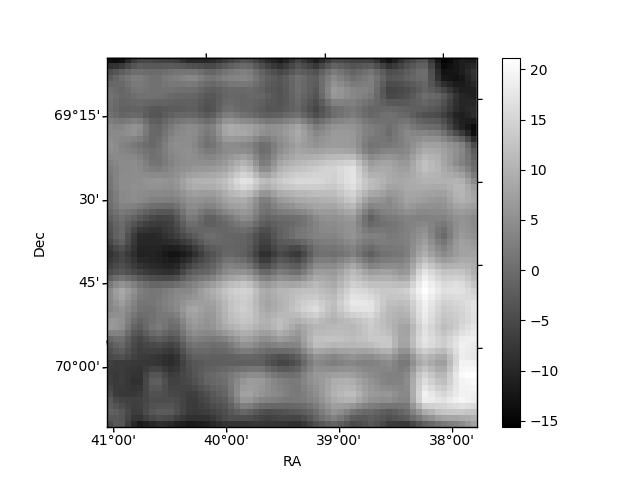
Histogram calculated using DETX and DETY for each event in the final _common_clean file
| Quadrant A | 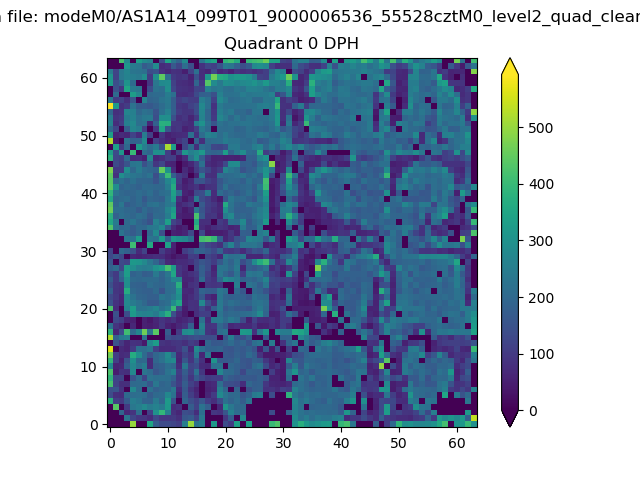 |
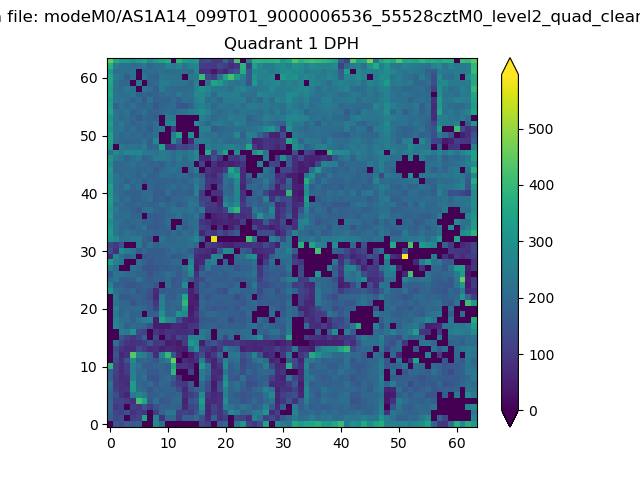 |
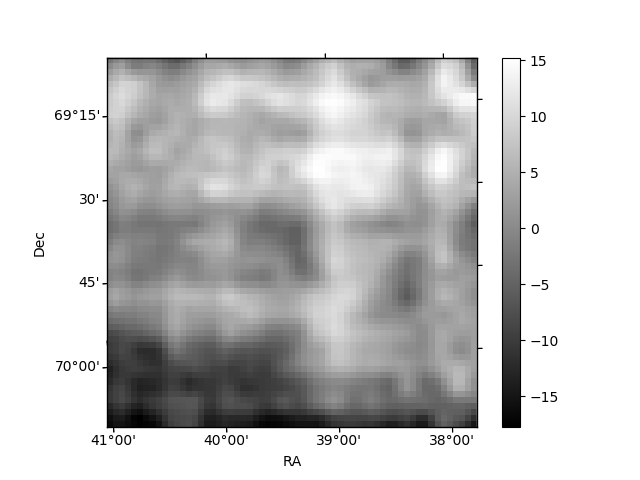
Quadrant B |
|---|---|---|---|
| Quadrant D | 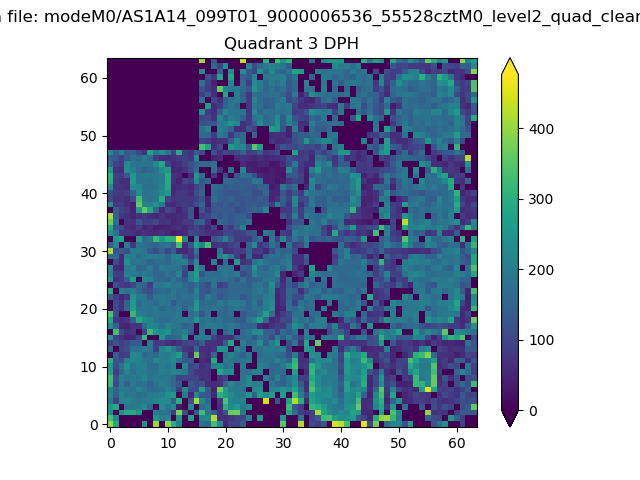 |
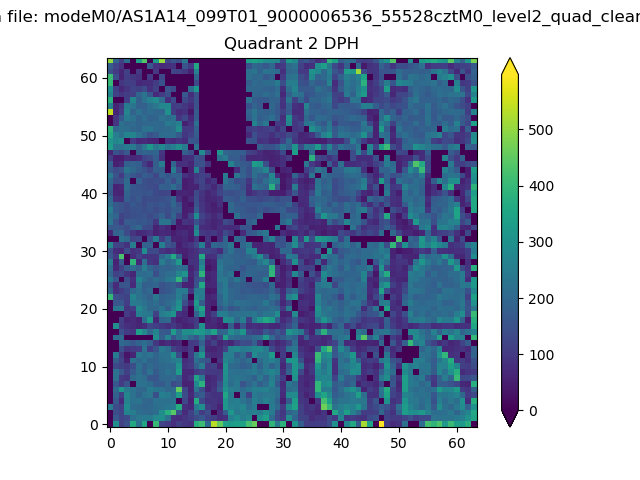 |
Quadrant C |
| Plot type | Count rate plots | Images |
|---|---|---|
| Comparison with Poisson distribution Blue bars denote a histogram of data divided into 1 sec bins. Red curve is a Poisson curve with rate = median count rate of data. |
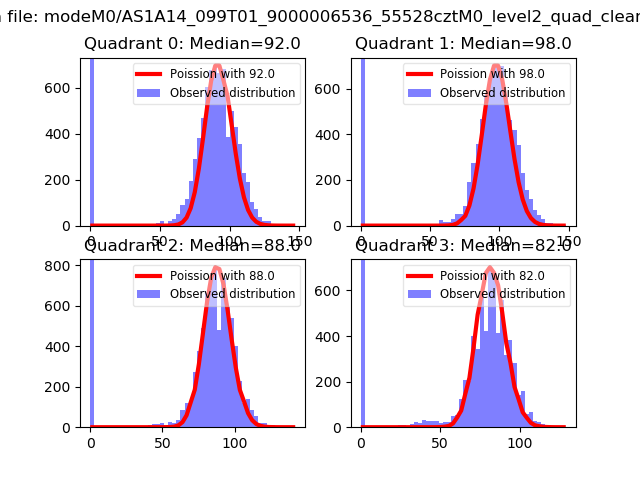 |
 |
| Quadrant-wise count rates Data is divided into 100 sec bins |
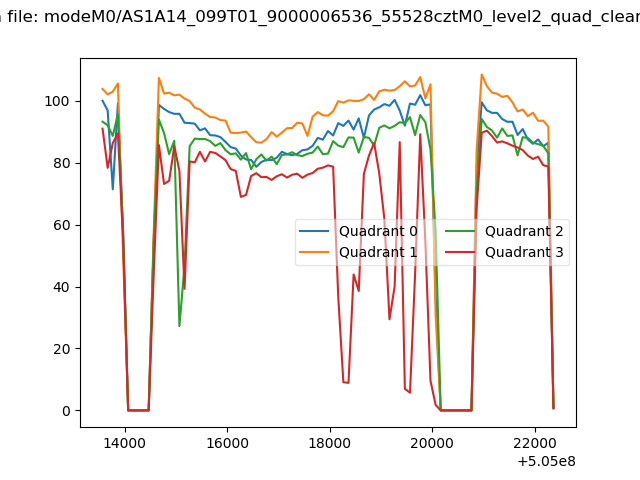 |
|
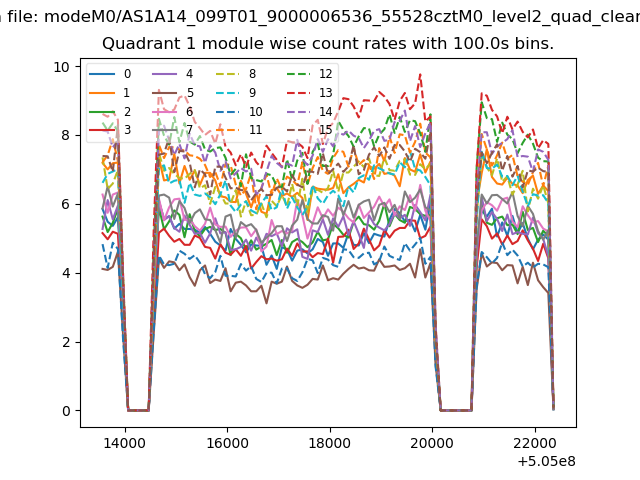
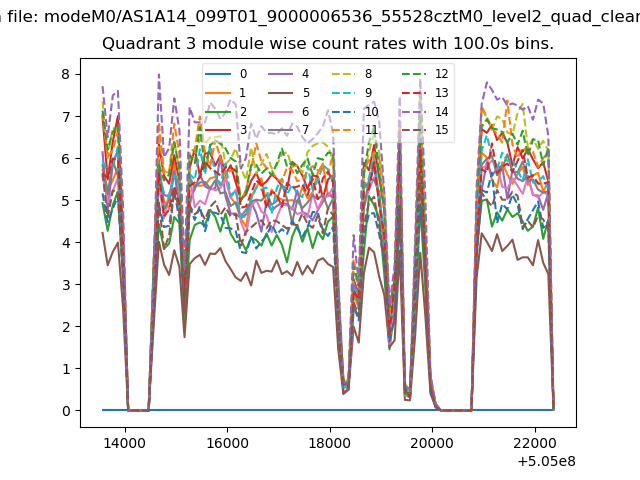
| Module-wise count rates for Quadrant A Data is divided into 100 sec bins |
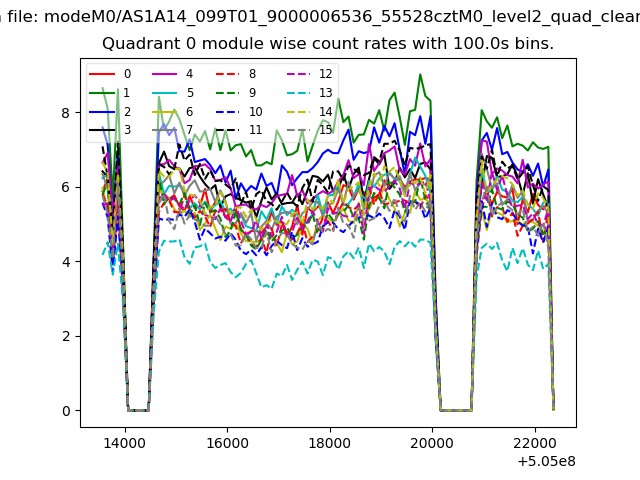 |
 |
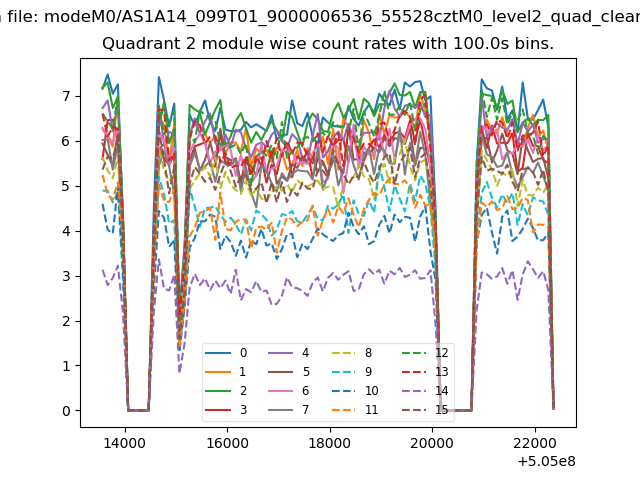
| Module-wise count rates for Quadrant B Data is divided into 100 sec bins |
 |
 |
| Module-wise count rates for Quadrant C Data is divided into 100 sec bins |
 |
 |
| Module-wise count rates for Quadrant D Data is divided into 100 sec bins |
 |
 |
| Parameter | Plot |
|---|---|
| CZT HV Monitor | 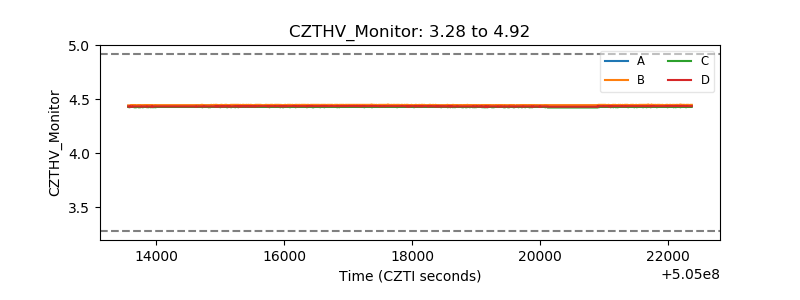 |
| D_VDD | 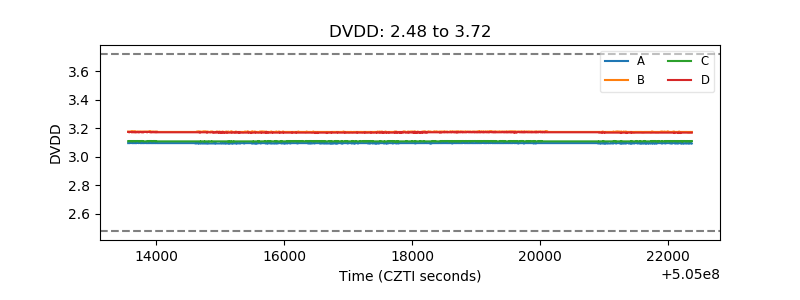 |
| Temperature 1 | 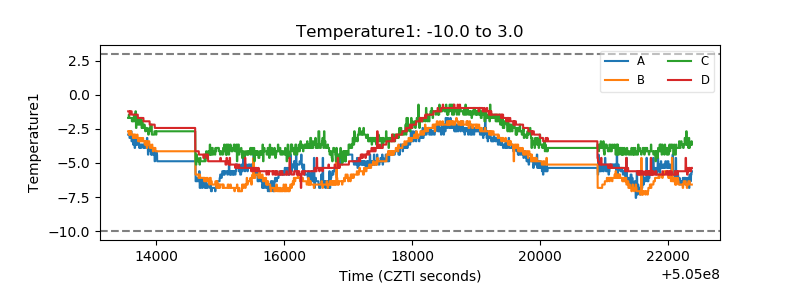 |
| Veto HV Monitor | 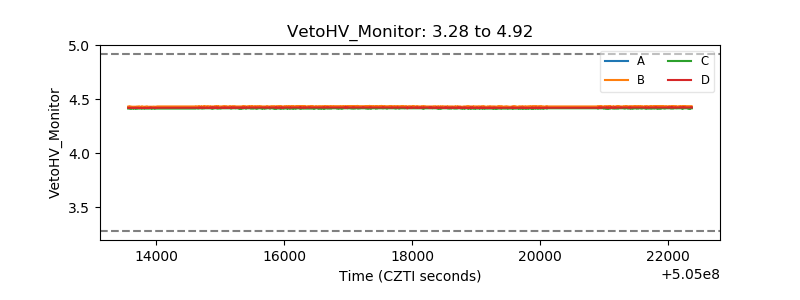 |
| Veto LLD | 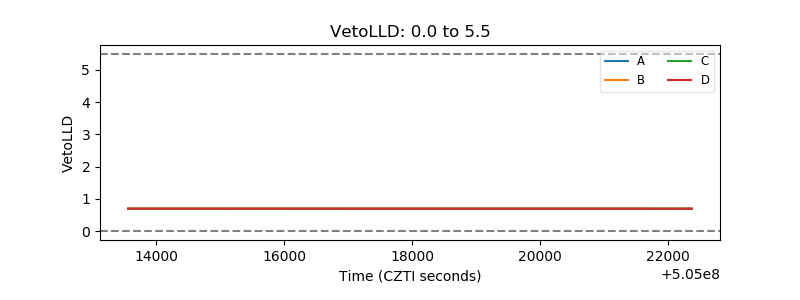 |
| Alpha Counter | 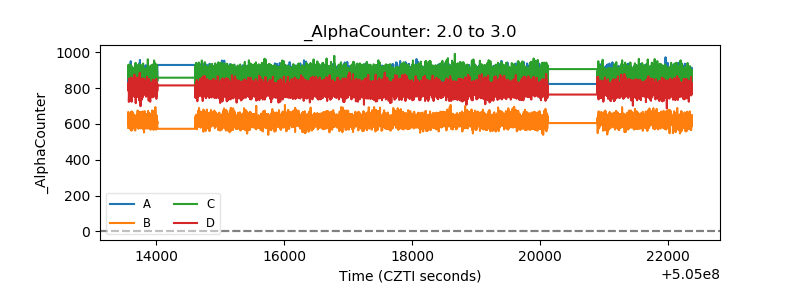 |
| _CPM_Rate | 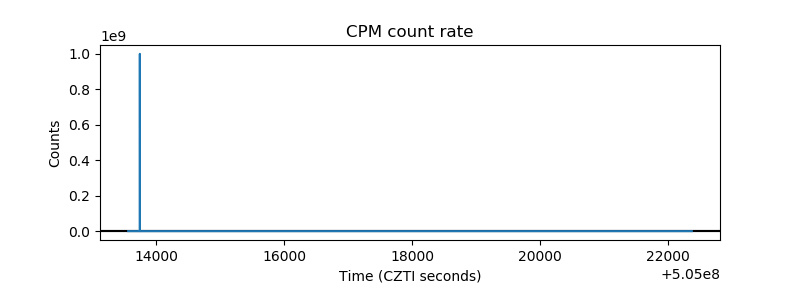 |
| CZT Counter | 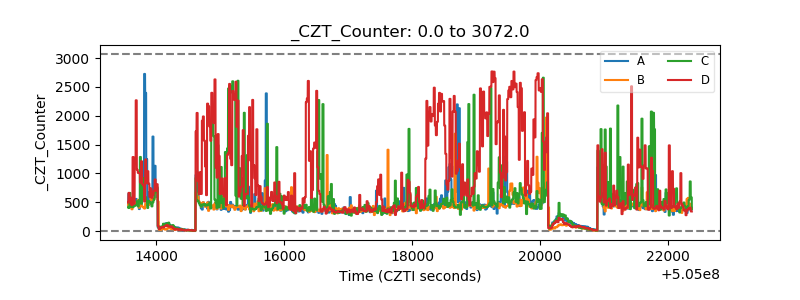 |
| +2.5 Volts monitor |  |
| +5 Volts monitor |  |
| _ROLL_ROT | 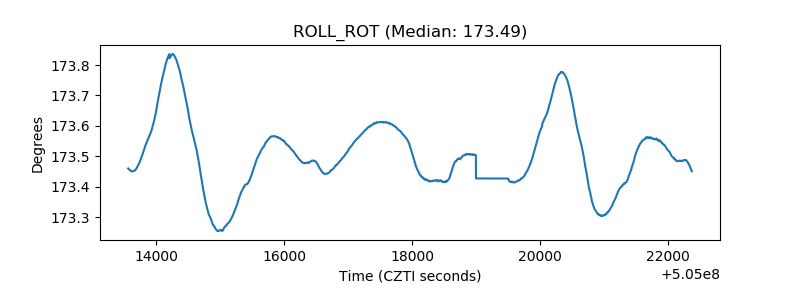 |
| _Roll_DEC | 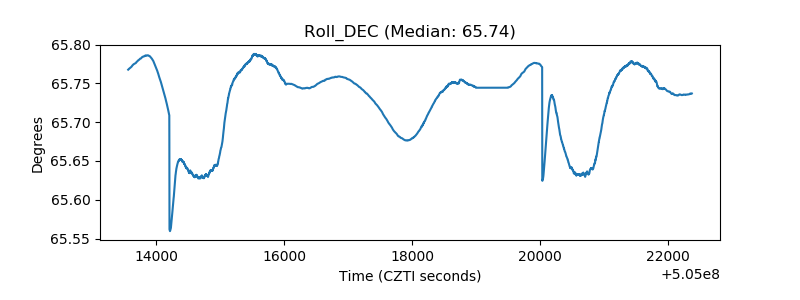 |
| _Roll_RA | 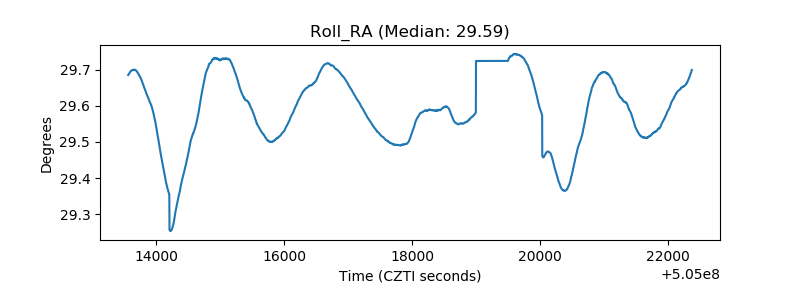 |
| Veto Counter | 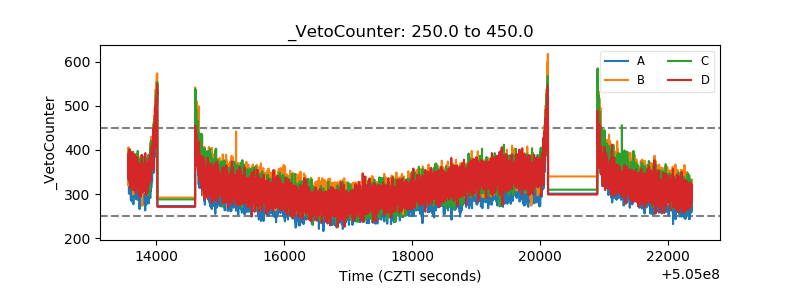 |