| Param | Original file | Final file |
|---|---|---|
| Filename | modeM0/AS1A14_099T01_9000006536_55529cztM0_level2.fits | modeM0/AS1A14_099T01_9000006536_55529cztM0_level2_quad_clean.evt |
| Size (bytes) | 502,873,920 | 104,607,360 |
| Size | 479.6 MB | 99.8 MB |
| Events in quadrant A | 3,668,730 | 688,270 |
| Events in quadrant B | 3,506,969 | 743,986 |
| Events in quadrant C | 4,138,921 | 660,789 |
| Events in quadrant D | 6,719,194 | 554,069 |
| Mode M9 | |||
|---|---|---|---|
| Quadrant | BADHDUFLAG | Total packets | Discarded packets |
| A | 0 | 17 | 0 |
| B | 0 | 17 | 0 |
| C | 0 | 17 | 0 |
| D | 0 | 17 | 0 |
| Mode SS | |||
|---|---|---|---|
| Quadrant | BADHDUFLAG | Total packets | Discarded packets |
| A | 0 | 154 | 0 |
| B | 0 | 154 | 0 |
| C | 0 | 154 | 0 |
| D | 0 | 154 | 0 |
| Mode M0 | |||
|---|---|---|---|
| Quadrant | BADHDUFLAG | Total packets | Discarded packets |
| A | 0 | 16485 | 2 |
| B | 0 | 16015 | 2 |
| C | 0 | 17674 | 2 |
| D | 0 | 25448 | 2 |
| Quadrant | Total seconds | Saturated seconds | Saturation percentage |
|---|---|---|---|
| A | 7475 | 110 | 1.471572% |
| B | 7476 | 93 | 1.243981% |
| C | 7476 | 93 | 1.243981% |
| D | 7476 | 1007 | 13.469770% |
Noise dominated data is calculated using 1-second bins in cleaned event files. If a bin has >2000 counts, and if more than 50% of those come from <1% of pixels, then it is considered to be noise-dominated and hence unusable.
| Quadrant | # 1 sec bins | Bins with >0 counts | Bins with >2000 counts | High rate bins dominated by noise | Noise dominated (total time) | Noise dominated (detector-on time) | Marked lightcurve |
|---|---|---|---|---|---|---|---|
| A | 9185 | 7477 | 60 | 60 | 0.65% | 0.80% | 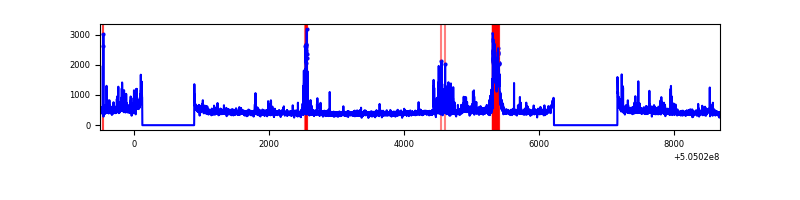 |
| B | 9186 | 7478 | 21 | 21 | 0.23% | 0.28% | 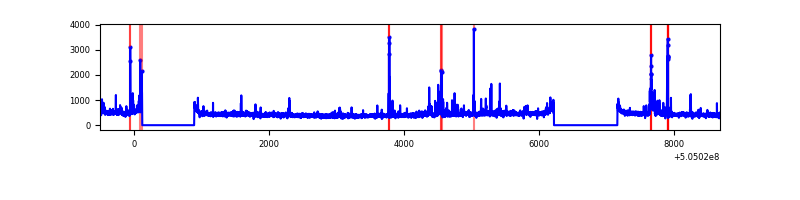 |
| C | 9186 | 7478 | 67 | 67 | 0.73% | 0.90% | 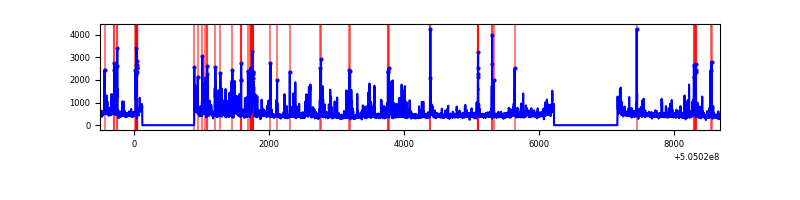 |
| D | 9186 | 7478 | 864 | 864 | 9.41% | 11.55% | 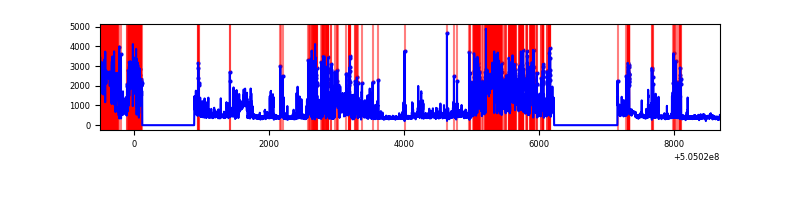 |
Top three noisy pixels from each quadrant. If the there are fewer than three noisy pixels in the level2.evt file, extra rows are filled as -1
| Pixel properties | Quadrant properties | ||||||
|---|---|---|---|---|---|---|---|
| Quadrant | DetID | PixID | Counts | Sigma | Mean | Median | Sigma |
| A | 4 | 205 | 401271 | 2043.55 | 786 | 765 | 196.0 |
| A | 4 | 159 | 48148 | 241.77 | 786 | 765 | 196.0 |
| A | 0 | 8 | 46521 | 233.47 | 786 | 765 | 196.0 |
| B | 10 | 245 | 93742 | 556.72 | 779 | 751 | 167.0 |
| B | 4 | 169 | 65855 | 389.76 | 779 | 751 | 167.0 |
| B | 0 | 171 | 51894 | 306.18 | 779 | 751 | 167.0 |
| C | 9 | 38 | 583988 | 2777.55 | 765 | 757 | 210.0 |
| C | 13 | 3 | 188984 | 896.4 | 765 | 757 | 210.0 |
| C | 15 | 178 | 179900 | 853.14 | 765 | 757 | 210.0 |
| D | 11 | 129 | 1051083 | 5218.92 | 708 | 678 | 201.3 |
| D | 7 | 70 | 697687 | 3463.07 | 708 | 678 | 201.3 |
| D | 8 | 160 | 530172 | 2630.78 | 708 | 678 | 201.3 |
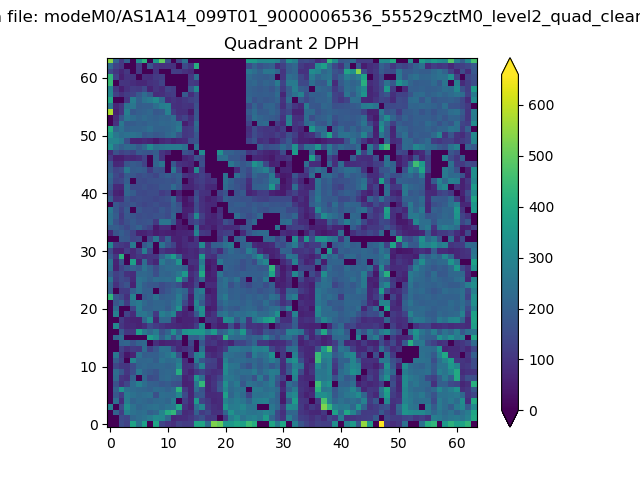
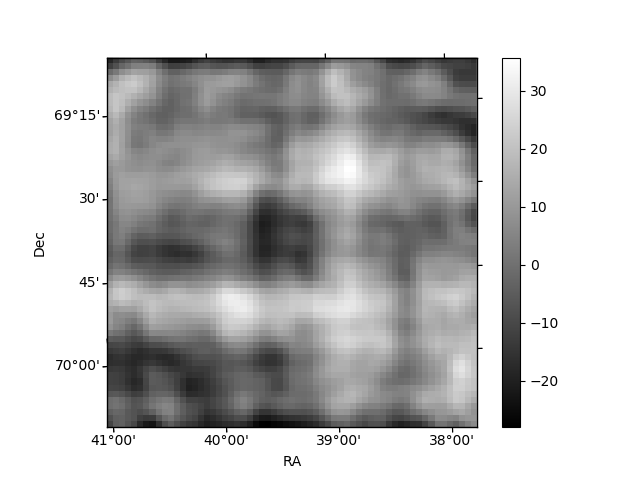
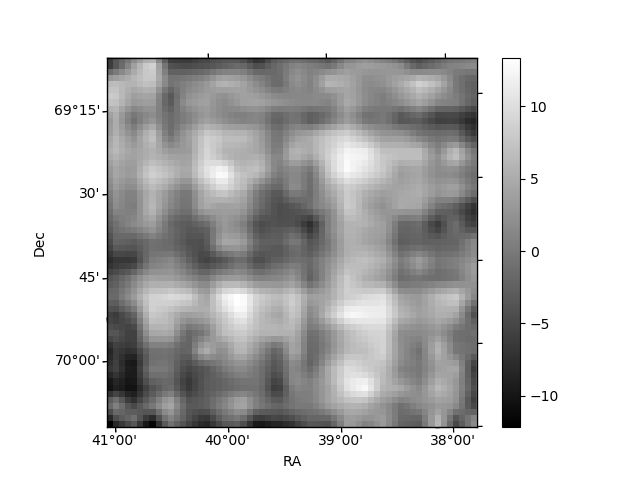
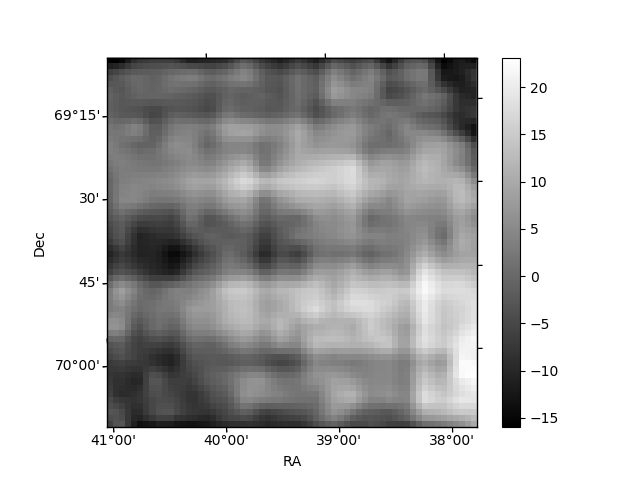
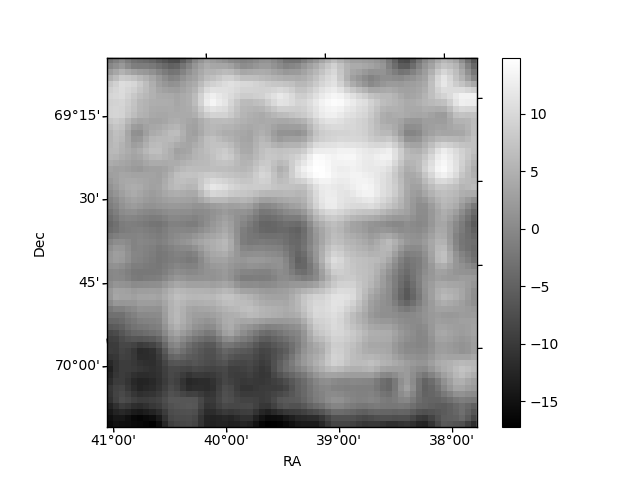
Histogram calculated using DETX and DETY for each event in the final _common_clean file
| Quadrant A | 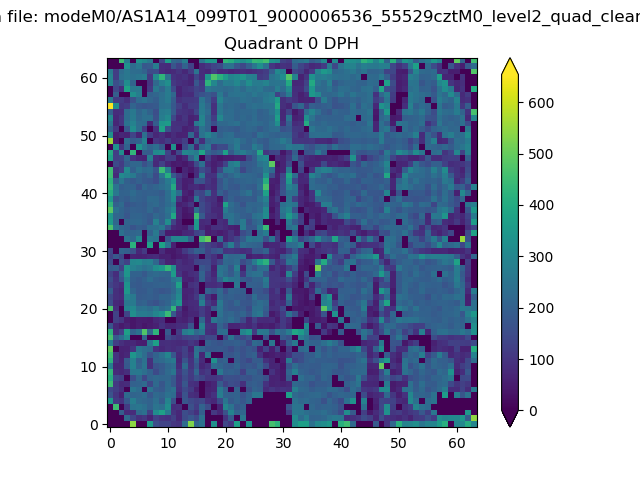 |
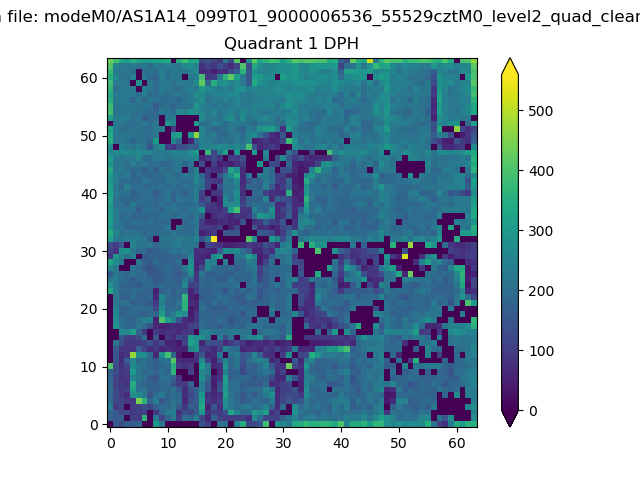 |
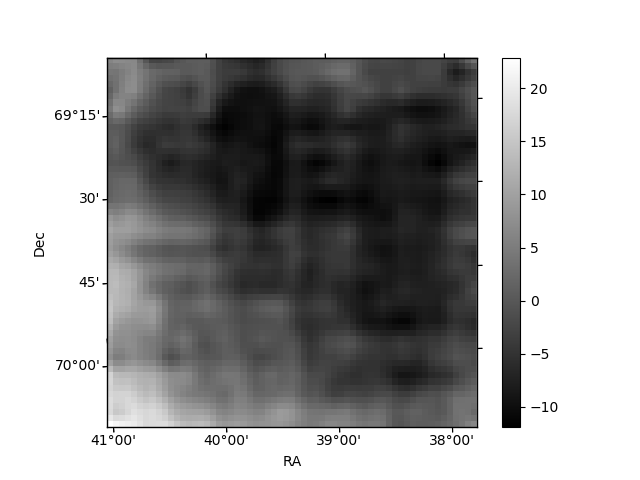
Quadrant B |
|---|---|---|---|
| Quadrant D | 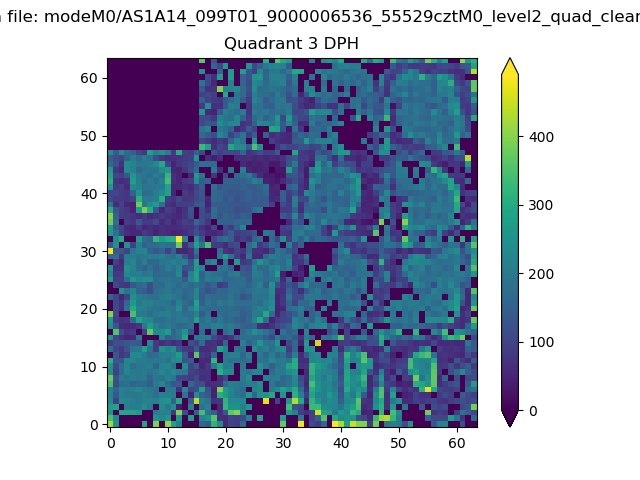 |
 |
Quadrant C |
| Plot type | Count rate plots | Images |
|---|---|---|
| Comparison with Poisson distribution Blue bars denote a histogram of data divided into 1 sec bins. Red curve is a Poisson curve with rate = median count rate of data. |
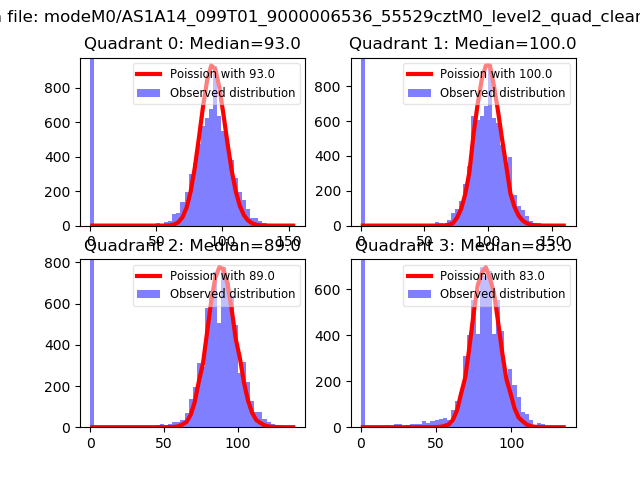 |
 |
| Quadrant-wise count rates Data is divided into 100 sec bins |
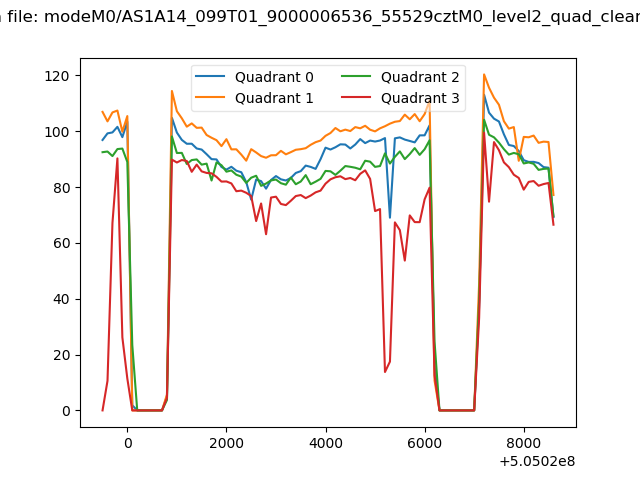 |
|
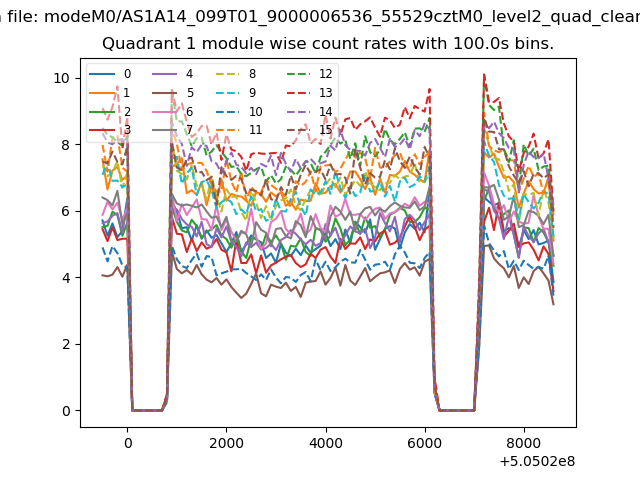
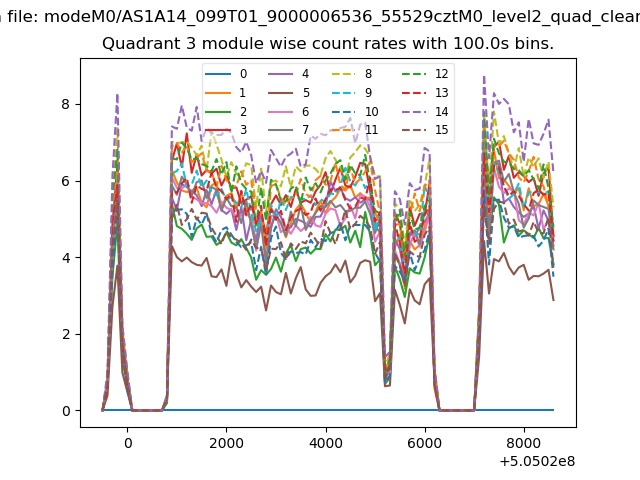
| Module-wise count rates for Quadrant A Data is divided into 100 sec bins |
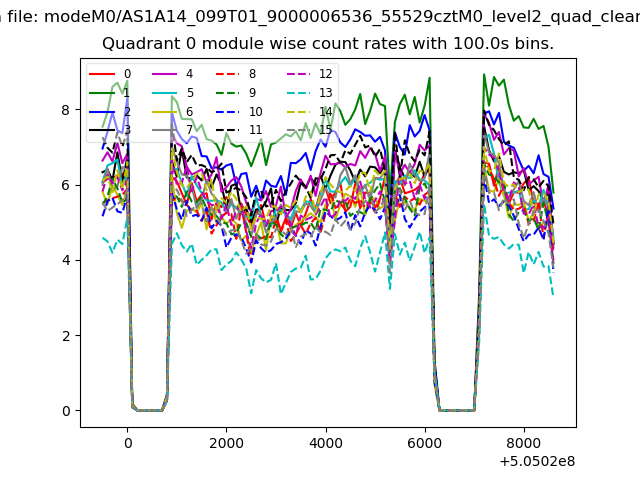 |
 |
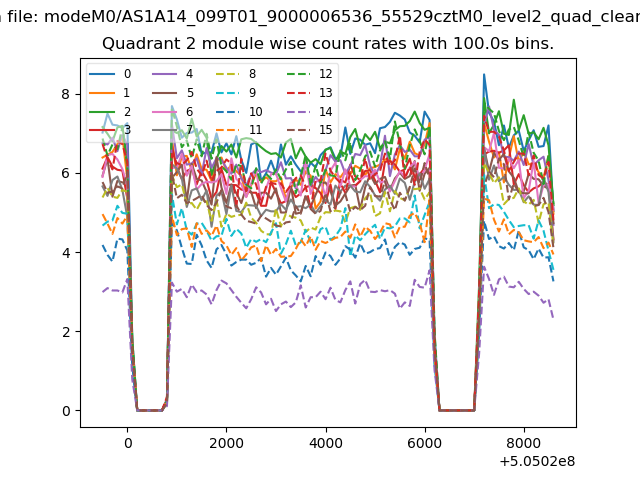
| Module-wise count rates for Quadrant B Data is divided into 100 sec bins |
 |
 |
| Module-wise count rates for Quadrant C Data is divided into 100 sec bins |
 |
 |
| Module-wise count rates for Quadrant D Data is divided into 100 sec bins |
 |
 |
| Parameter | Plot |
|---|---|
| CZT HV Monitor | 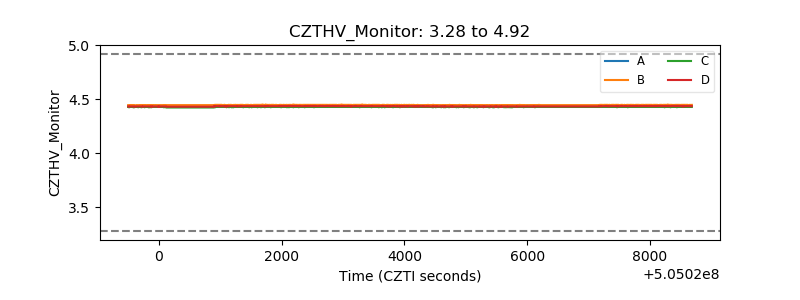 |
| D_VDD | 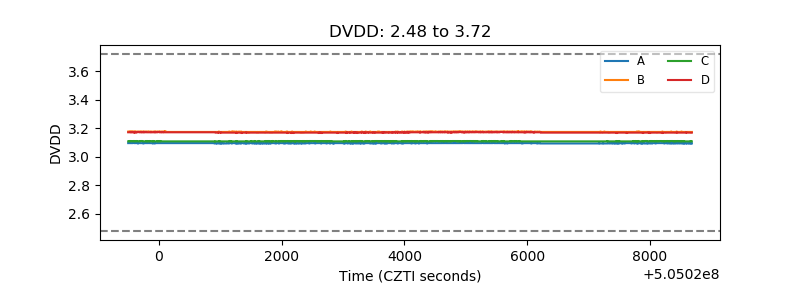 |
| Temperature 1 | 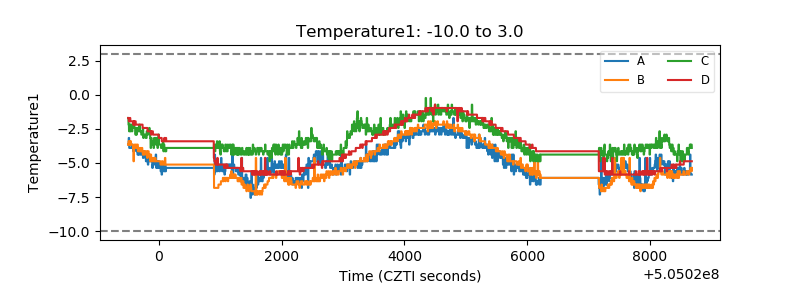 |
| Veto HV Monitor | 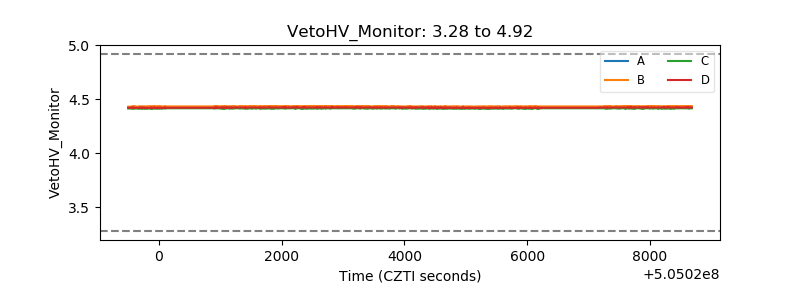 |
| Veto LLD | 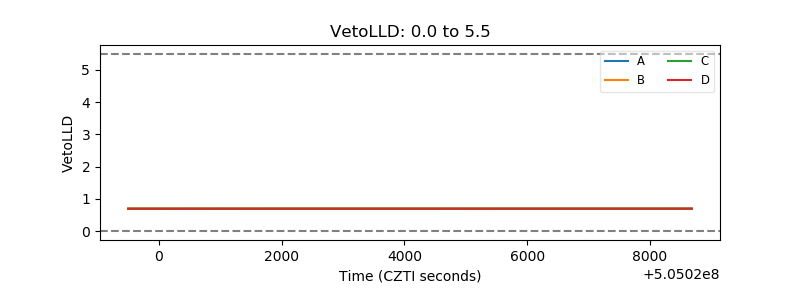 |
| Alpha Counter | 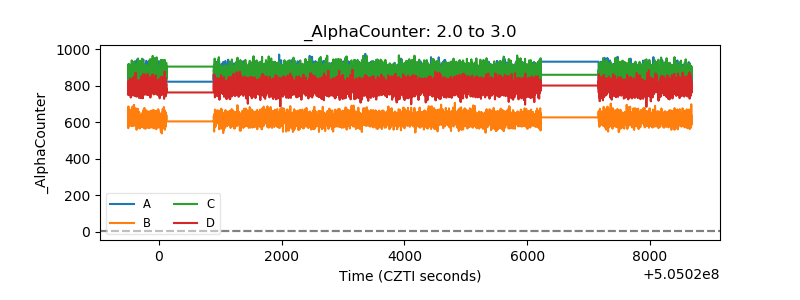 |
| _CPM_Rate | 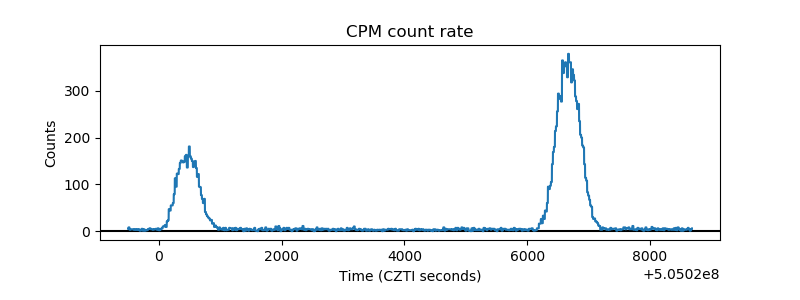 |
| CZT Counter | 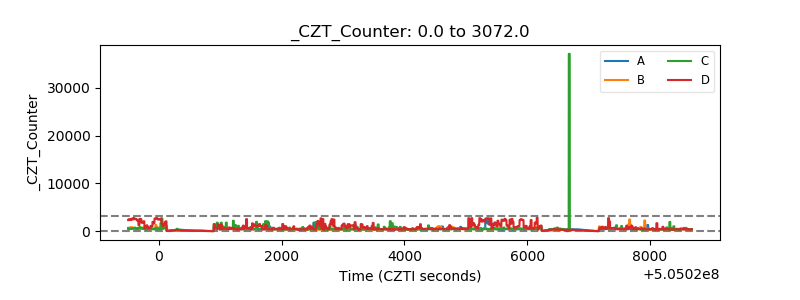 |
| +2.5 Volts monitor |  |
| +5 Volts monitor | 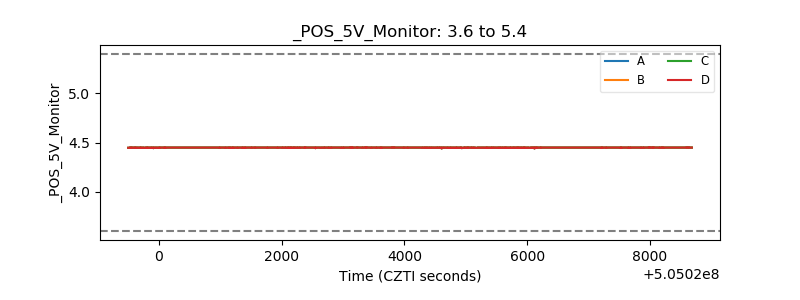 |
| _ROLL_ROT | 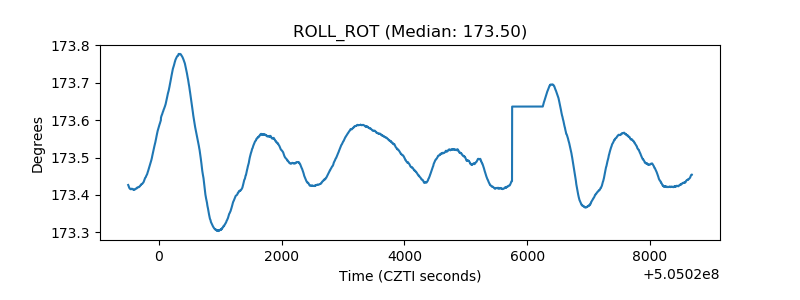 |
| _Roll_DEC | 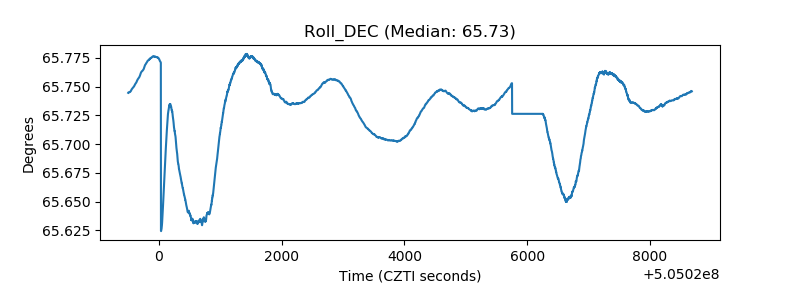 |
| _Roll_RA | 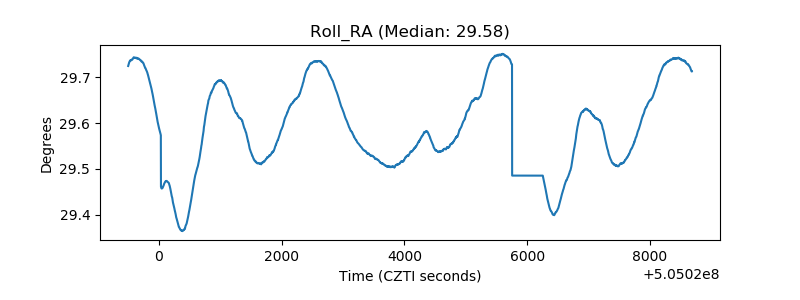 |
| Veto Counter | 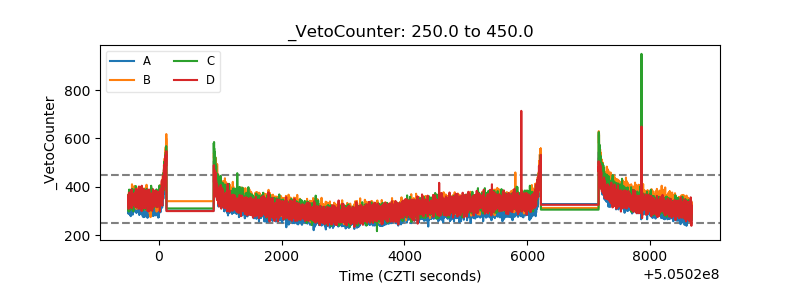 |