| Param | Original file | Final file |
|---|---|---|
| Filename | modeM0/AS1A14_099T01_9000006536_55531cztM0_level2.fits | modeM0/AS1A14_099T01_9000006536_55531cztM0_level2_quad_clean.evt |
| Size (bytes) | 368,112,960 | 94,953,600 |
| Size | 351.1 MB | 90.6 MB |
| Events in quadrant A | 3,198,247 | 620,306 |
| Events in quadrant B | 3,279,461 | 654,386 |
| Events in quadrant C | 3,221,789 | 593,088 |
| Events in quadrant D | 3,417,486 | 551,533 |
| Mode M9 | |||
|---|---|---|---|
| Quadrant | BADHDUFLAG | Total packets | Discarded packets |
| A | 0 | 19 | 0 |
| B | 0 | 20 | 0 |
| C | 0 | 20 | 0 |
| D | 0 | 20 | 0 |
| Mode SS | |||
|---|---|---|---|
| Quadrant | BADHDUFLAG | Total packets | Discarded packets |
| A | 0 | 134 | 0 |
| B | 0 | 134 | 0 |
| C | 0 | 134 | 0 |
| D | 0 | 134 | 0 |
| Mode M0 | |||
|---|---|---|---|
| Quadrant | BADHDUFLAG | Total packets | Discarded packets |
| A | 0 | 14333 | 2 |
| B | 0 | 14637 | 2 |
| C | 0 | 14466 | 2 |
| D | 0 | 15059 | 2 |
| Quadrant | Total seconds | Saturated seconds | Saturation percentage |
|---|---|---|---|
| A | 6539 | 78 | 1.192843% |
| B | 6539 | 211 | 3.226793% |
| C | 6539 | 54 | 0.825814% |
| D | 6539 | 144 | 2.202172% |
Noise dominated data is calculated using 1-second bins in cleaned event files. If a bin has >2000 counts, and if more than 50% of those come from <1% of pixels, then it is considered to be noise-dominated and hence unusable.
| Quadrant | # 1 sec bins | Bins with >0 counts | Bins with >2000 counts | High rate bins dominated by noise | Noise dominated (total time) | Noise dominated (detector-on time) | Marked lightcurve |
|---|---|---|---|---|---|---|---|
| A | 7589 | 6540 | 29 | 29 | 0.38% | 0.44% | 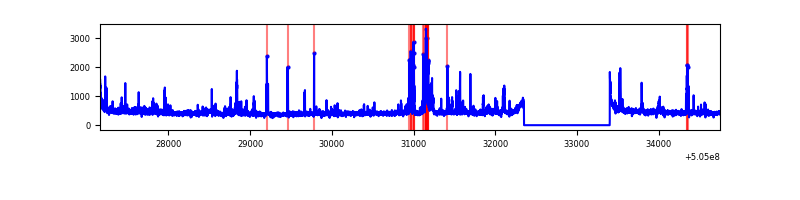 |
| B | 7589 | 6540 | 128 | 128 | 1.69% | 1.96% | 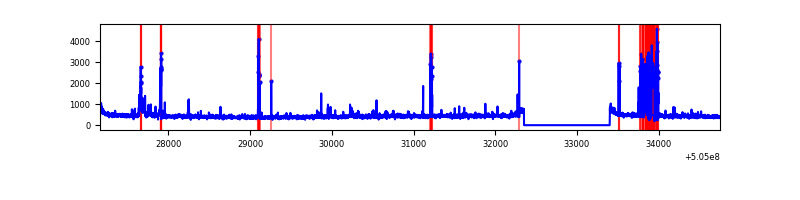 |
| C | 7589 | 6540 | 31 | 31 | 0.41% | 0.47% | 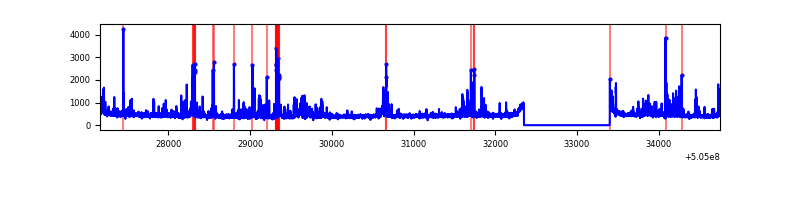 |
| D | 7589 | 6540 | 89 | 89 | 1.17% | 1.36% | 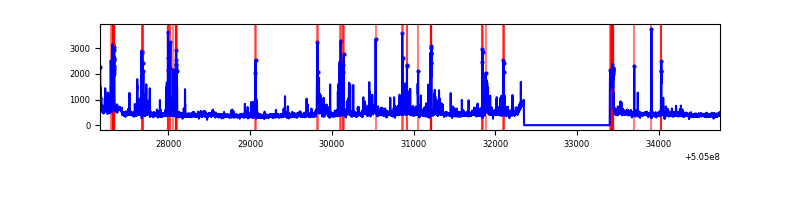 |
Top three noisy pixels from each quadrant. If the there are fewer than three noisy pixels in the level2.evt file, extra rows are filled as -1
| Pixel properties | Quadrant properties | ||||||
|---|---|---|---|---|---|---|---|
| Quadrant | DetID | PixID | Counts | Sigma | Mean | Median | Sigma |
| A | 4 | 205 | 349259 | 2042.32 | 694 | 676 | 170.7 |
| A | 0 | 8 | 31537 | 180.81 | 694 | 676 | 170.7 |
| A | 11 | 31 | 24268 | 138.22 | 694 | 676 | 170.7 |
| B | 5 | 236 | 298568 | 2037.03 | 679 | 654 | 146.2 |
| B | 10 | 245 | 135266 | 920.43 | 679 | 654 | 146.2 |
| B | 0 | 199 | 44825 | 302.03 | 679 | 654 | 146.2 |
| C | 15 | 178 | 319131 | 1750.46 | 669 | 660 | 181.9 |
| C | 9 | 38 | 135780 | 742.68 | 669 | 660 | 181.9 |
| C | 13 | 3 | 67290 | 366.23 | 669 | 660 | 181.9 |
| D | 11 | 129 | 186314 | 985.22 | 665 | 637 | 188.5 |
| D | 2 | 153 | 123160 | 650.12 | 665 | 637 | 188.5 |
| D | 7 | 70 | 111603 | 588.8 | 665 | 637 | 188.5 |
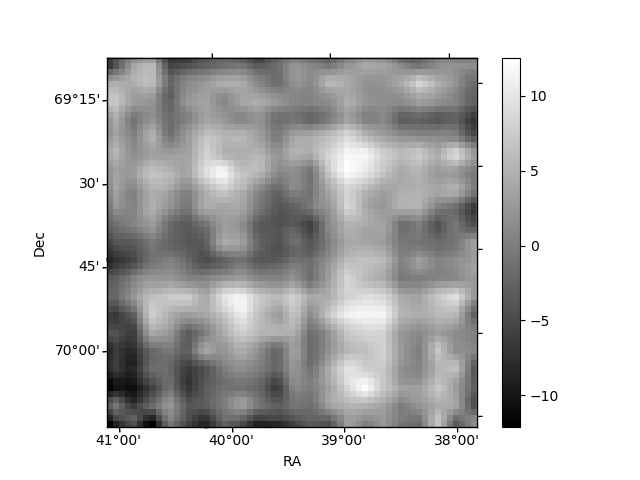
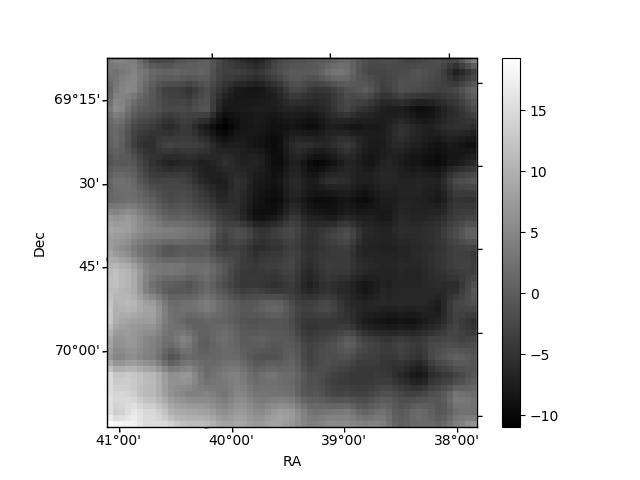
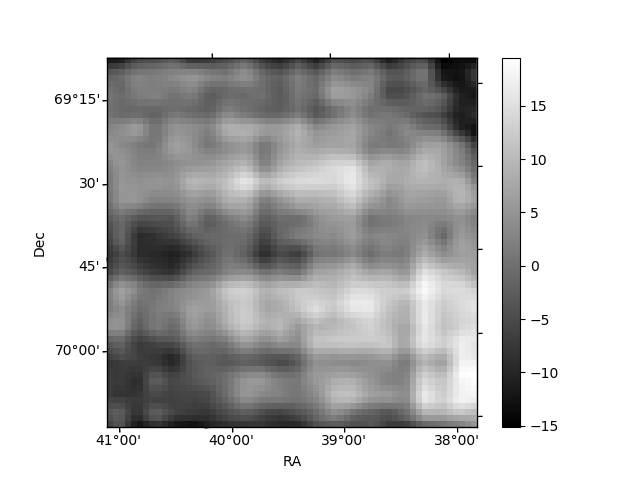
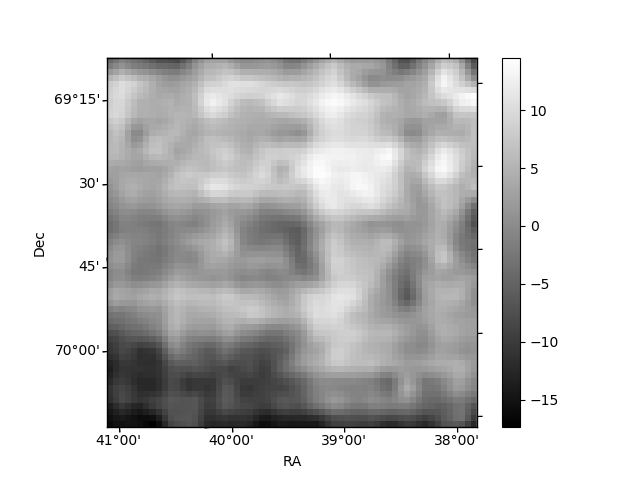
Histogram calculated using DETX and DETY for each event in the final _common_clean file
| Quadrant A | 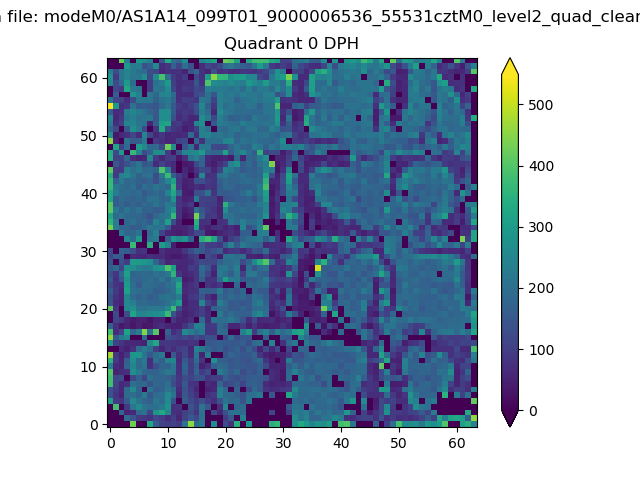 |
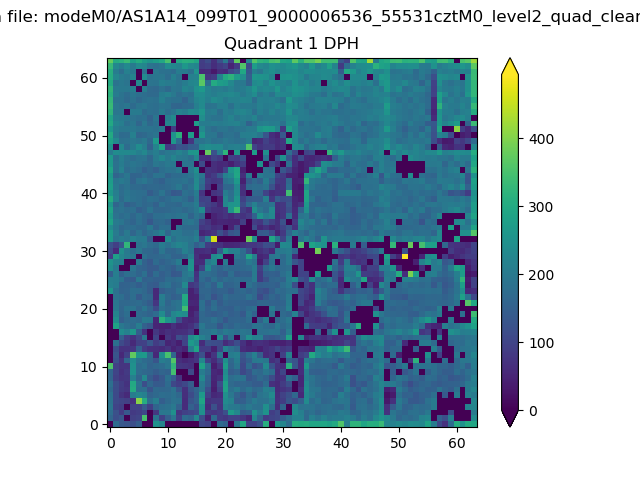 |
Quadrant B |
|---|---|---|---|
| Quadrant D | 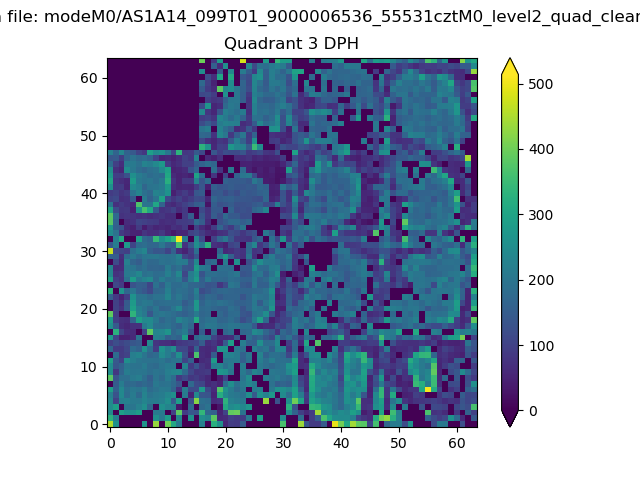 |
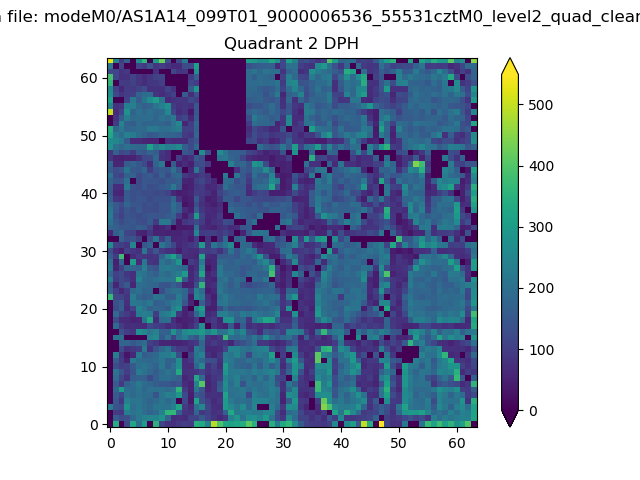 |
Quadrant C |
| Plot type | Count rate plots | Images |
|---|---|---|
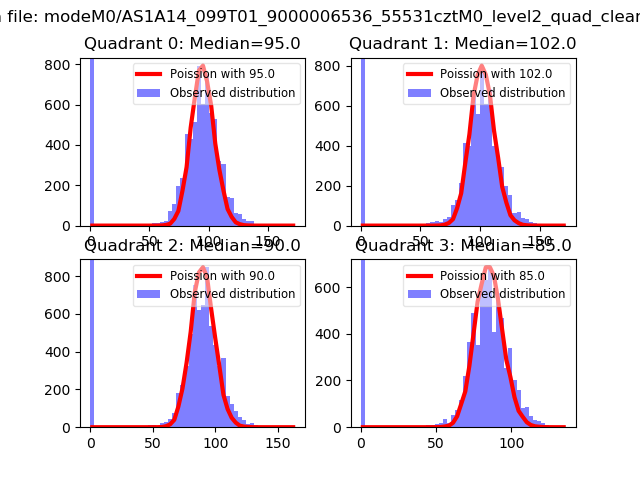
| Comparison with Poisson distribution Blue bars denote a histogram of data divided into 1 sec bins. Red curve is a Poisson curve with rate = median count rate of data. |
 |
 |
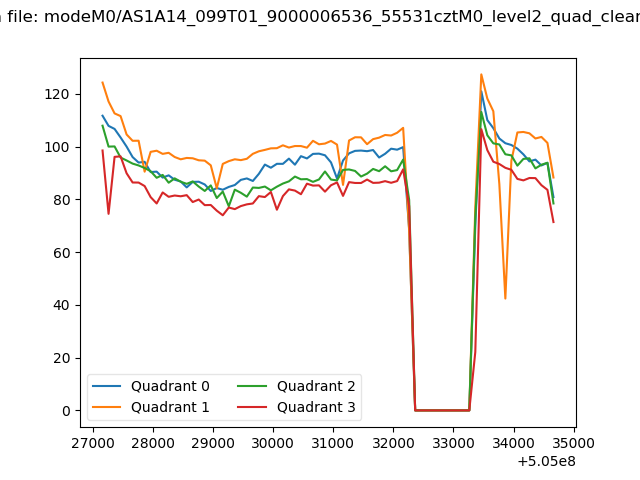
| Quadrant-wise count rates Data is divided into 100 sec bins |
 |
|
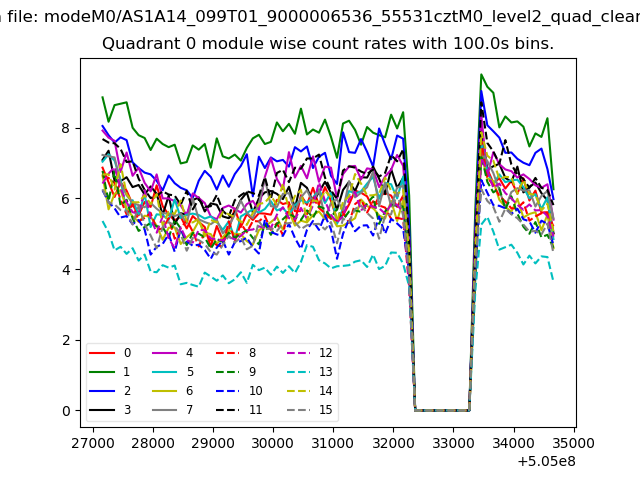
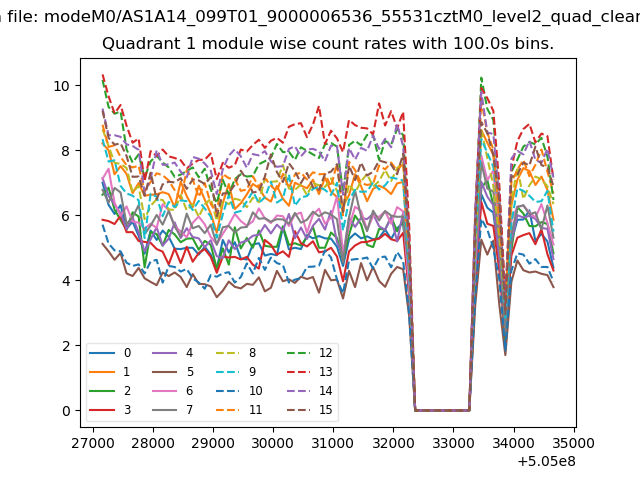
| Module-wise count rates for Quadrant A Data is divided into 100 sec bins |
 |
 |
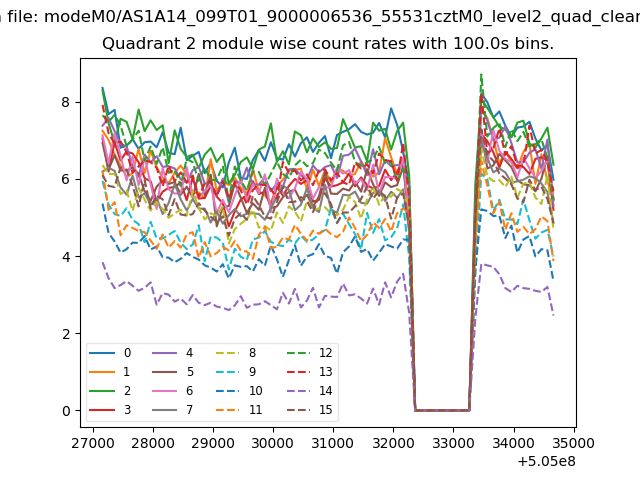
| Module-wise count rates for Quadrant B Data is divided into 100 sec bins |
 |
 |
| Module-wise count rates for Quadrant C Data is divided into 100 sec bins |
 |
 |
| Module-wise count rates for Quadrant D Data is divided into 100 sec bins |
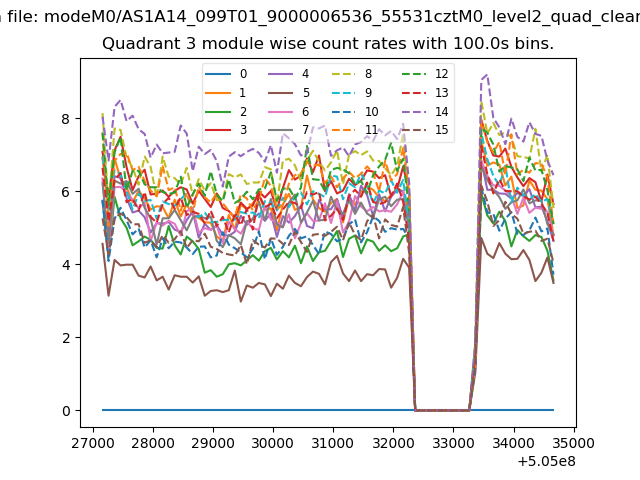 |
 |
| Parameter | Plot |
|---|---|
| CZT HV Monitor | 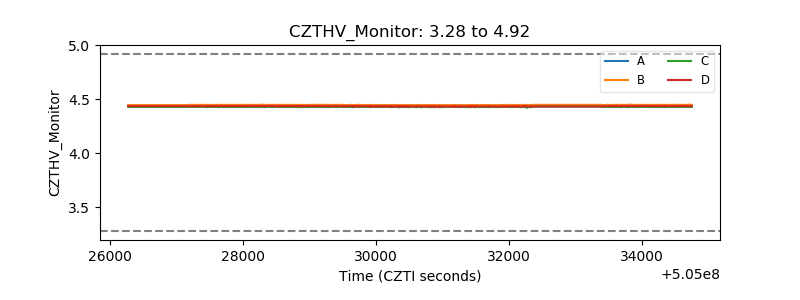 |
| D_VDD | 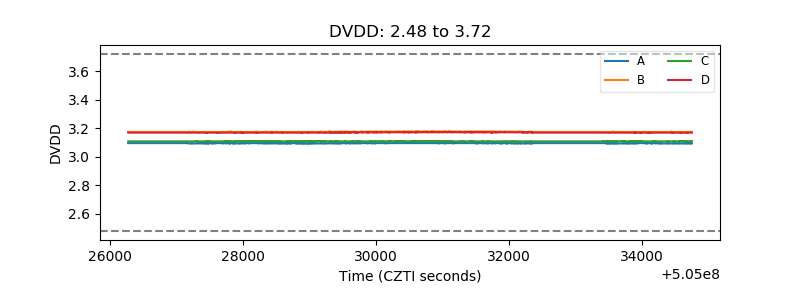 |
| Temperature 1 | 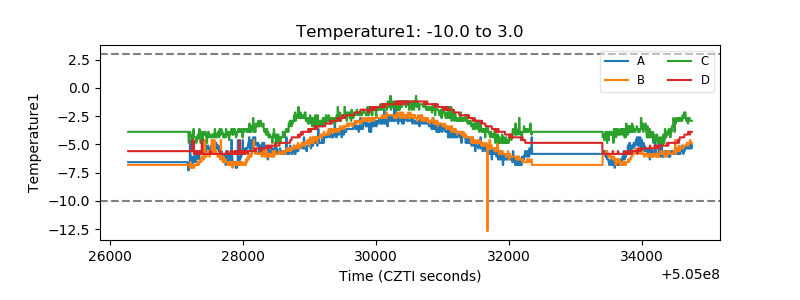 |
| Veto HV Monitor | 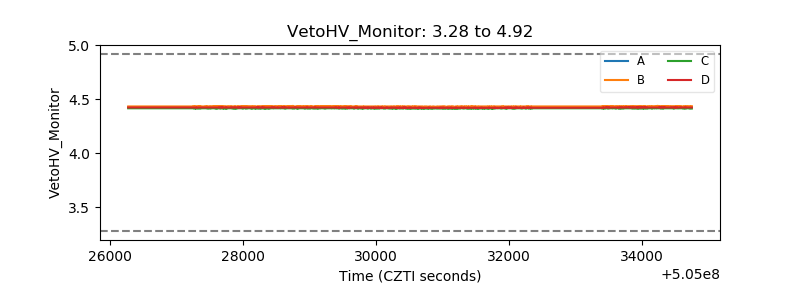 |
| Veto LLD | 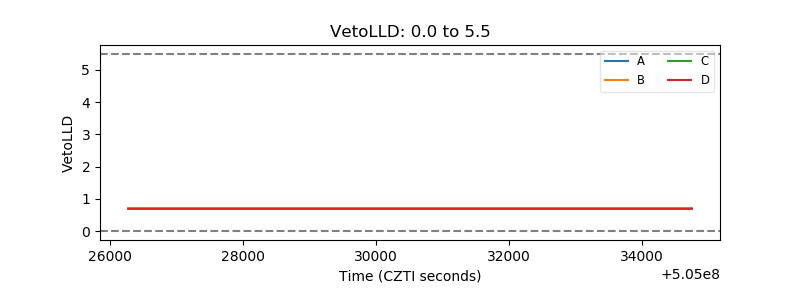 |
| Alpha Counter | 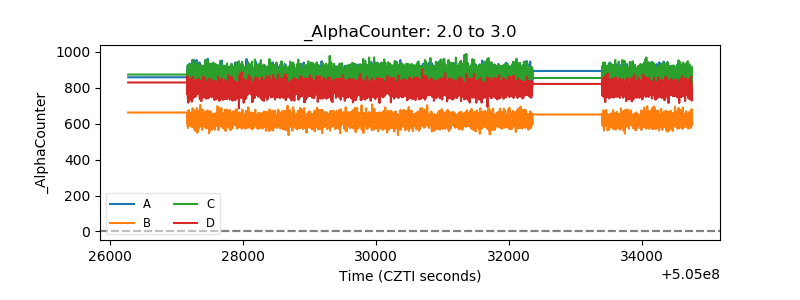 |
| _CPM_Rate | 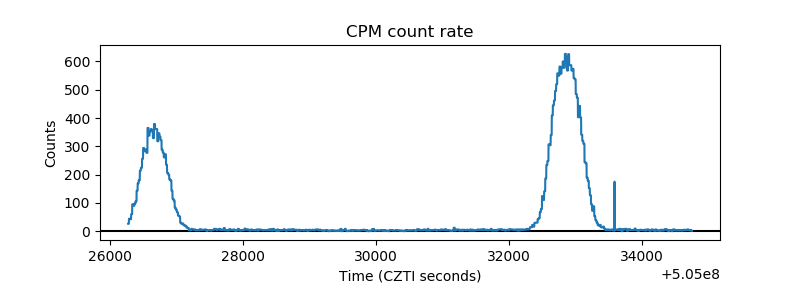 |
| CZT Counter | 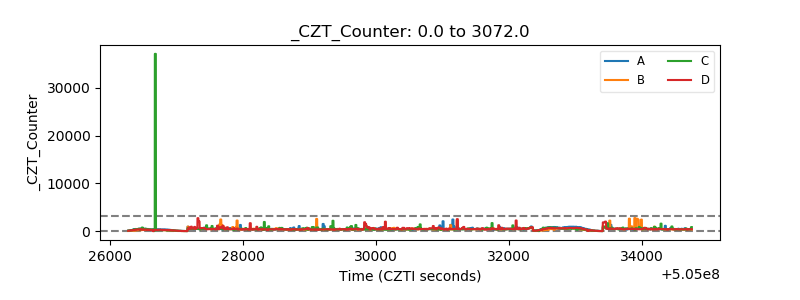 |
| +2.5 Volts monitor |  |
| +5 Volts monitor |  |
| _ROLL_ROT | 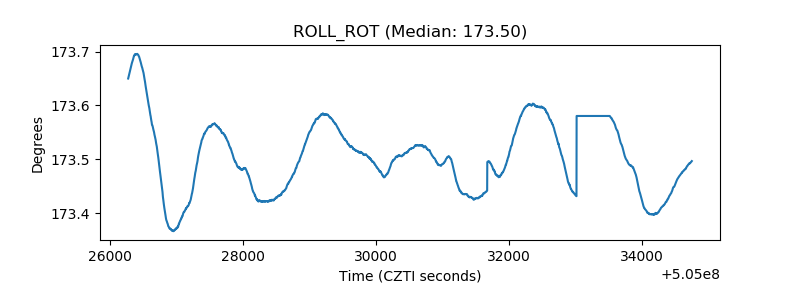 |
| _Roll_DEC | 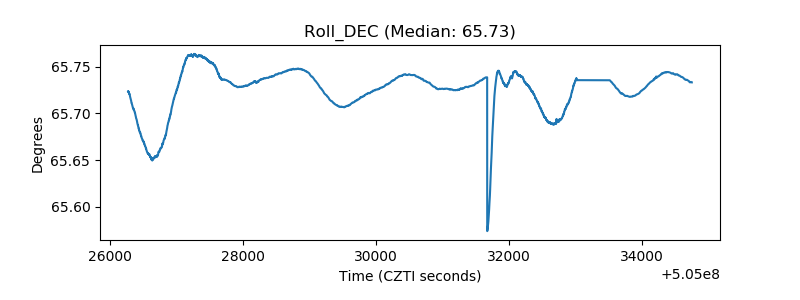 |
| _Roll_RA | 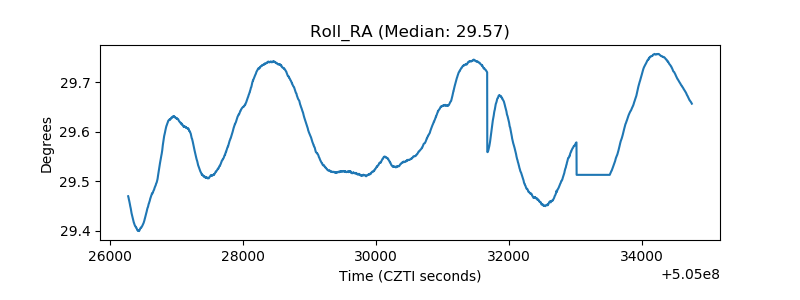 |
| Veto Counter | 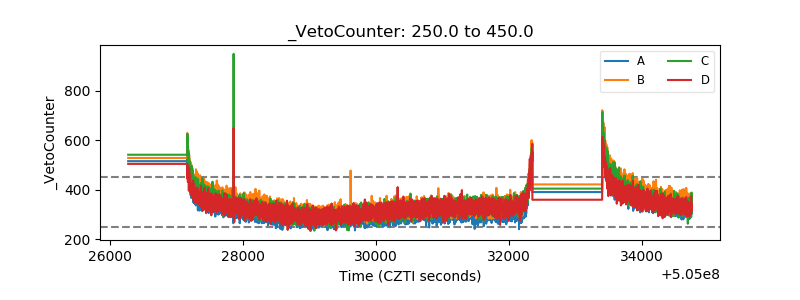 |