| Param | Original file | Final file |
|---|---|---|
| Filename | modeM0/AS1A14_099T01_9000006536_55532cztM0_level2.fits | modeM0/AS1A14_099T01_9000006536_55532cztM0_level2_quad_clean.evt |
| Size (bytes) | 365,866,560 | 91,673,280 |
| Size | 348.9 MB | 87.4 MB |
| Events in quadrant A | 3,018,586 | 605,461 |
| Events in quadrant B | 2,998,600 | 638,387 |
| Events in quadrant C | 3,074,452 | 574,005 |
| Events in quadrant D | 3,965,773 | 522,850 |
| Mode M9 | |||
|---|---|---|---|
| Quadrant | BADHDUFLAG | Total packets | Discarded packets |
| A | 0 | 11 | 0 |
| B | 0 | 11 | 0 |
| C | 0 | 11 | 0 |
| D | 0 | 11 | 0 |
| Mode SS | |||
|---|---|---|---|
| Quadrant | BADHDUFLAG | Total packets | Discarded packets |
| A | 0 | 130 | 2 |
| B | 0 | 130 | 4 |
| C | 0 | 130 | 2 |
| D | 0 | 130 | 2 |
| Mode M0 | |||
|---|---|---|---|
| Quadrant | BADHDUFLAG | Total packets | Discarded packets |
| A | 0 | 13833 | 291 |
| B | 0 | 14005 | 412 |
| C | 0 | 14089 | 313 |
| D | 0 | 16560 | 300 |
| Quadrant | Total seconds | Saturated seconds | Saturation percentage |
|---|---|---|---|
| A | 6242 | 77 | 1.233579% |
| B | 6222 | 189 | 3.037608% |
| C | 6229 | 56 | 0.899021% |
| D | 6238 | 317 | 5.081757% |
Noise dominated data is calculated using 1-second bins in cleaned event files. If a bin has >2000 counts, and if more than 50% of those come from <1% of pixels, then it is considered to be noise-dominated and hence unusable.
| Quadrant | # 1 sec bins | Bins with >0 counts | Bins with >2000 counts | High rate bins dominated by noise | Noise dominated (total time) | Noise dominated (detector-on time) | Marked lightcurve |
|---|---|---|---|---|---|---|---|
| A | 7450 | 6298 | 7 | 7 | 0.09% | 0.11% | 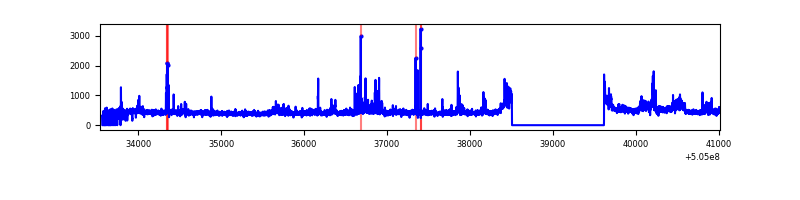 |
| B | 7452 | 6291 | 99 | 99 | 1.33% | 1.57% | 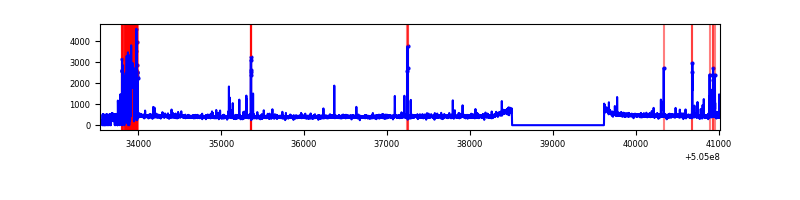 |
| C | 7475 | 6287 | 13 | 13 | 0.17% | 0.21% | 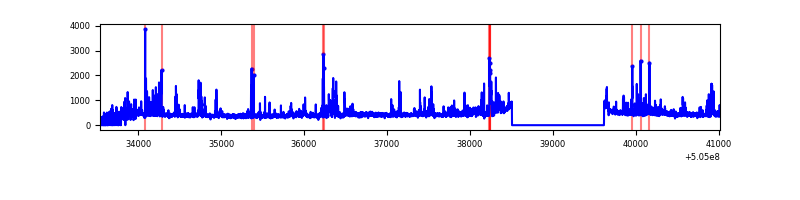 |
| D | 7455 | 6297 | 277 | 277 | 3.72% | 4.40% | 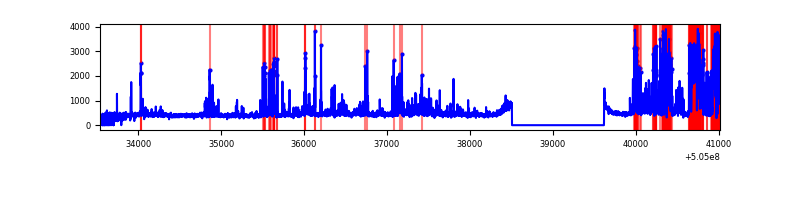 |
Top three noisy pixels from each quadrant. If the there are fewer than three noisy pixels in the level2.evt file, extra rows are filled as -1
| Pixel properties | Quadrant properties | ||||||
|---|---|---|---|---|---|---|---|
| Quadrant | DetID | PixID | Counts | Sigma | Mean | Median | Sigma |
| A | 3 | 14 | 183549 | 1097.06 | 673 | 656 | 166.7 |
| A | 4 | 205 | 144701 | 864.04 | 673 | 656 | 166.7 |
| A | 12 | 115 | 19082 | 110.53 | 673 | 656 | 166.7 |
| B | 5 | 236 | 244621 | 1720.81 | 654 | 629 | 141.8 |
| B | 10 | 247 | 53203 | 370.79 | 654 | 629 | 141.8 |
| B | 1 | 238 | 44977 | 312.78 | 654 | 629 | 141.8 |
| C | 15 | 178 | 280041 | 1586.99 | 646 | 640 | 176.1 |
| C | 9 | 38 | 106704 | 602.44 | 646 | 640 | 176.1 |
| C | 9 | 237 | 68634 | 386.2 | 646 | 640 | 176.1 |
| D | 8 | 160 | 893490 | 4897.46 | 642 | 611 | 182.3 |
| D | 15 | 125 | 229855 | 1257.41 | 642 | 611 | 182.3 |
| D | 2 | 172 | 65094 | 353.69 | 642 | 611 | 182.3 |
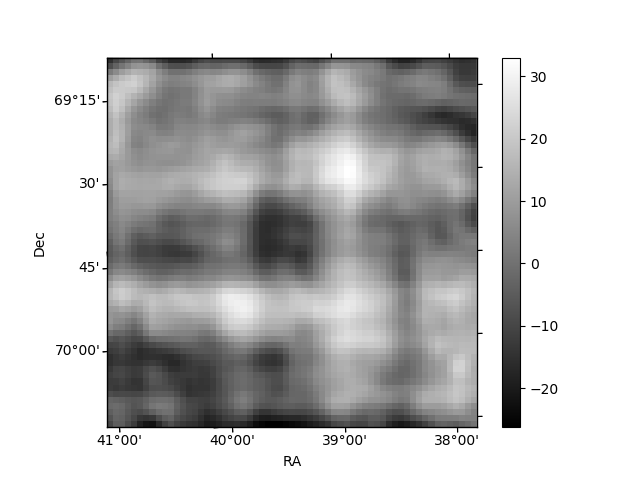
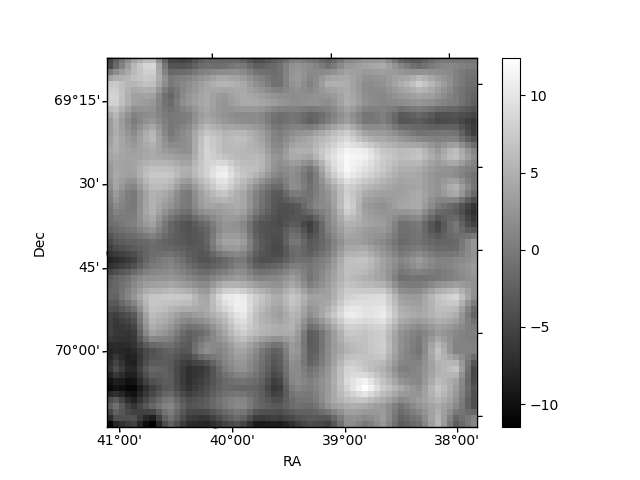
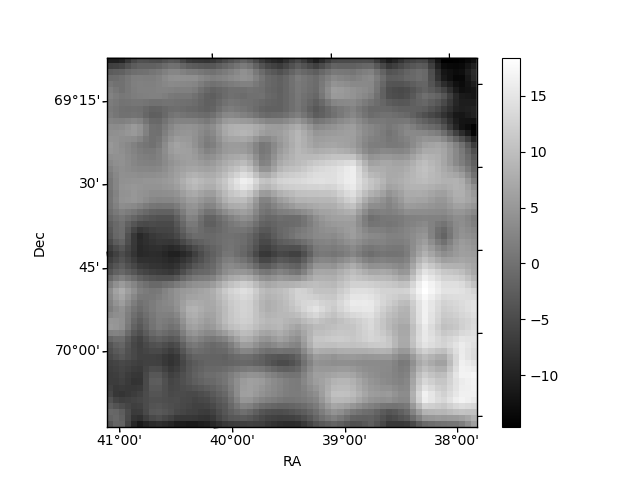
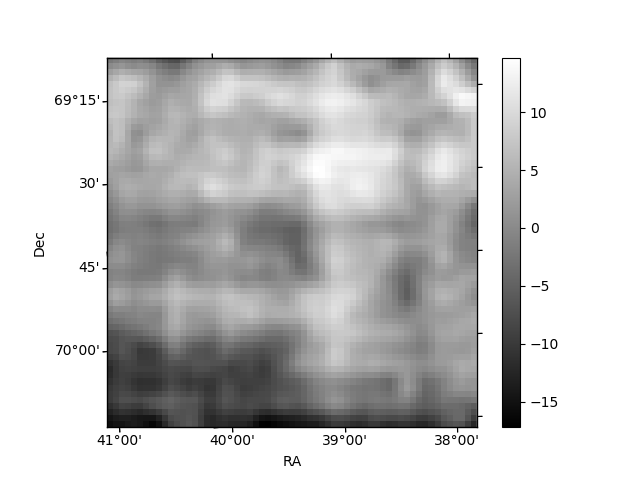
Histogram calculated using DETX and DETY for each event in the final _common_clean file
| Quadrant A | 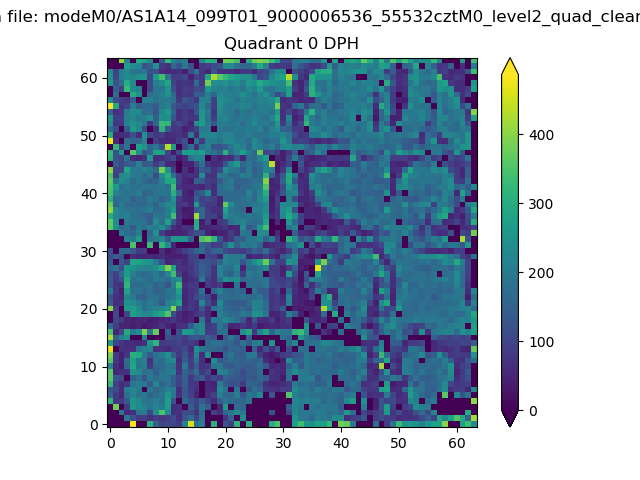 |
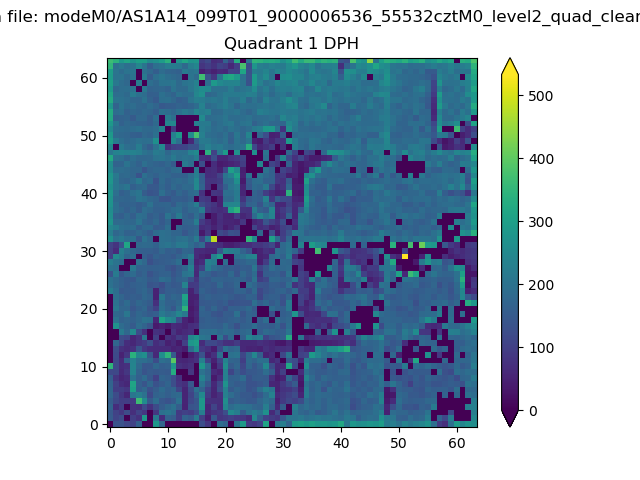 |
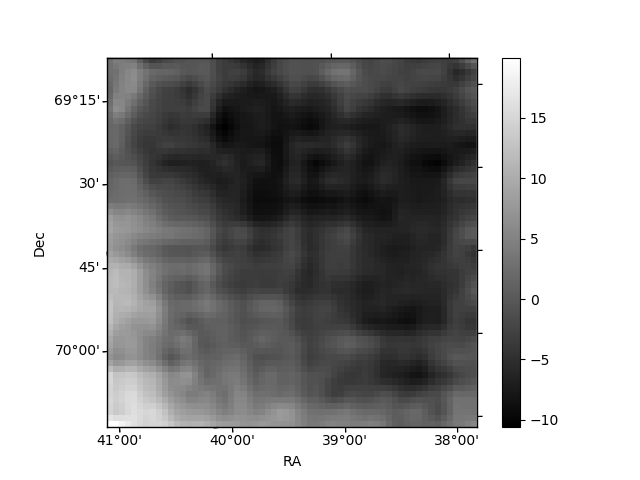
Quadrant B |
|---|---|---|---|
| Quadrant D | 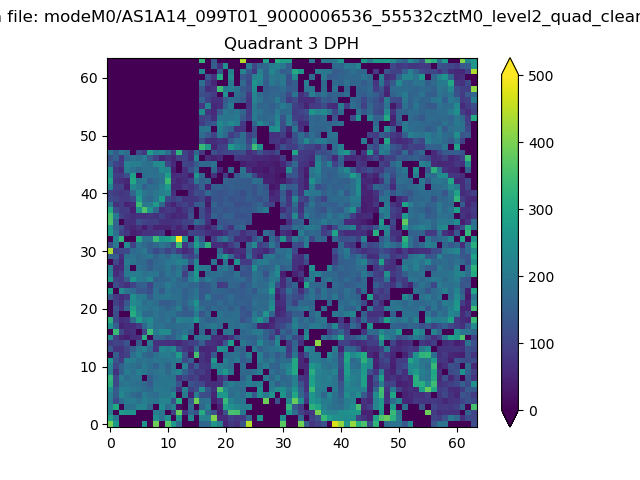 |
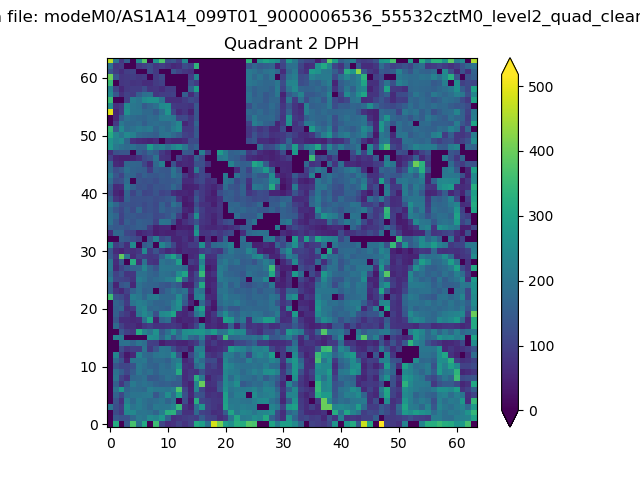 |
Quadrant C |
| Plot type | Count rate plots | Images |
|---|---|---|
| Comparison with Poisson distribution Blue bars denote a histogram of data divided into 1 sec bins. Red curve is a Poisson curve with rate = median count rate of data. |
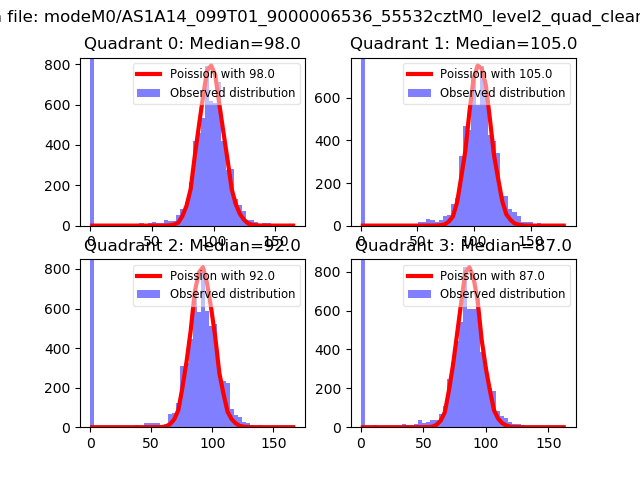 |
 |
| Quadrant-wise count rates Data is divided into 100 sec bins |
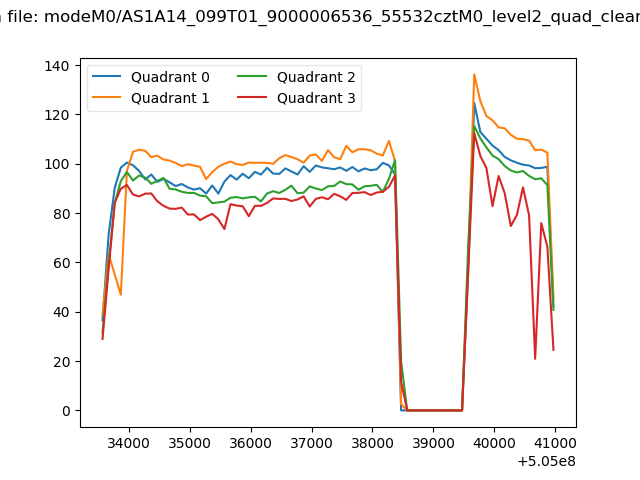 |
|
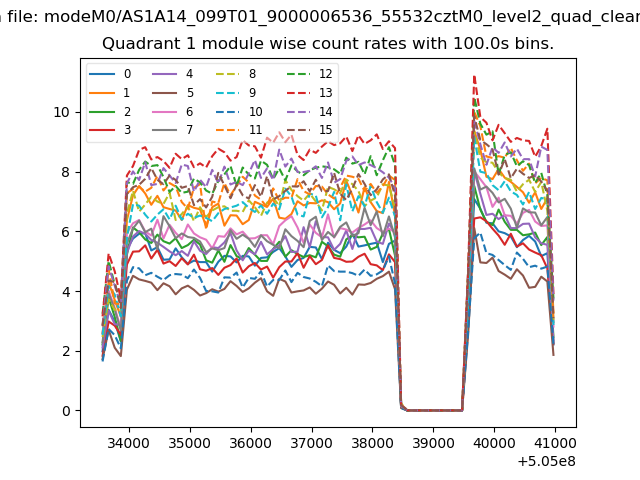
| Module-wise count rates for Quadrant A Data is divided into 100 sec bins |
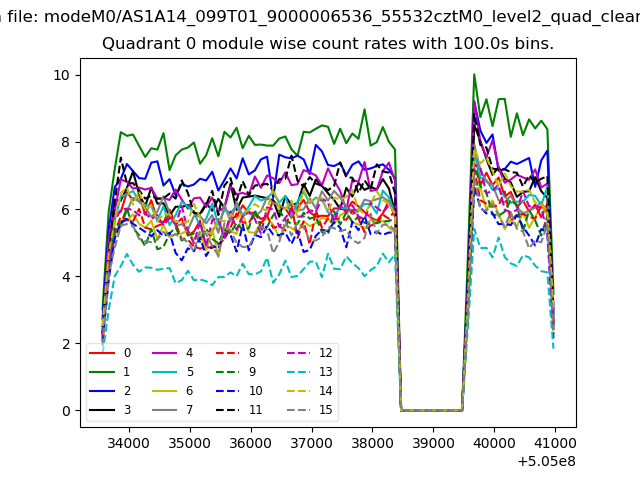 |
 |
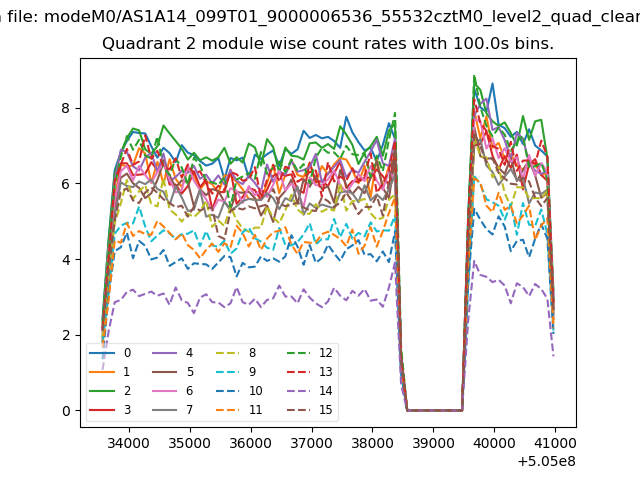
| Module-wise count rates for Quadrant B Data is divided into 100 sec bins |
 |
 |
| Module-wise count rates for Quadrant C Data is divided into 100 sec bins |
 |
 |
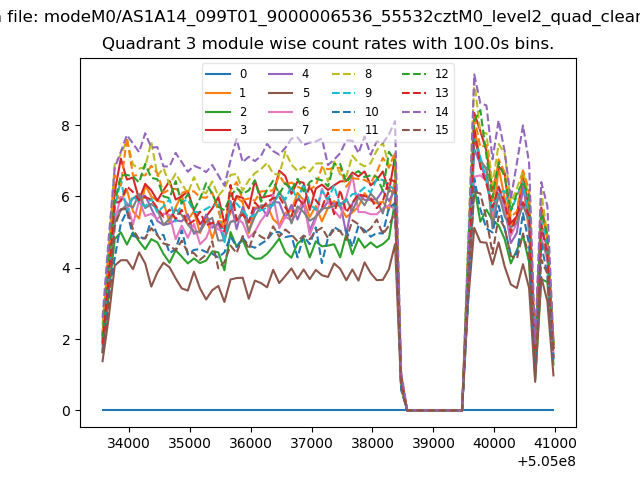
| Module-wise count rates for Quadrant D Data is divided into 100 sec bins |
 |
 |
| Parameter | Plot |
|---|---|
| CZT HV Monitor | 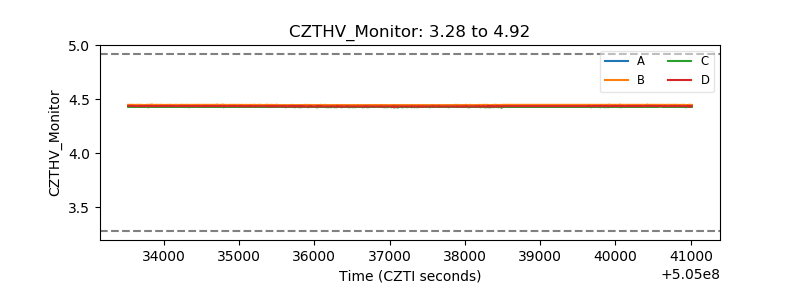 |
| D_VDD | 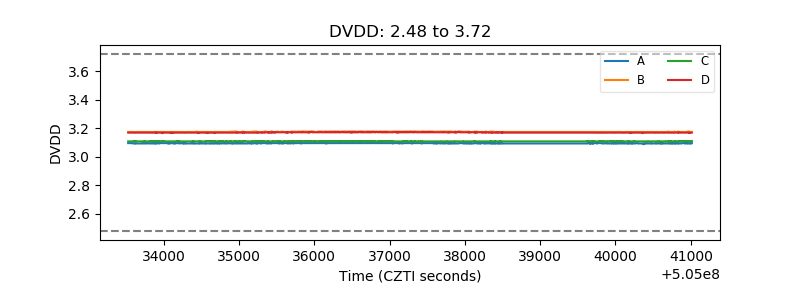 |
| Temperature 1 | 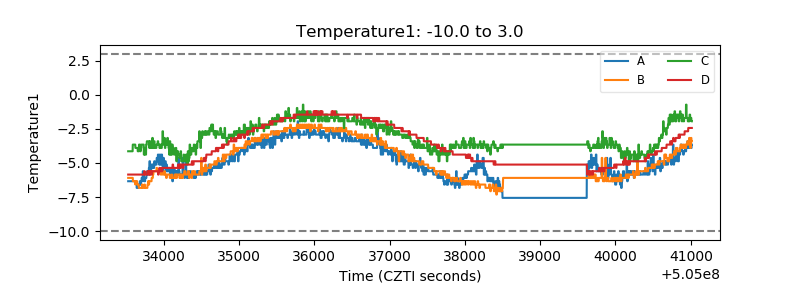 |
| Veto HV Monitor | 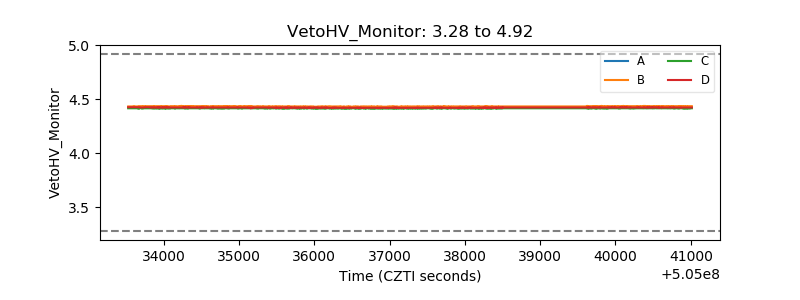 |
| Veto LLD | 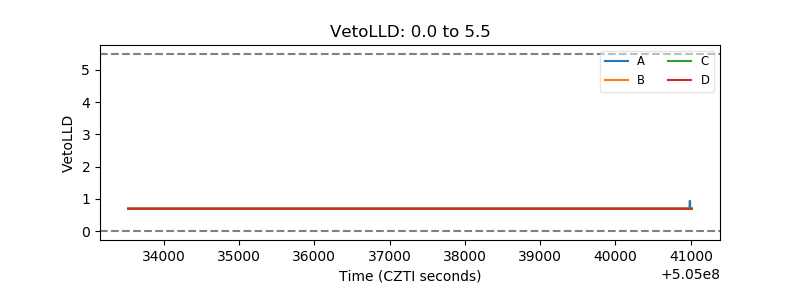 |
| Alpha Counter | 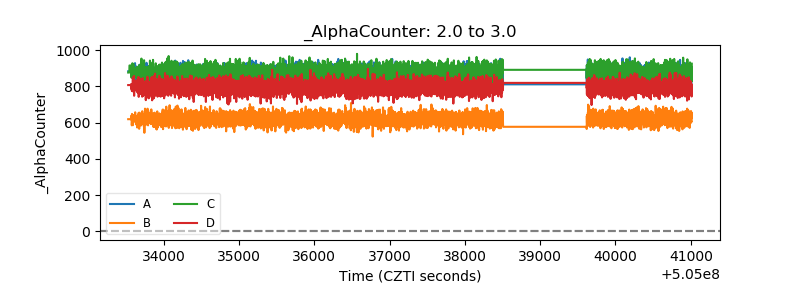 |
| _CPM_Rate | 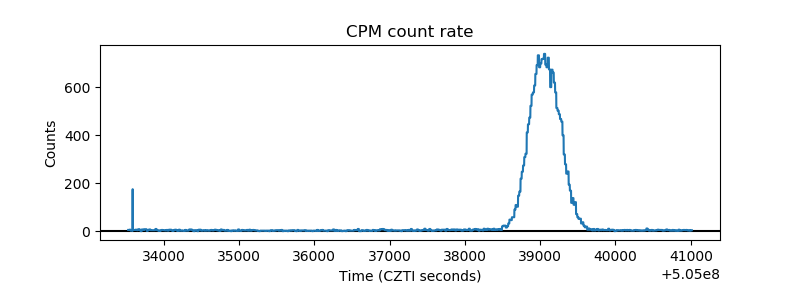 |
| CZT Counter | 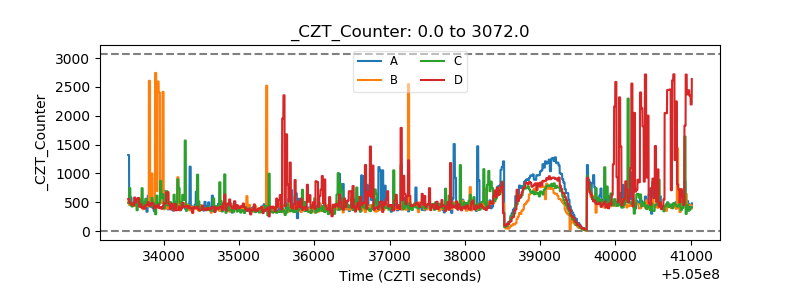 |
| +2.5 Volts monitor | 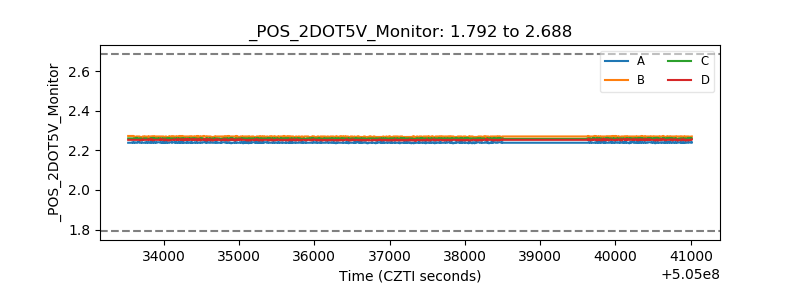 |
| +5 Volts monitor | 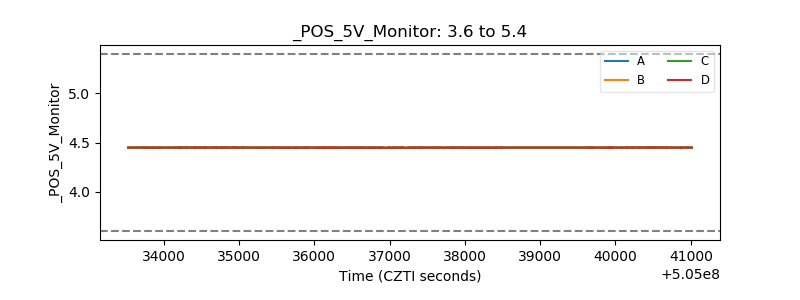 |
| _ROLL_ROT | 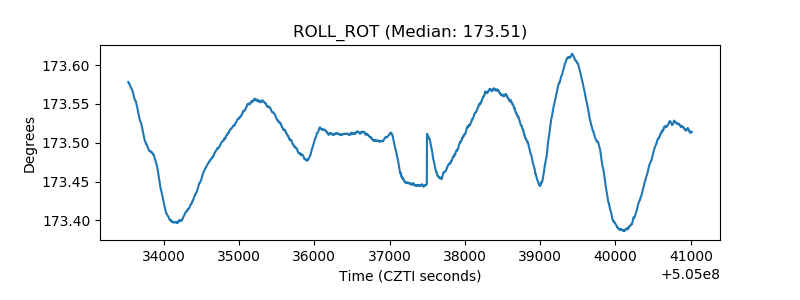 |
| _Roll_DEC | 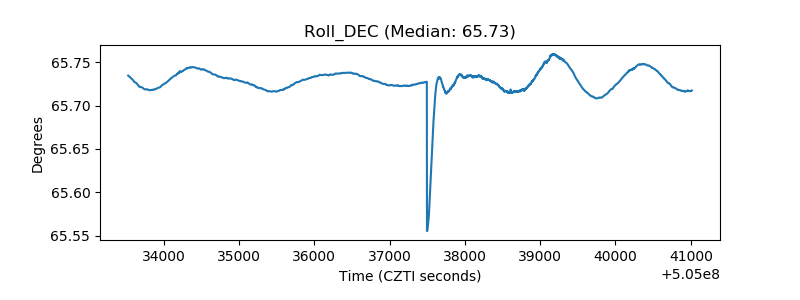 |
| _Roll_RA | 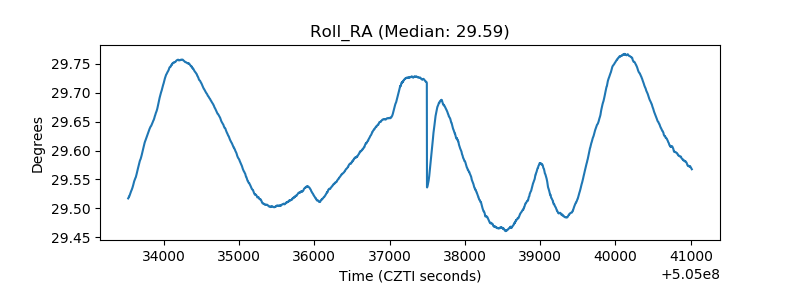 |
| Veto Counter | 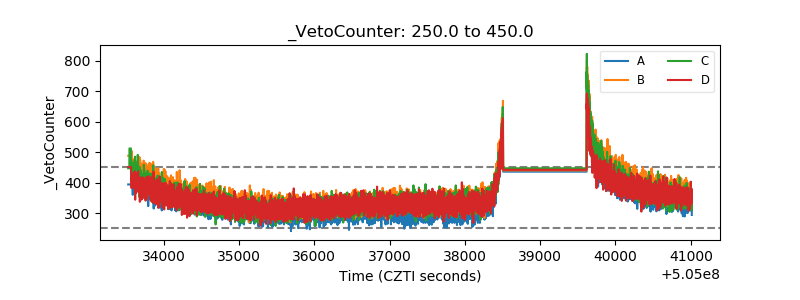 |