| Param | Original file | Final file |
|---|---|---|
| Filename | modeM0/AS1A14_099T01_9000006536_55533cztM0_level2.fits | modeM0/AS1A14_099T01_9000006536_55533cztM0_level2_quad_clean.evt |
| Size (bytes) | 418,049,280 | 90,838,080 |
| Size | 398.7 MB | 86.6 MB |
| Events in quadrant A | 3,119,431 | 606,002 |
| Events in quadrant B | 2,911,374 | 648,584 |
| Events in quadrant C | 3,001,460 | 570,909 |
| Events in quadrant D | 5,964,440 | 496,362 |
| Mode M9 | |||
|---|---|---|---|
| Quadrant | BADHDUFLAG | Total packets | Discarded packets |
| A | 0 | 11 | 0 |
| B | 0 | 11 | 0 |
| C | 0 | 11 | 0 |
| D | 0 | 11 | 0 |
| Mode SS | |||
|---|---|---|---|
| Quadrant | BADHDUFLAG | Total packets | Discarded packets |
| A | 0 | 124 | 0 |
| B | 0 | 124 | 0 |
| C | 0 | 124 | 0 |
| D | 0 | 124 | 0 |
| Mode M0 | |||
|---|---|---|---|
| Quadrant | BADHDUFLAG | Total packets | Discarded packets |
| A | 0 | 13568 | 1 |
| B | 0 | 13085 | 1 |
| C | 0 | 13478 | 1 |
| D | 0 | 21971 | 1 |
| Quadrant | Total seconds | Saturated seconds | Saturation percentage |
|---|---|---|---|
| A | 6144 | 107 | 1.741536% |
| B | 6144 | 150 | 2.441406% |
| C | 6144 | 88 | 1.432292% |
| D | 6144 | 788 | 12.825521% |
Noise dominated data is calculated using 1-second bins in cleaned event files. If a bin has >2000 counts, and if more than 50% of those come from <1% of pixels, then it is considered to be noise-dominated and hence unusable.
| Quadrant | # 1 sec bins | Bins with >0 counts | Bins with >2000 counts | High rate bins dominated by noise | Noise dominated (total time) | Noise dominated (detector-on time) | Marked lightcurve |
|---|---|---|---|---|---|---|---|
| A | 7259 | 6145 | 3 | 3 | 0.04% | 0.05% | 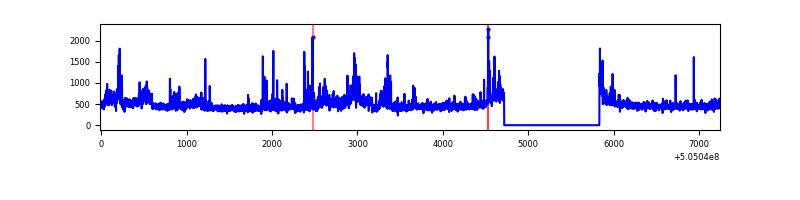 |
| B | 7259 | 6144 | 25 | 25 | 0.34% | 0.41% | 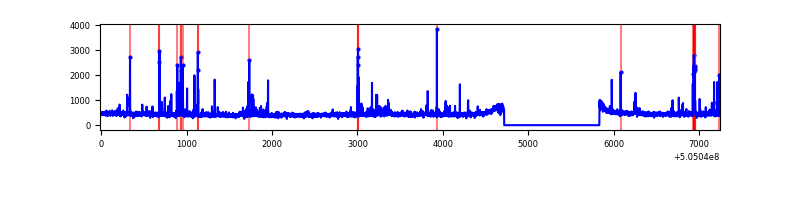 |
| C | 7259 | 6144 | 19 | 19 | 0.26% | 0.31% | 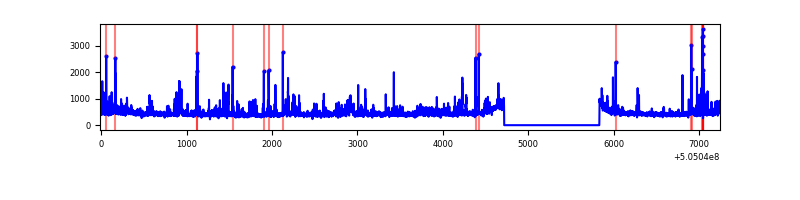 |
| D | 7259 | 6144 | 700 | 700 | 9.64% | 11.39% | 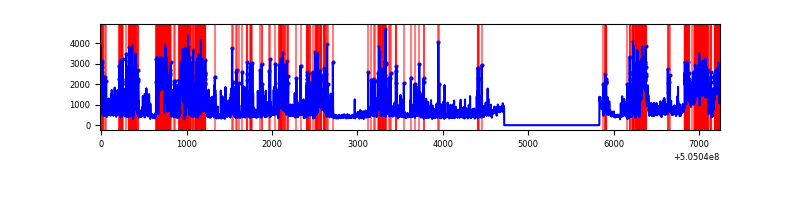 |
Top three noisy pixels from each quadrant. If the there are fewer than three noisy pixels in the level2.evt file, extra rows are filled as -1
| Pixel properties | Quadrant properties | ||||||
|---|---|---|---|---|---|---|---|
| Quadrant | DetID | PixID | Counts | Sigma | Mean | Median | Sigma |
| A | 3 | 14 | 254344 | 1542.17 | 669 | 651 | 164.5 |
| A | 4 | 205 | 147761 | 894.27 | 669 | 651 | 164.5 |
| A | 7 | 243 | 43950 | 263.21 | 669 | 651 | 164.5 |
| B | 5 | 236 | 61827 | 437.2 | 655 | 634 | 140.0 |
| B | 10 | 247 | 61211 | 432.8 | 655 | 634 | 140.0 |
| B | 1 | 238 | 55598 | 392.7 | 655 | 634 | 140.0 |
| C | 15 | 178 | 158351 | 891.79 | 643 | 635 | 176.9 |
| C | 9 | 38 | 146420 | 824.33 | 643 | 635 | 176.9 |
| C | 13 | 3 | 94335 | 529.82 | 643 | 635 | 176.9 |
| D | 8 | 160 | 1162405 | 6642.46 | 623 | 595 | 174.9 |
| D | 11 | 129 | 1089911 | 6227.99 | 623 | 595 | 174.9 |
| D | 15 | 125 | 603227 | 3445.45 | 623 | 595 | 174.9 |
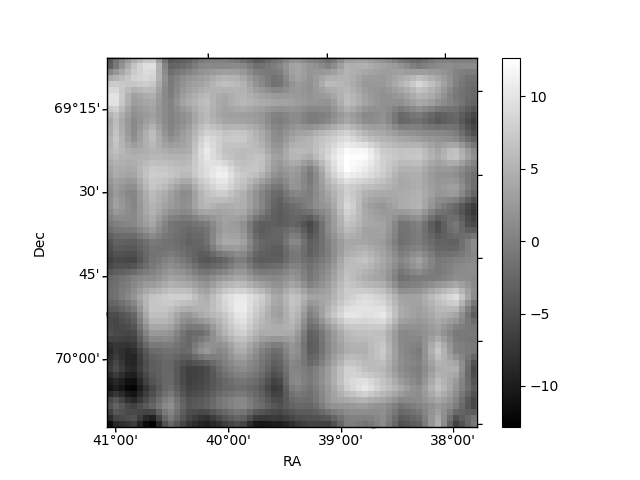
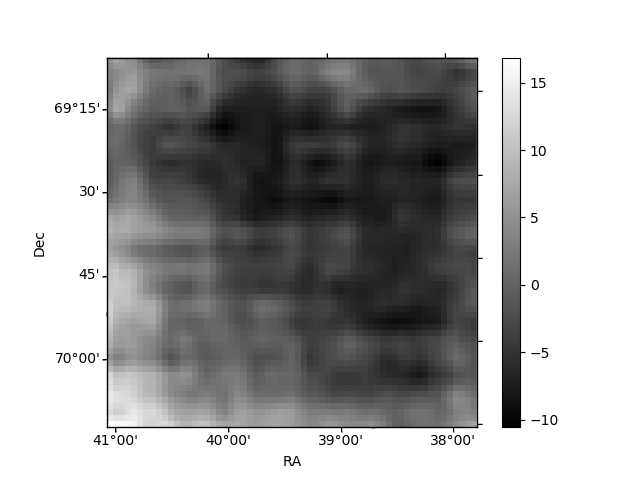
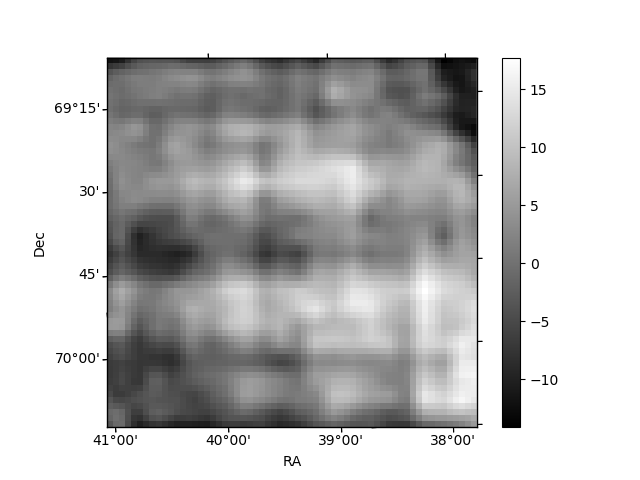
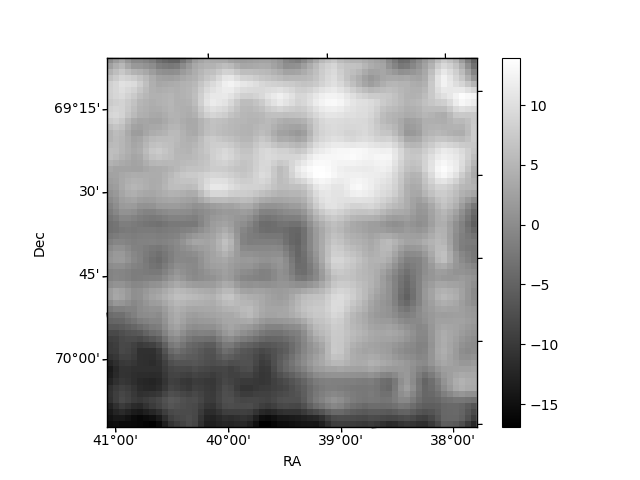
Histogram calculated using DETX and DETY for each event in the final _common_clean file
| Quadrant A | 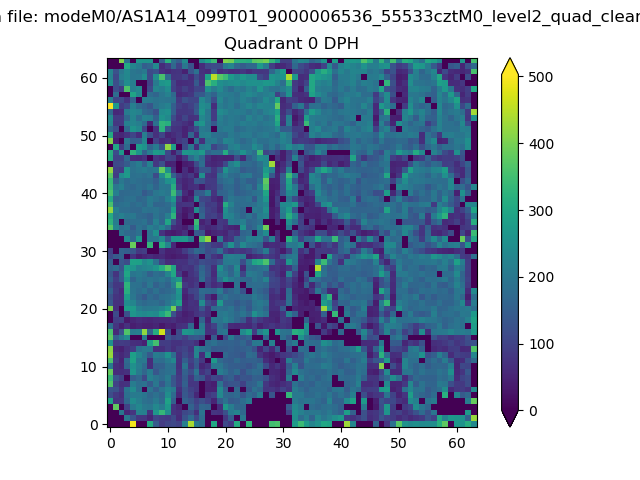 |
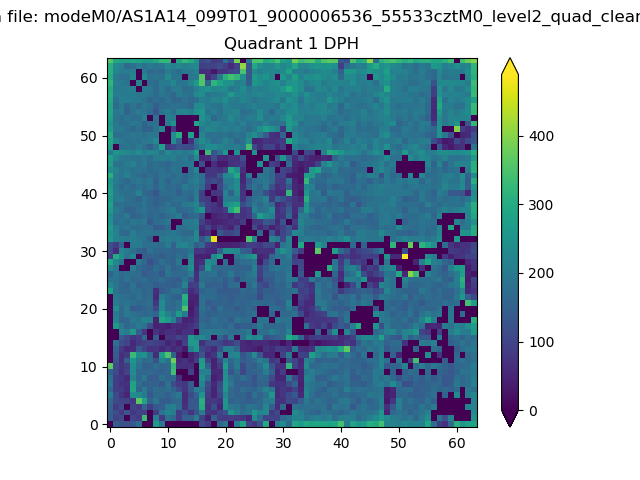 |
Quadrant B |
|---|---|---|---|
| Quadrant D | 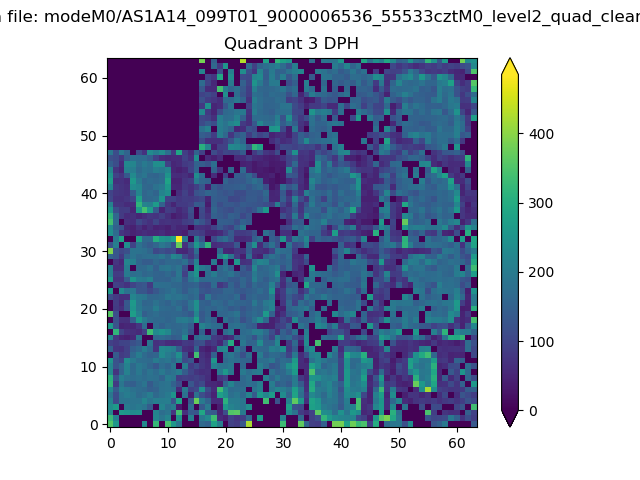 |
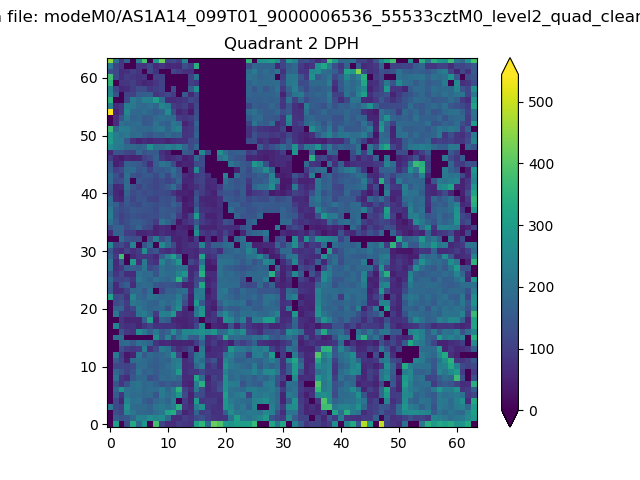 |
Quadrant C |
| Plot type | Count rate plots | Images |
|---|---|---|
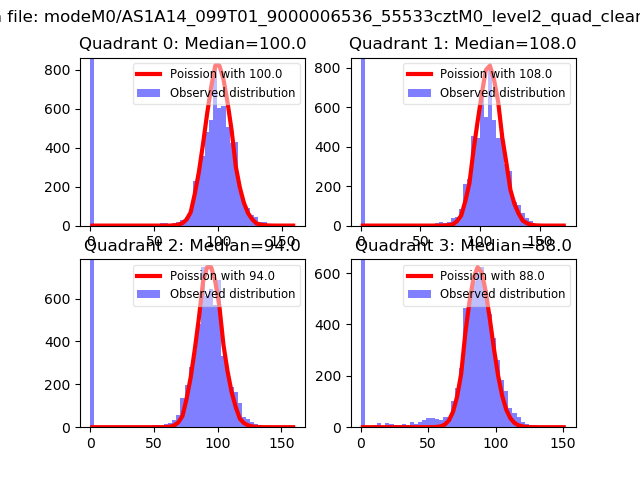
| Comparison with Poisson distribution Blue bars denote a histogram of data divided into 1 sec bins. Red curve is a Poisson curve with rate = median count rate of data. |
 |
 |
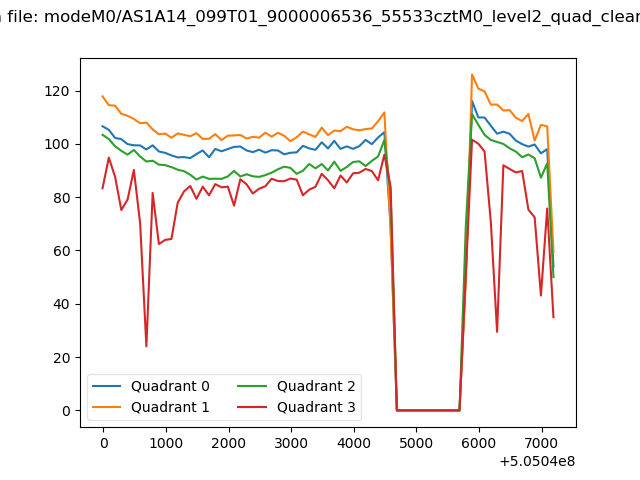
| Quadrant-wise count rates Data is divided into 100 sec bins |
 |
|
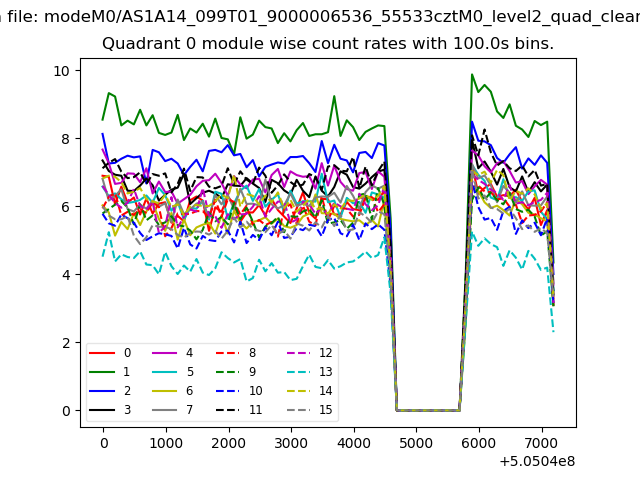
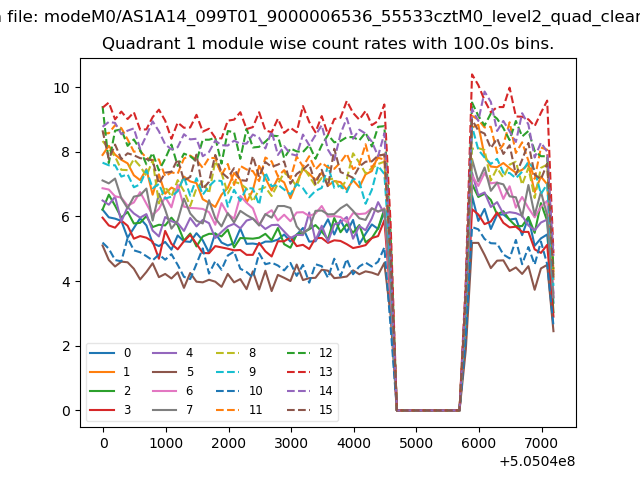
| Module-wise count rates for Quadrant A Data is divided into 100 sec bins |
 |
 |
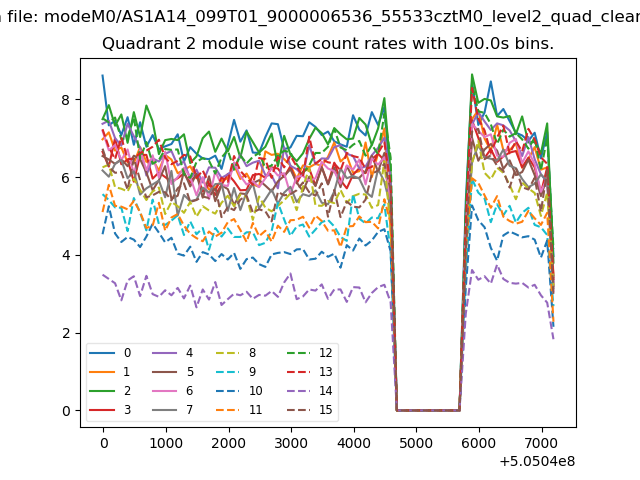
| Module-wise count rates for Quadrant B Data is divided into 100 sec bins |
 |
 |
| Module-wise count rates for Quadrant C Data is divided into 100 sec bins |
 |
 |
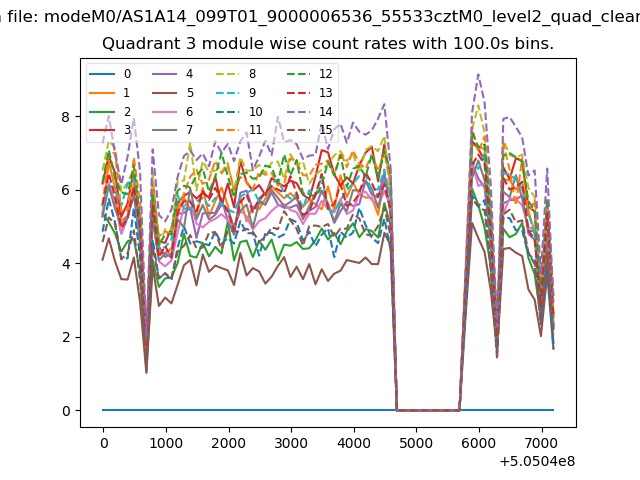
| Module-wise count rates for Quadrant D Data is divided into 100 sec bins |
 |
 |
| Parameter | Plot |
|---|---|
| CZT HV Monitor | 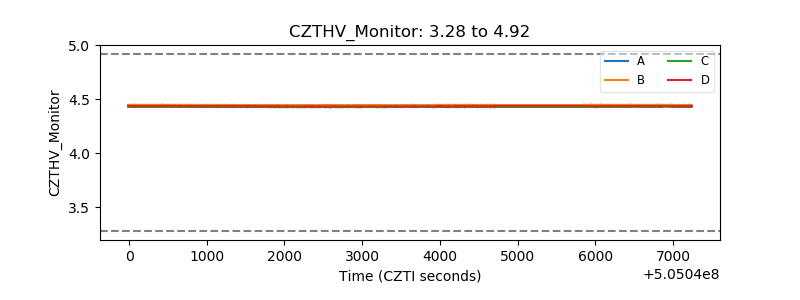 |
| D_VDD | 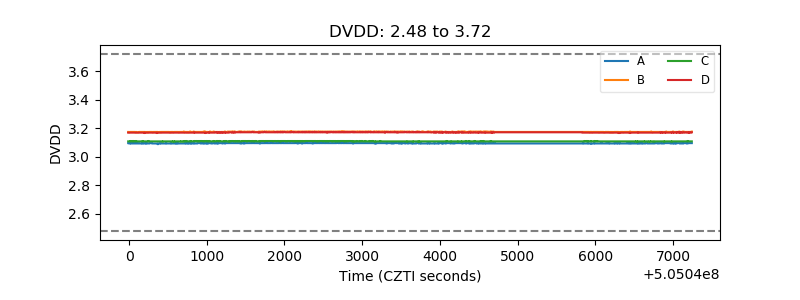 |
| Temperature 1 | 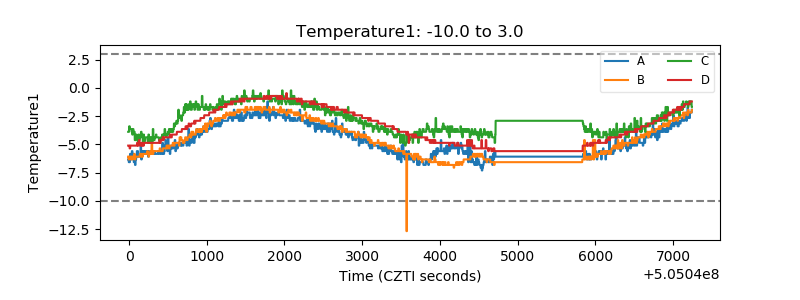 |
| Veto HV Monitor | 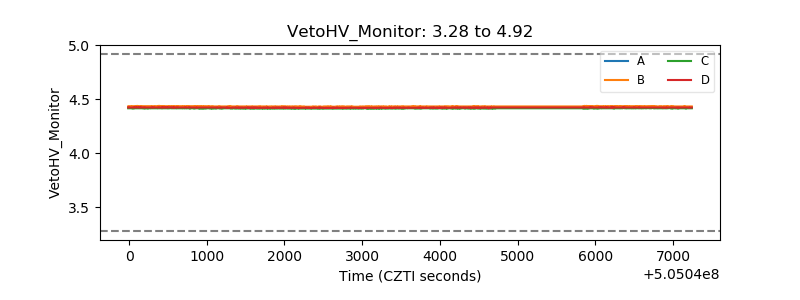 |
| Veto LLD | 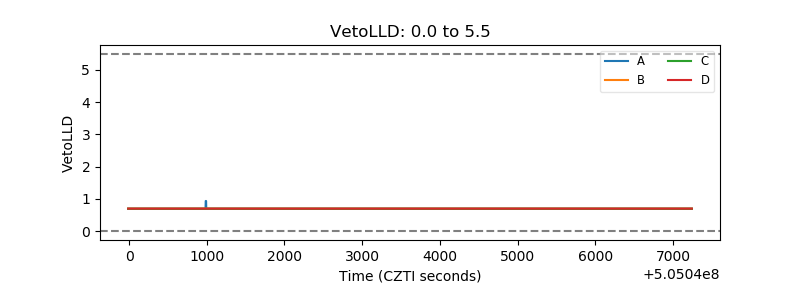 |
| Alpha Counter | 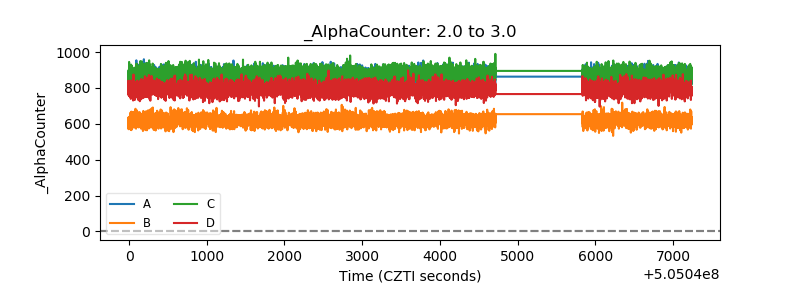 |
| _CPM_Rate | 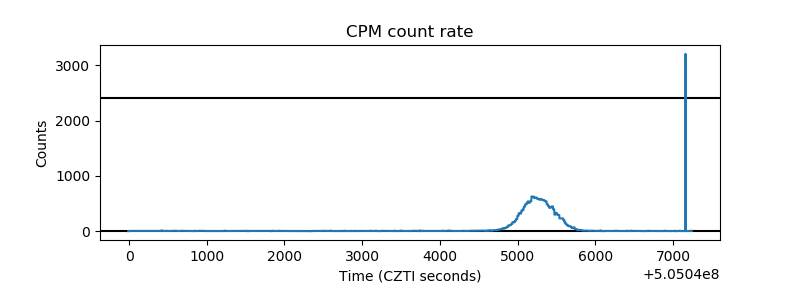 |
| CZT Counter | 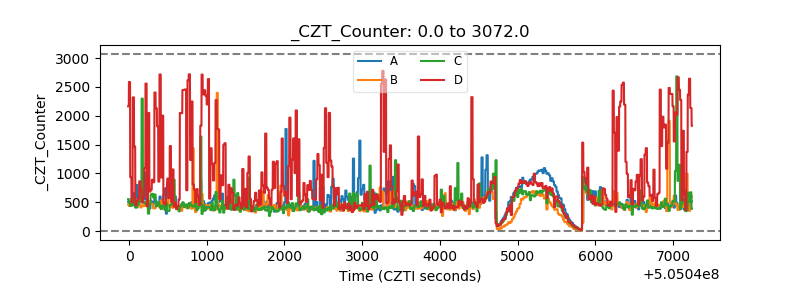 |
| +2.5 Volts monitor | 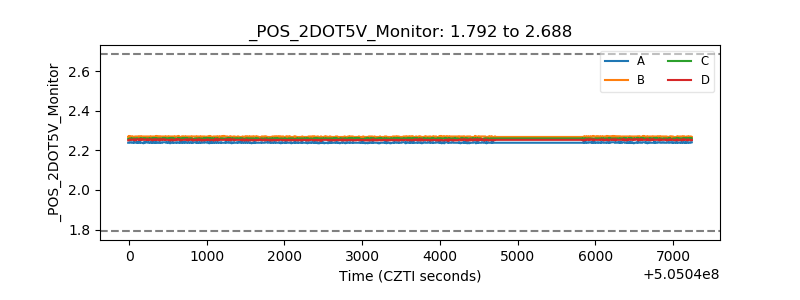 |
| +5 Volts monitor | 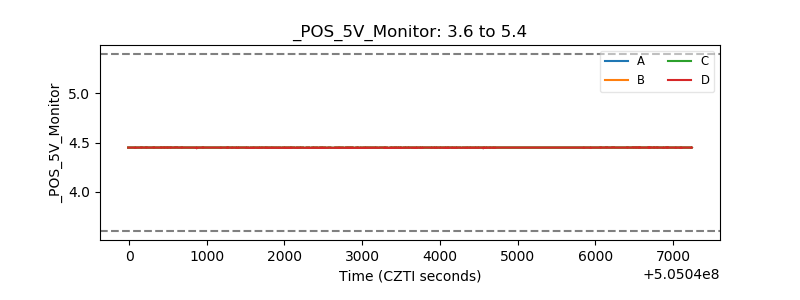 |
| _ROLL_ROT | 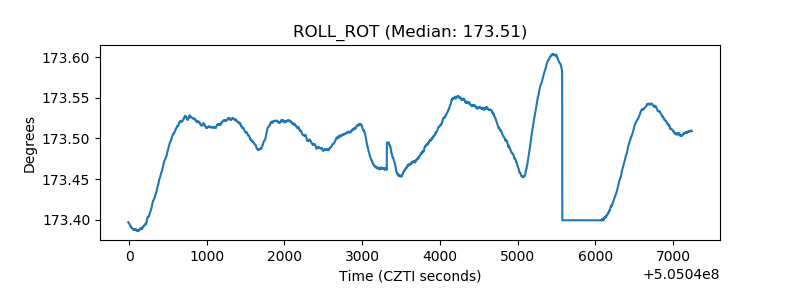 |
| _Roll_DEC | 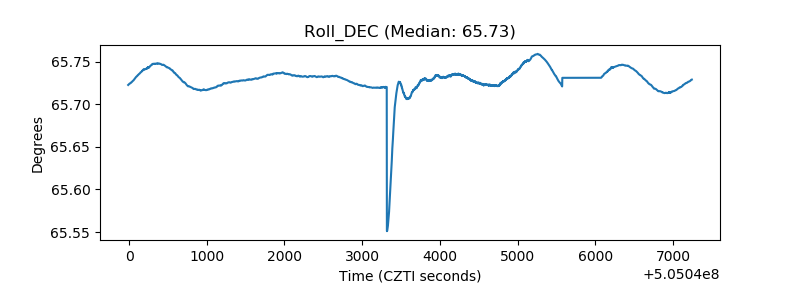 |
| _Roll_RA | 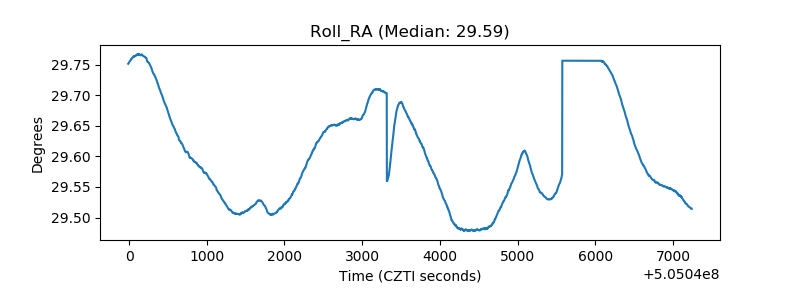 |
| Veto Counter | 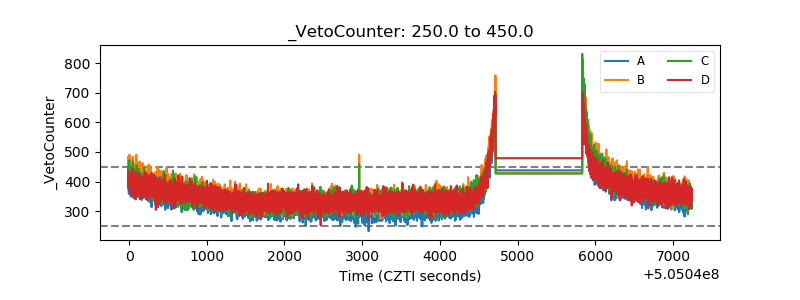 |