| Param | Original file | Final file |
|---|---|---|
| Filename | modeM0/AS1A14_099T01_9000006536_55535cztM0_level2.fits | modeM0/AS1A14_099T01_9000006536_55535cztM0_level2_quad_clean.evt |
| Size (bytes) | 451,100,160 | 88,174,080 |
| Size | 430.2 MB | 84.1 MB |
| Events in quadrant A | 2,848,499 | 591,685 |
| Events in quadrant B | 3,152,435 | 630,581 |
| Events in quadrant C | 4,568,400 | 521,103 |
| Events in quadrant D | 5,651,106 | 497,076 |
| Mode M9 | |||
|---|---|---|---|
| Quadrant | BADHDUFLAG | Total packets | Discarded packets |
| A | 0 | 9 | 0 |
| B | 0 | 9 | 0 |
| C | 0 | 9 | 0 |
| D | 0 | 9 | 0 |
| Mode SS | |||
|---|---|---|---|
| Quadrant | BADHDUFLAG | Total packets | Discarded packets |
| A | 0 | 126 | 0 |
| B | 0 | 126 | 0 |
| C | 0 | 126 | 0 |
| D | 0 | 126 | 0 |
| Mode M0 | |||
|---|---|---|---|
| Quadrant | BADHDUFLAG | Total packets | Discarded packets |
| A | 0 | 12905 | 1 |
| B | 0 | 13651 | 1 |
| C | 0 | 17941 | 2 |
| D | 0 | 21026 | 1 |
| Quadrant | Total seconds | Saturated seconds | Saturation percentage |
|---|---|---|---|
| A | 6149 | 58 | 0.943243% |
| B | 6149 | 101 | 1.642544% |
| C | 6149 | 469 | 7.627256% |
| D | 6149 | 533 | 8.668076% |
Noise dominated data is calculated using 1-second bins in cleaned event files. If a bin has >2000 counts, and if more than 50% of those come from <1% of pixels, then it is considered to be noise-dominated and hence unusable.
| Quadrant | # 1 sec bins | Bins with >0 counts | Bins with >2000 counts | High rate bins dominated by noise | Noise dominated (total time) | Noise dominated (detector-on time) | Marked lightcurve |
|---|---|---|---|---|---|---|---|
| A | 7139 | 6150 | 1 | 1 | 0.01% | 0.02% | 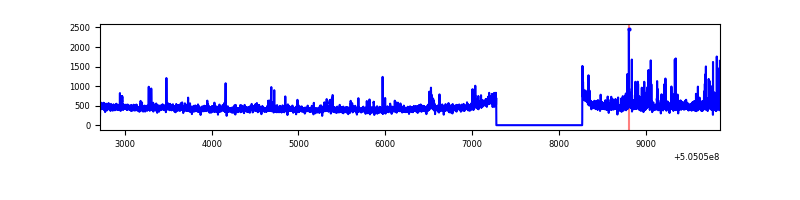 |
| B | 7139 | 6150 | 32 | 32 | 0.45% | 0.52% | 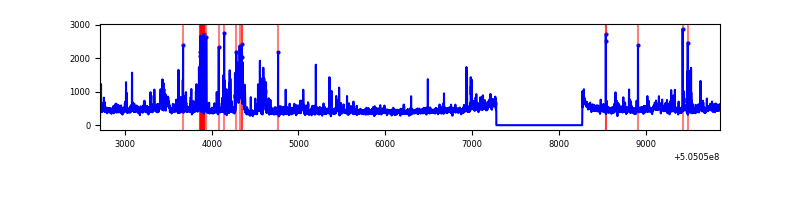 |
| C | 7139 | 6150 | 295 | 295 | 4.13% | 4.80% | 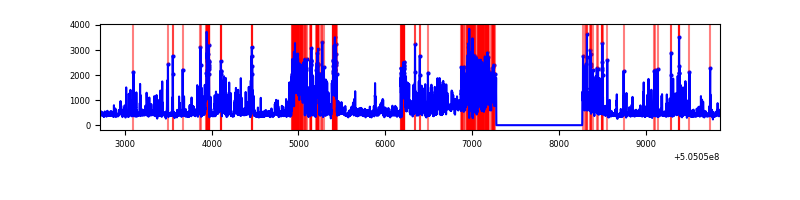 |
| D | 7139 | 6150 | 500 | 500 | 7.00% | 8.13% | 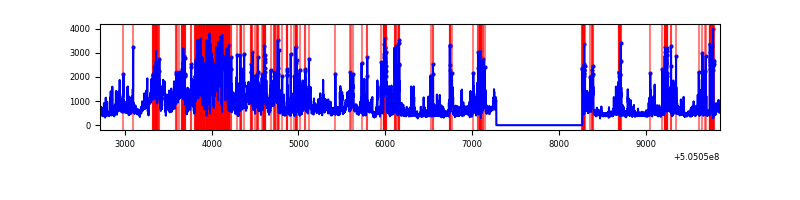 |
Top three noisy pixels from each quadrant. If the there are fewer than three noisy pixels in the level2.evt file, extra rows are filled as -1
| Pixel properties | Quadrant properties | ||||||
|---|---|---|---|---|---|---|---|
| Quadrant | DetID | PixID | Counts | Sigma | Mean | Median | Sigma |
| A | 6 | 161 | 125085 | 773.62 | 647 | 631 | 160.9 |
| A | 3 | 14 | 78399 | 483.42 | 647 | 631 | 160.9 |
| A | 4 | 3 | 40042 | 244.98 | 647 | 631 | 160.9 |
| B | 5 | 236 | 240519 | 1770.08 | 635 | 613 | 135.5 |
| B | 0 | 171 | 142294 | 1045.35 | 635 | 613 | 135.5 |
| B | 10 | 247 | 50823 | 370.46 | 635 | 613 | 135.5 |
| C | 9 | 38 | 1698182 | 10214.37 | 608 | 603 | 166.2 |
| C | 15 | 178 | 257654 | 1546.68 | 608 | 603 | 166.2 |
| C | 14 | 254 | 88432 | 528.47 | 608 | 603 | 166.2 |
| D | 11 | 129 | 2085154 | 12077.19 | 608 | 580 | 172.6 |
| D | 6 | 239 | 290773 | 1681.26 | 608 | 580 | 172.6 |
| D | 2 | 153 | 240882 | 1392.21 | 608 | 580 | 172.6 |
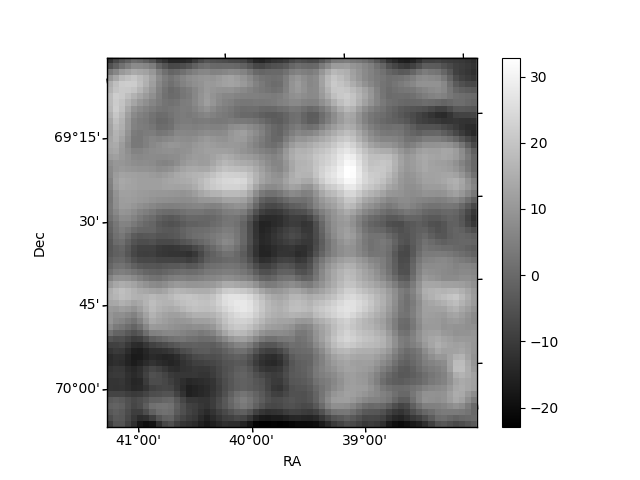
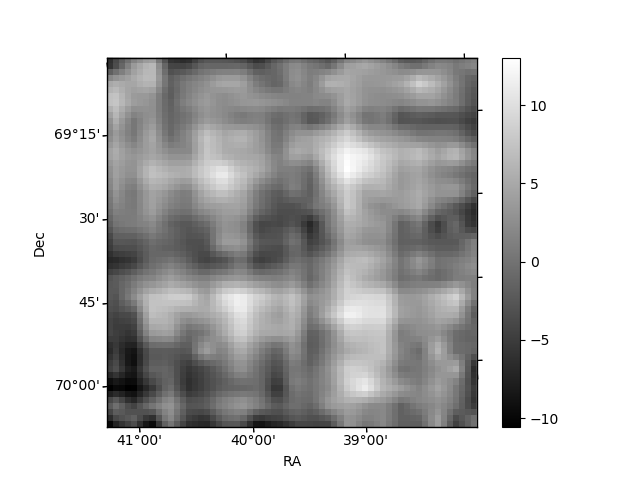
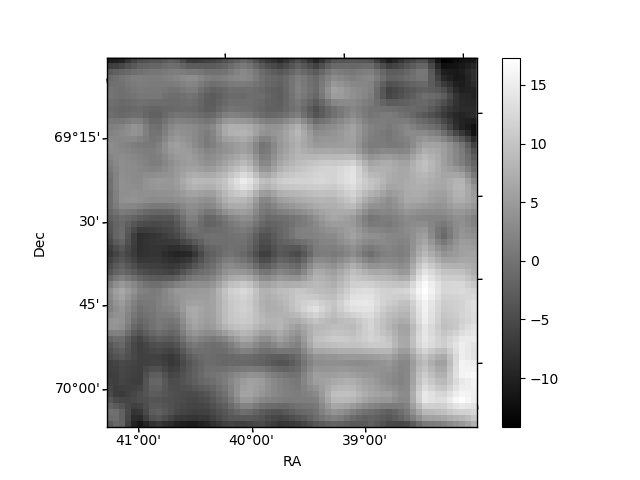
Histogram calculated using DETX and DETY for each event in the final _common_clean file
| Quadrant A | 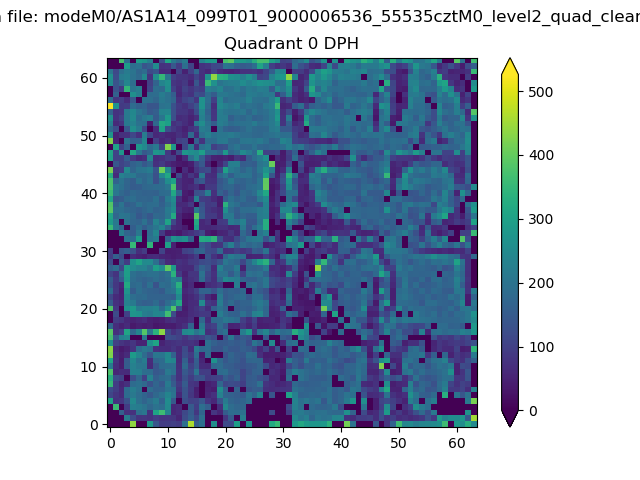 |
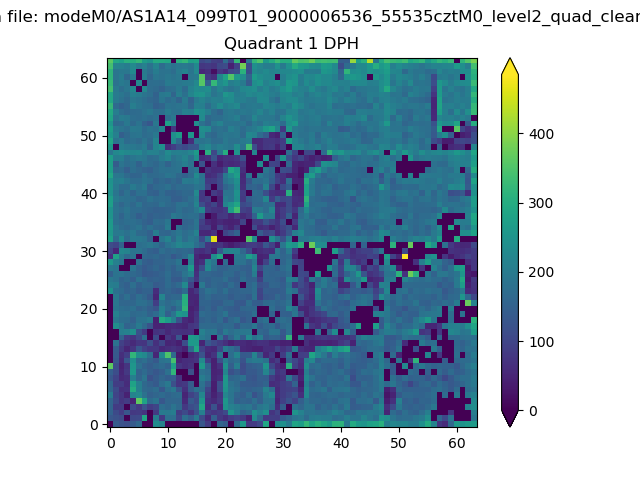 |
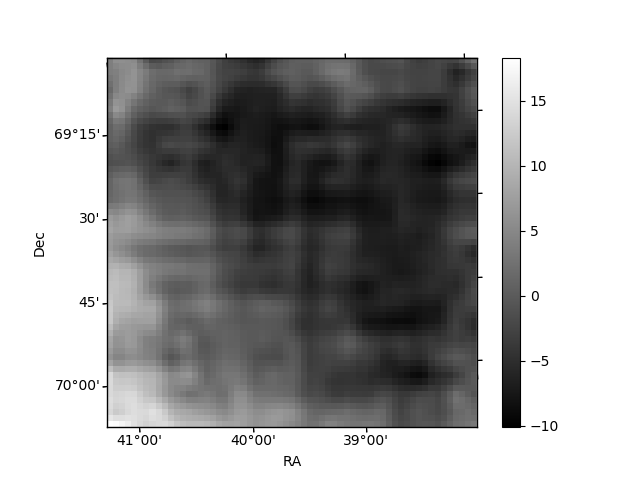
Quadrant B |
|---|---|---|---|
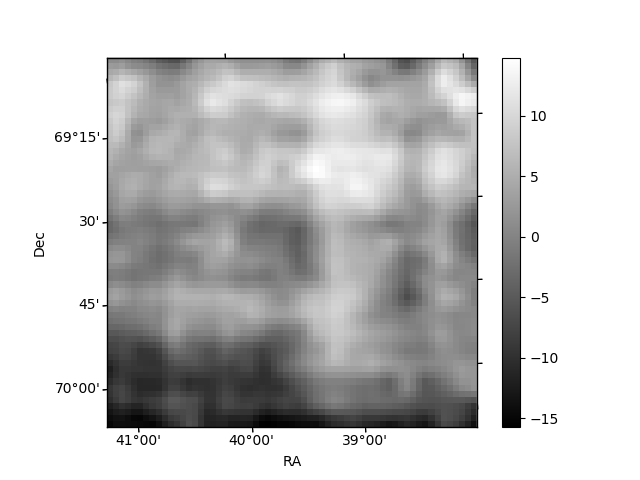
| Quadrant D | 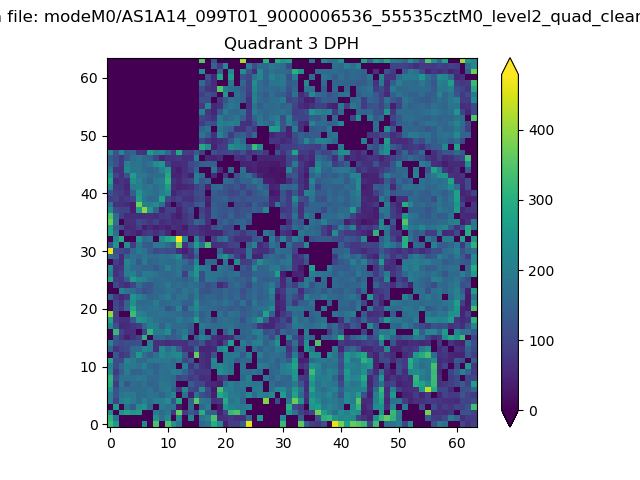 |
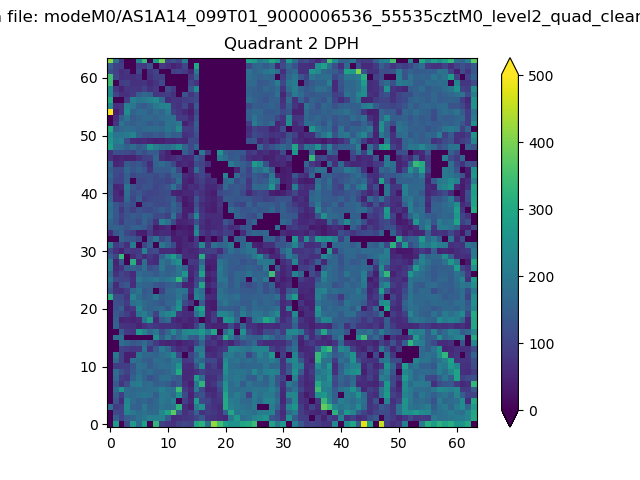 |
Quadrant C |
| Plot type | Count rate plots | Images |
|---|---|---|
| Comparison with Poisson distribution Blue bars denote a histogram of data divided into 1 sec bins. Red curve is a Poisson curve with rate = median count rate of data. |
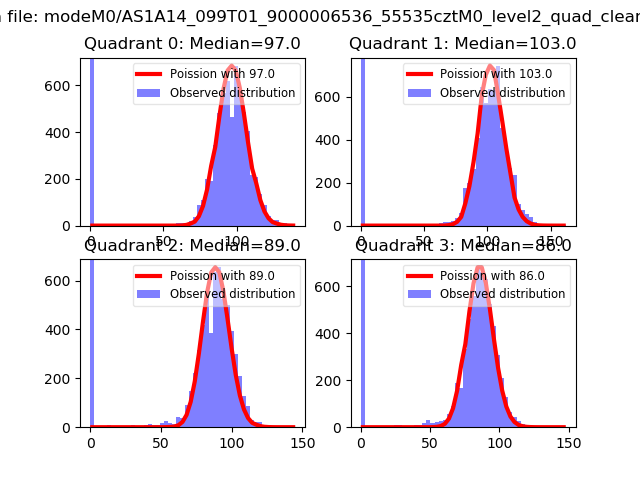 |
 |
| Quadrant-wise count rates Data is divided into 100 sec bins |
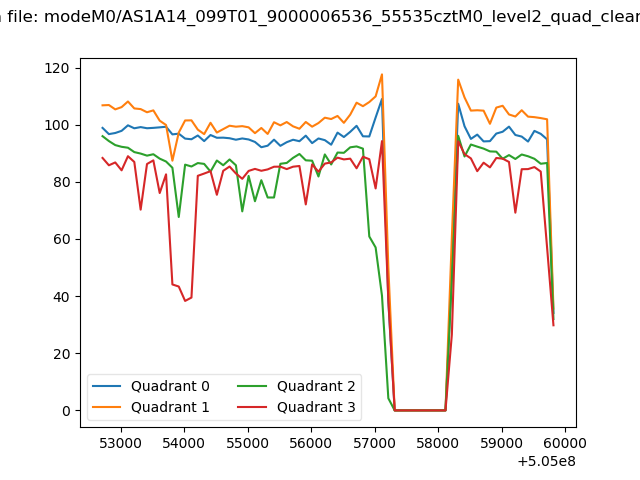 |
|
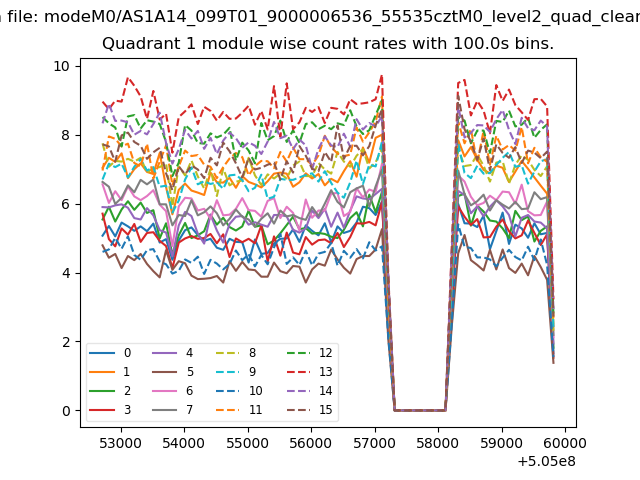
| Module-wise count rates for Quadrant A Data is divided into 100 sec bins |
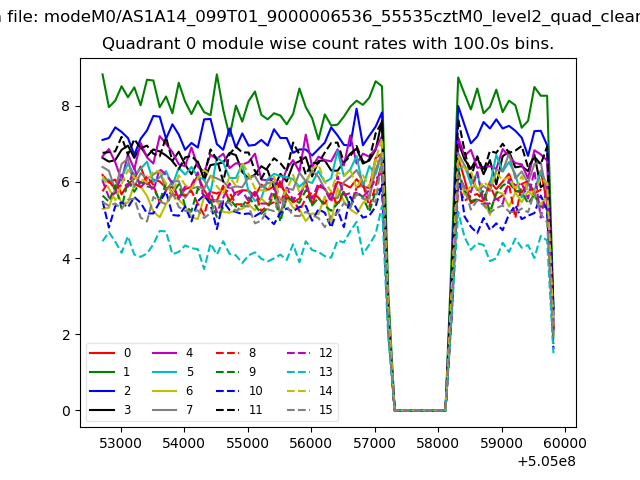 |
 |
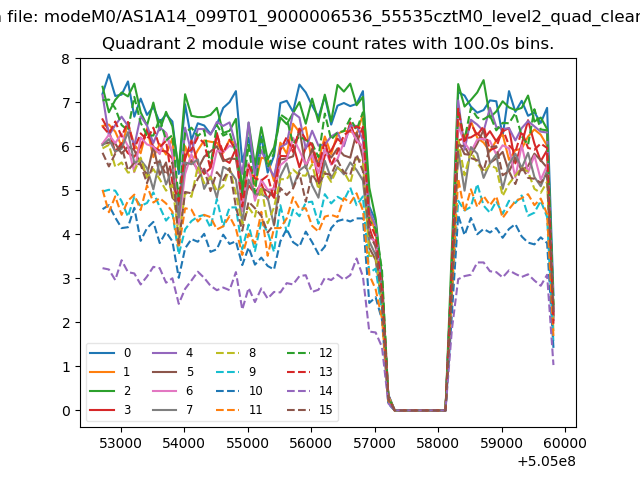
| Module-wise count rates for Quadrant B Data is divided into 100 sec bins |
 |
 |
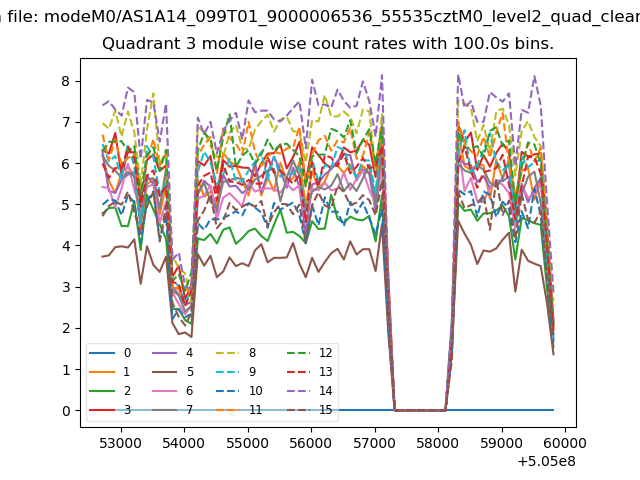
| Module-wise count rates for Quadrant C Data is divided into 100 sec bins |
 |
 |
| Module-wise count rates for Quadrant D Data is divided into 100 sec bins |
 |
 |
| Parameter | Plot |
|---|---|
| CZT HV Monitor | 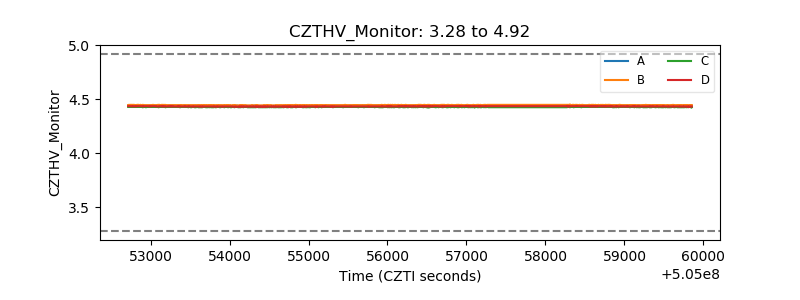 |
| D_VDD | 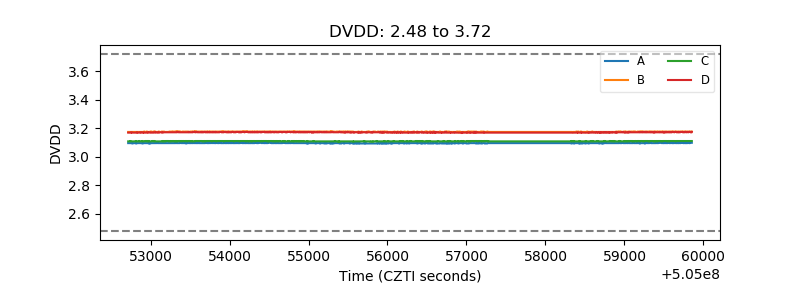 |
| Temperature 1 | 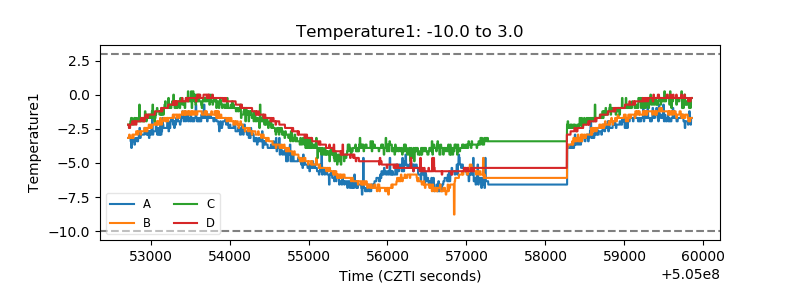 |
| Veto HV Monitor | 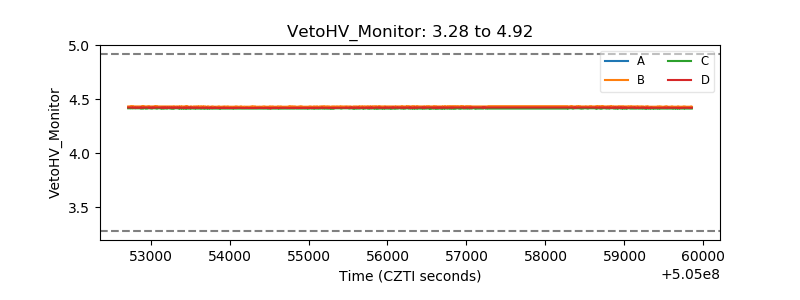 |
| Veto LLD | 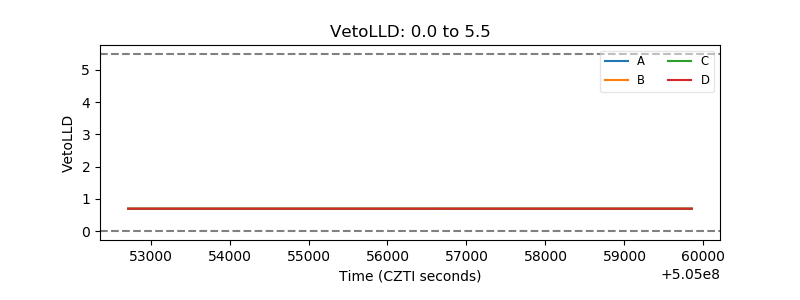 |
| Alpha Counter |  |
| _CPM_Rate | 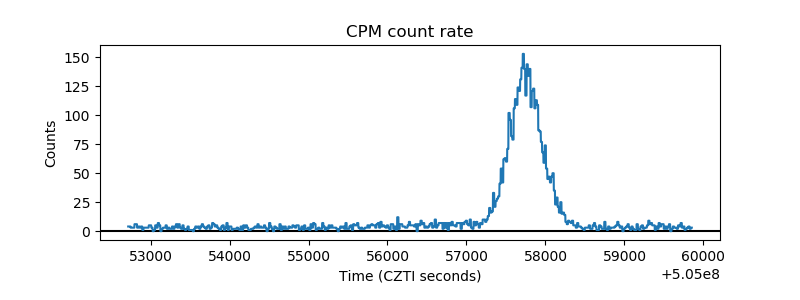 |
| CZT Counter | 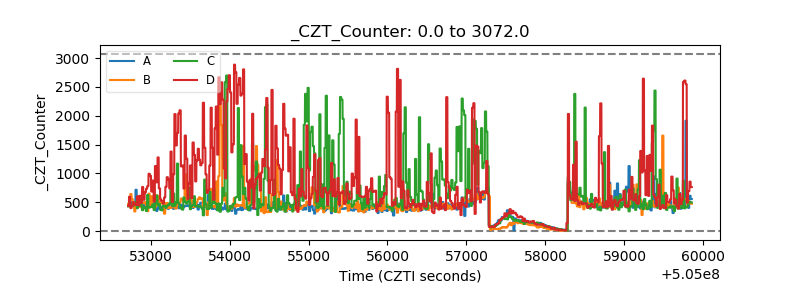 |
| +2.5 Volts monitor |  |
| +5 Volts monitor |  |
| _ROLL_ROT | 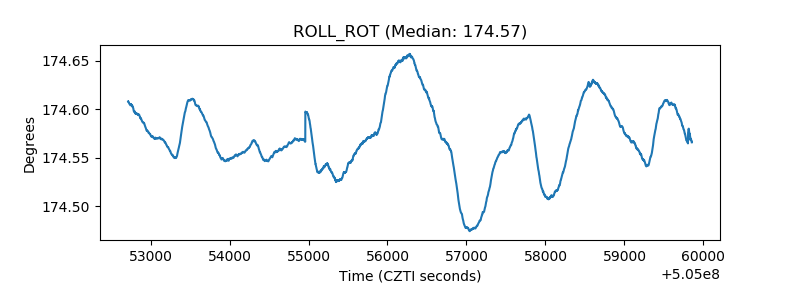 |
| _Roll_DEC | 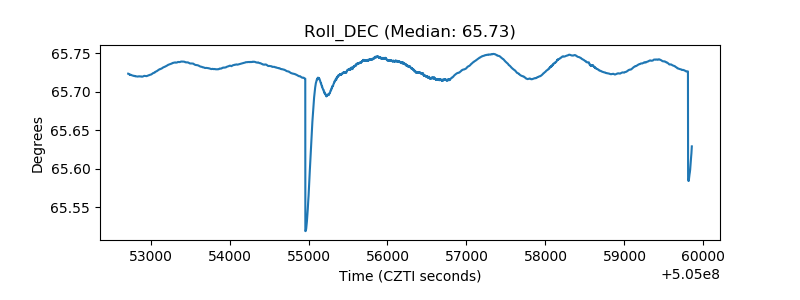 |
| _Roll_RA | 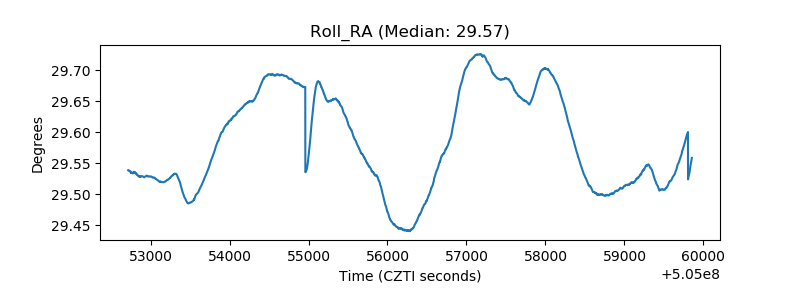 |
| Veto Counter | 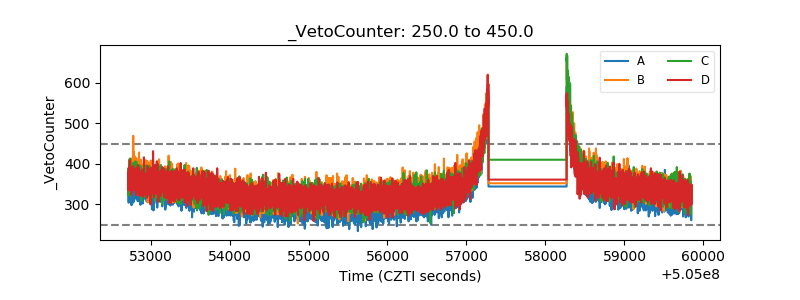 |