| Param | Original file | Final file |
|---|---|---|
| Filename | modeM0/AS1A14_099T01_9000006536_55537cztM0_level2.fits | modeM0/AS1A14_099T01_9000006536_55537cztM0_level2_quad_clean.evt |
| Size (bytes) | 539,884,800 | 108,878,400 |
| Size | 514.9 MB | 103.8 MB |
| Events in quadrant A | 3,838,169 | 727,365 |
| Events in quadrant B | 3,911,482 | 770,343 |
| Events in quadrant C | 3,809,463 | 684,333 |
| Events in quadrant D | 7,828,307 | 579,464 |
| Mode SS | |||
|---|---|---|---|
| Quadrant | BADHDUFLAG | Total packets | Discarded packets |
| A | 0 | 154 | 0 |
| B | 0 | 154 | 0 |
| C | 0 | 154 | 0 |
| D | 0 | 154 | 0 |
| Mode M0 | |||
|---|---|---|---|
| Quadrant | BADHDUFLAG | Total packets | Discarded packets |
| A | 0 | 17107 | 110 |
| B | 0 | 17529 | 111 |
| C | 0 | 17231 | 97 |
| D | 0 | 28747 | 151 |
| Quadrant | Total seconds | Saturated seconds | Saturation percentage |
|---|---|---|---|
| A | 7693 | 87 | 1.130898% |
| B | 7692 | 160 | 2.080083% |
| C | 7695 | 91 | 1.182586% |
| D | 7687 | 1054 | 13.711461% |
Noise dominated data is calculated using 1-second bins in cleaned event files. If a bin has >2000 counts, and if more than 50% of those come from <1% of pixels, then it is considered to be noise-dominated and hence unusable.
| Quadrant | # 1 sec bins | Bins with >0 counts | Bins with >2000 counts | High rate bins dominated by noise | Noise dominated (total time) | Noise dominated (detector-on time) | Marked lightcurve |
|---|---|---|---|---|---|---|---|
| A | 7704 | 7703 | 49 | 49 | 0.64% | 0.64% | 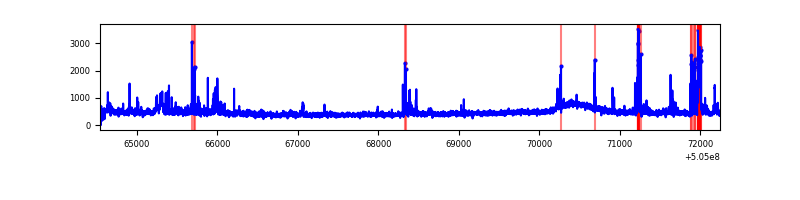 |
| B | 7706 | 7698 | 83 | 83 | 1.08% | 1.08% | 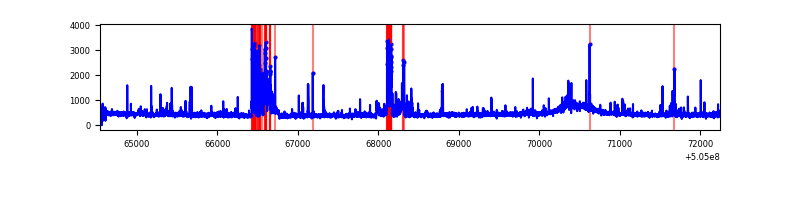 |
| C | 7707 | 7701 | 29 | 29 | 0.38% | 0.38% | 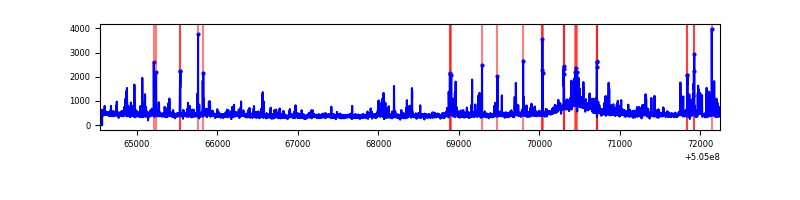 |
| D | 7704 | 7698 | 990 | 990 | 12.85% | 12.86% | 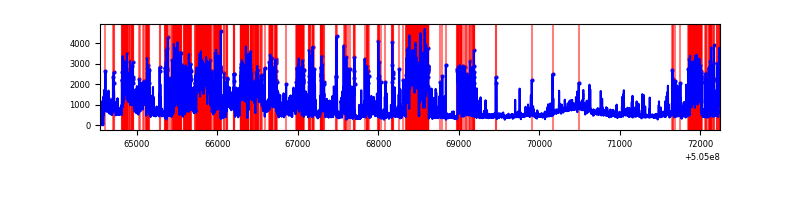 |
Top three noisy pixels from each quadrant. If the there are fewer than three noisy pixels in the level2.evt file, extra rows are filled as -1
| Pixel properties | Quadrant properties | ||||||
|---|---|---|---|---|---|---|---|
| Quadrant | DetID | PixID | Counts | Sigma | Mean | Median | Sigma |
| A | 0 | 8 | 249137 | 1201.46 | 830 | 807 | 206.7 |
| A | 3 | 14 | 131048 | 630.13 | 830 | 807 | 206.7 |
| A | 4 | 205 | 70520 | 337.28 | 830 | 807 | 206.7 |
| B | 4 | 206 | 484686 | 2772.21 | 814 | 783 | 174.6 |
| B | 0 | 171 | 63675 | 360.3 | 814 | 783 | 174.6 |
| B | 10 | 247 | 52081 | 293.88 | 814 | 783 | 174.6 |
| C | 15 | 178 | 126237 | 577.8 | 807 | 799 | 217.1 |
| C | 13 | 3 | 121413 | 555.58 | 807 | 799 | 217.1 |
| C | 14 | 254 | 91327 | 417.0 | 807 | 799 | 217.1 |
| D | 11 | 129 | 3521317 | 16052.56 | 774 | 740 | 219.3 |
| D | 6 | 239 | 516175 | 2350.2 | 774 | 740 | 219.3 |
| D | 8 | 245 | 187931 | 853.52 | 774 | 740 | 219.3 |
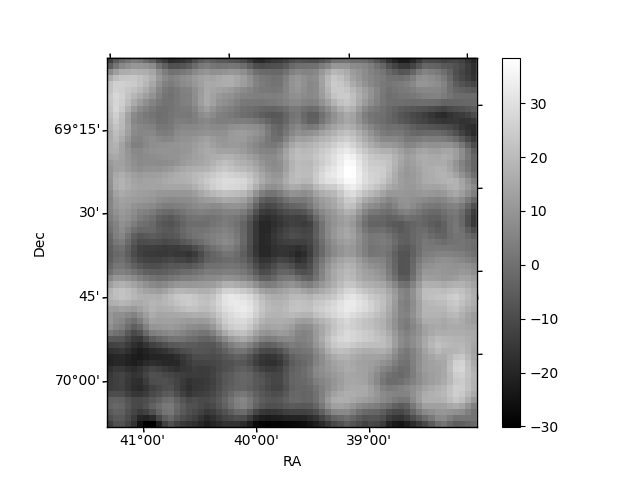
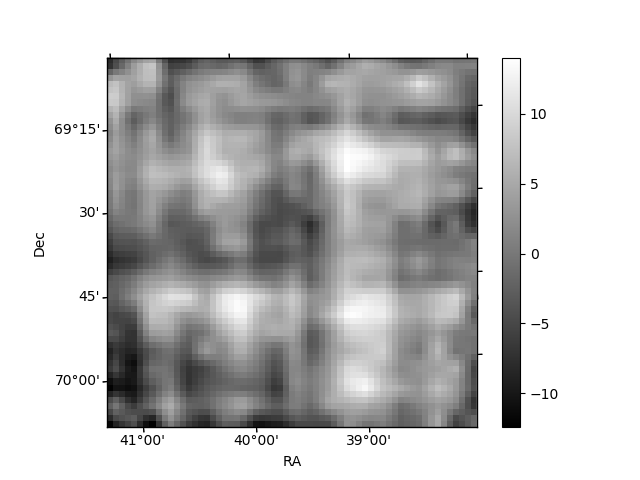
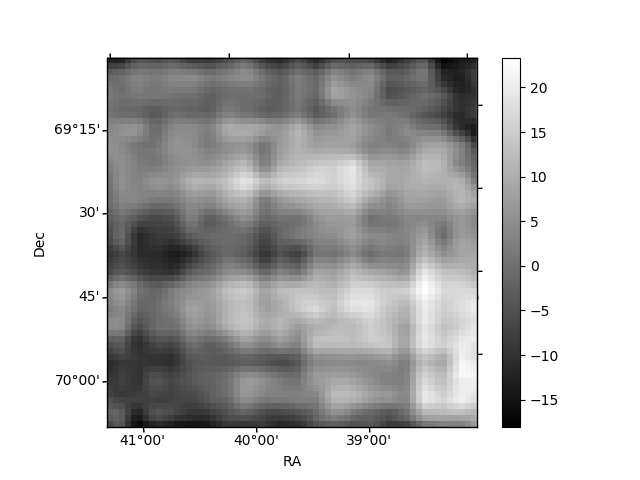
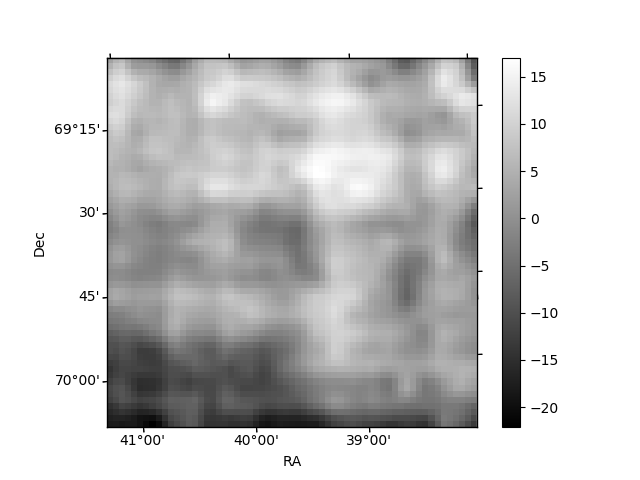
Histogram calculated using DETX and DETY for each event in the final _common_clean file
| Quadrant A | 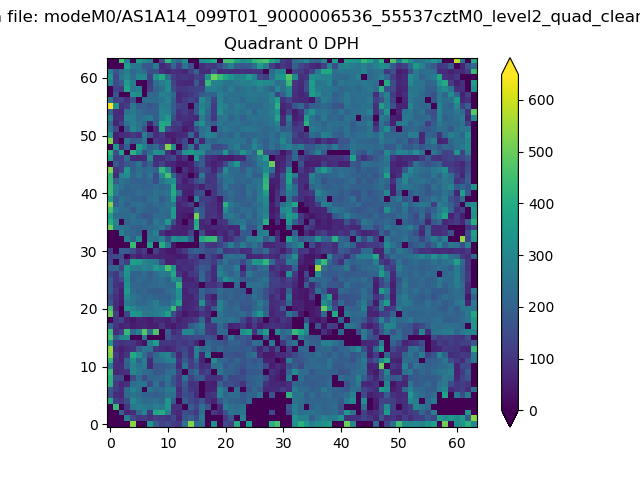 |
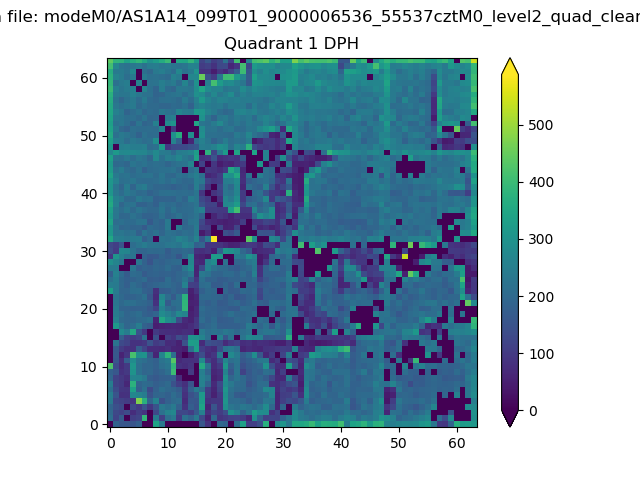 |
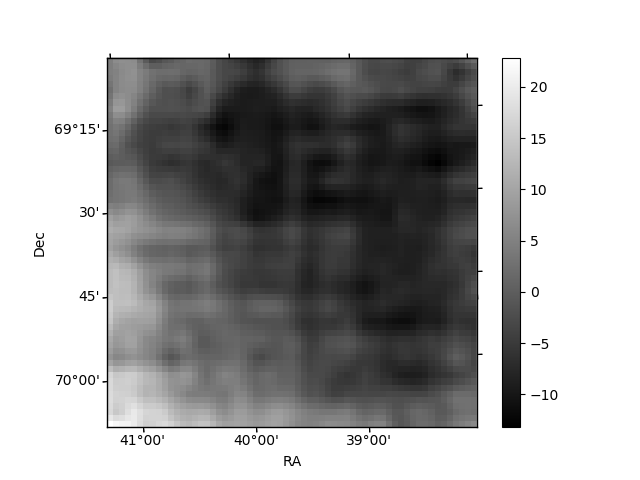
Quadrant B |
|---|---|---|---|
| Quadrant D | 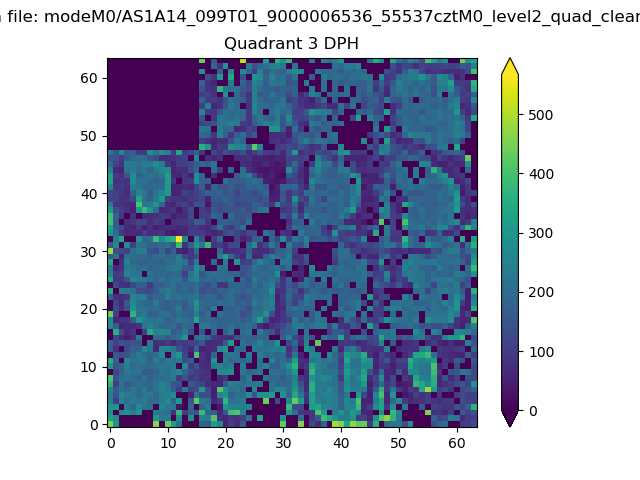 |
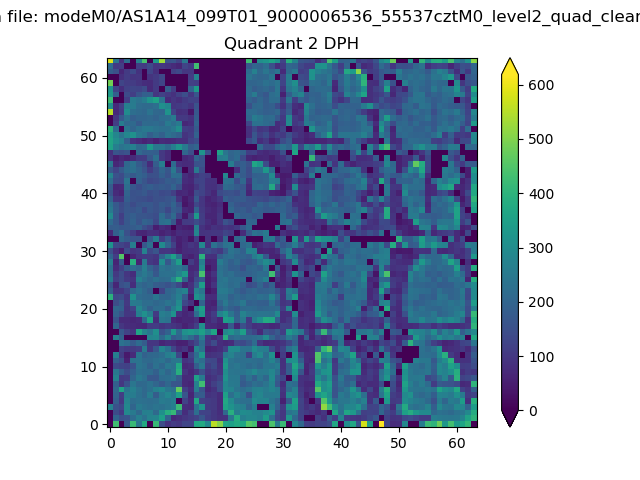 |
Quadrant C |
| Plot type | Count rate plots | Images |
|---|---|---|
| Comparison with Poisson distribution Blue bars denote a histogram of data divided into 1 sec bins. Red curve is a Poisson curve with rate = median count rate of data. |
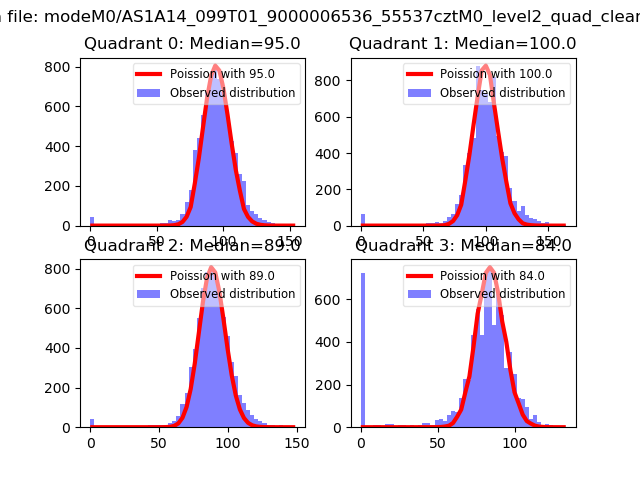 |
 |
| Quadrant-wise count rates Data is divided into 100 sec bins |
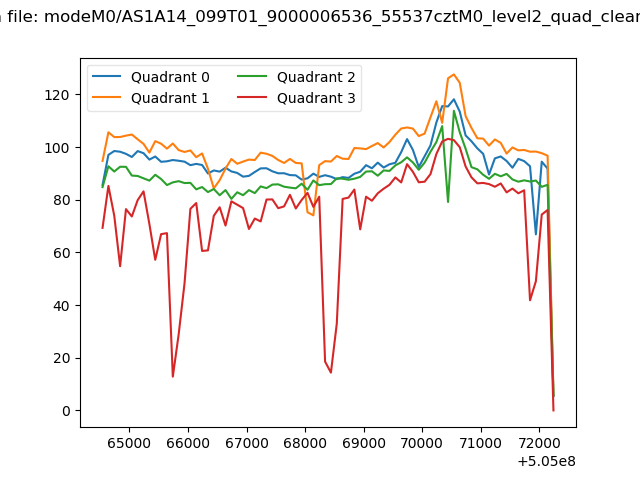 |
|
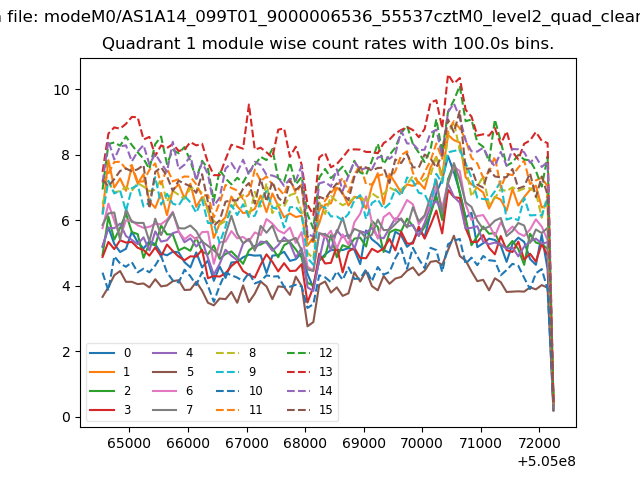
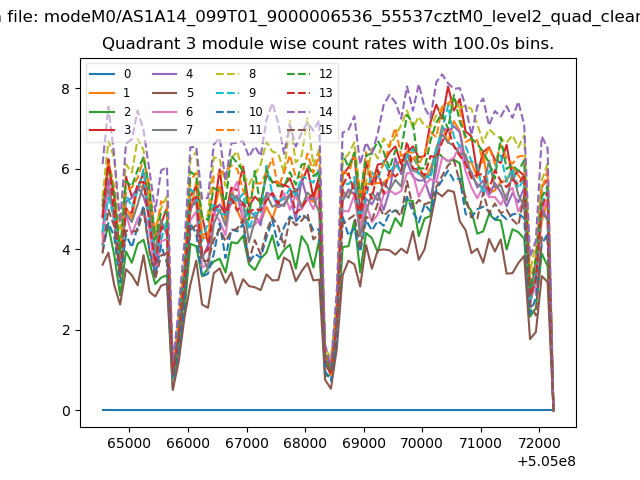
| Module-wise count rates for Quadrant A Data is divided into 100 sec bins |
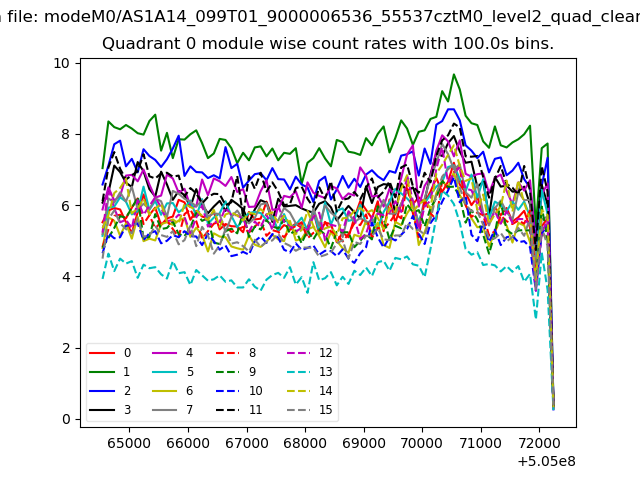 |
 |
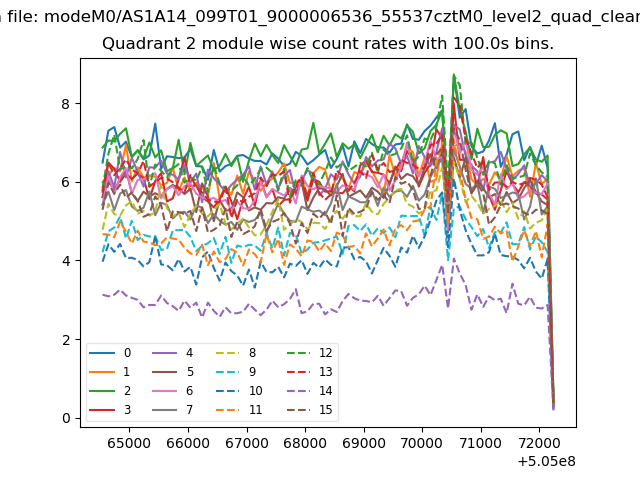
| Module-wise count rates for Quadrant B Data is divided into 100 sec bins |
 |
 |
| Module-wise count rates for Quadrant C Data is divided into 100 sec bins |
 |
 |
| Module-wise count rates for Quadrant D Data is divided into 100 sec bins |
 |
 |
| Parameter | Plot |
|---|---|
| CZT HV Monitor | 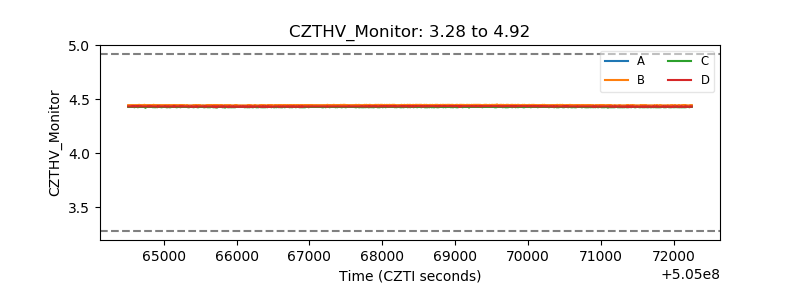 |
| D_VDD | 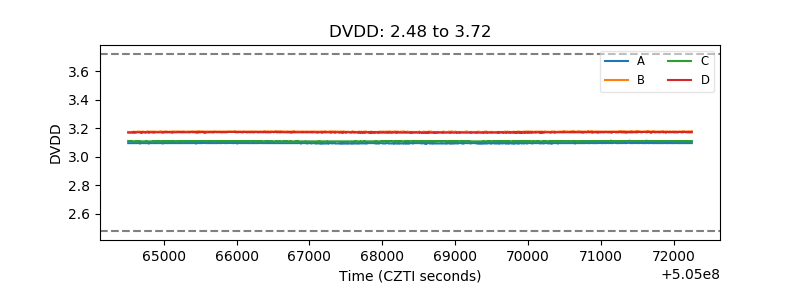 |
| Temperature 1 | 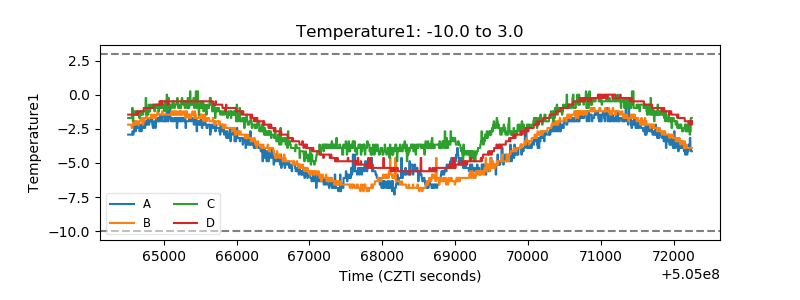 |
| Veto HV Monitor | 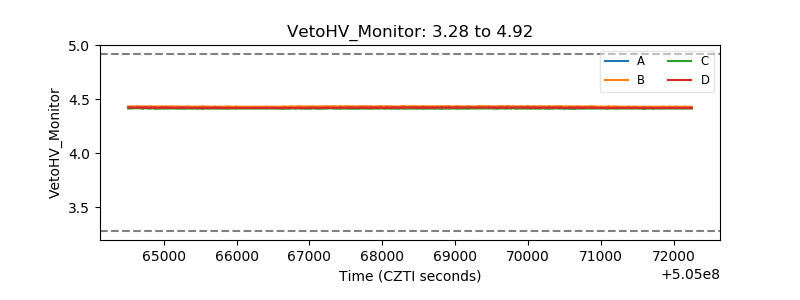 |
| Veto LLD | 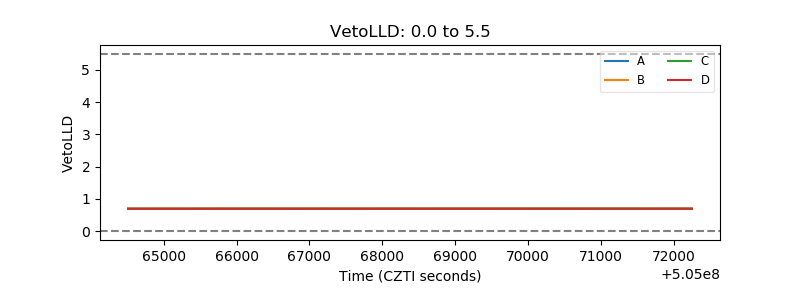 |
| Alpha Counter | 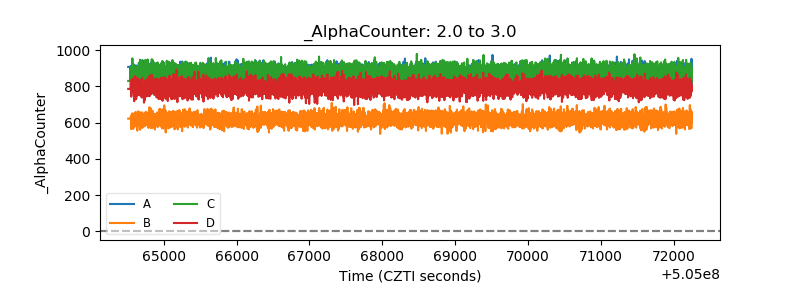 |
| _CPM_Rate | 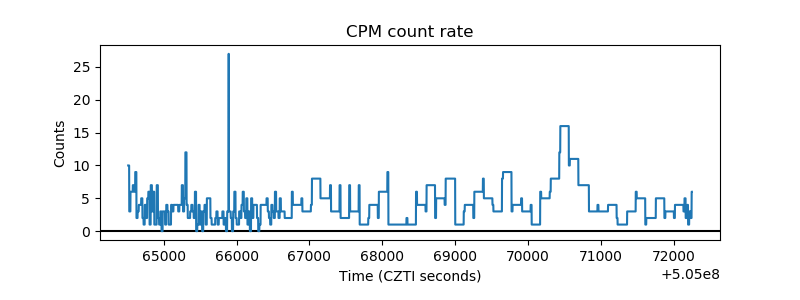 |
| CZT Counter | 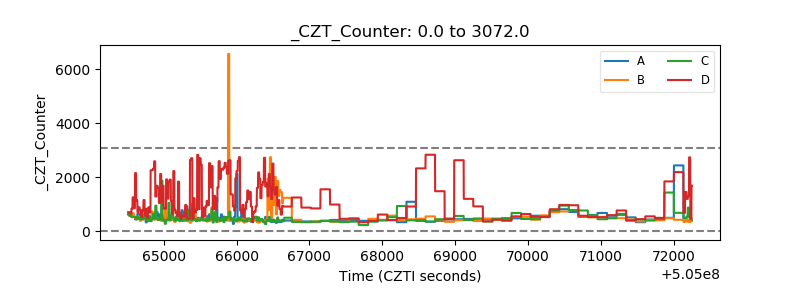 |
| +2.5 Volts monitor |  |
| +5 Volts monitor | 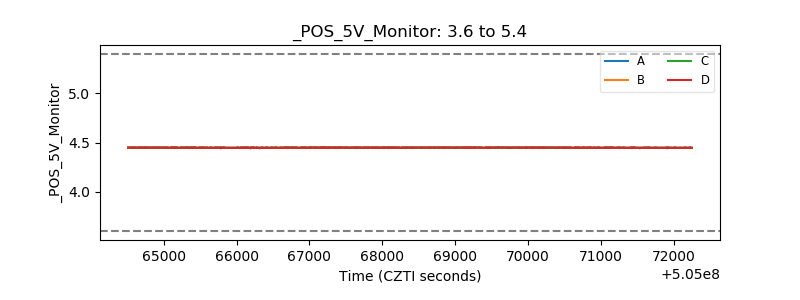 |
| _ROLL_ROT | 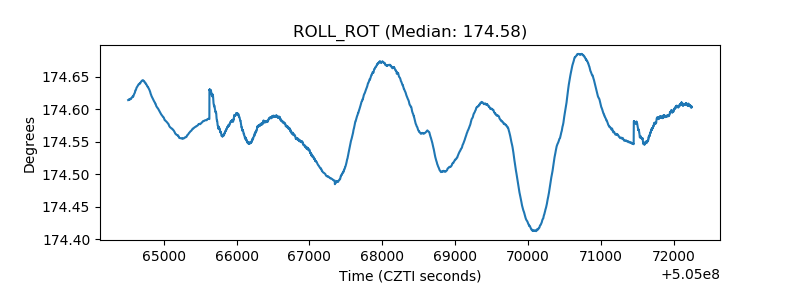 |
| _Roll_DEC | 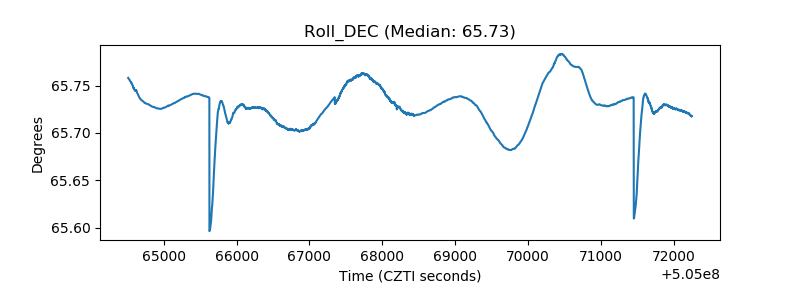 |
| _Roll_RA | 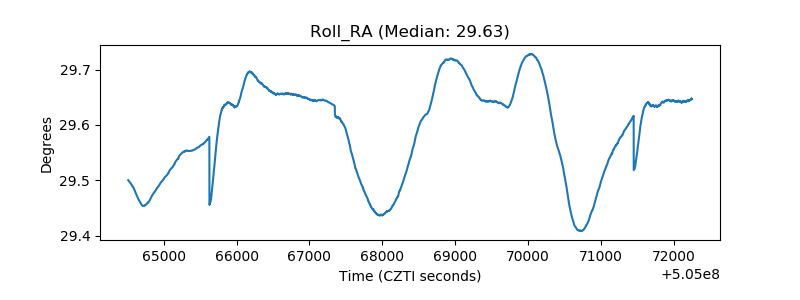 |
| Veto Counter | 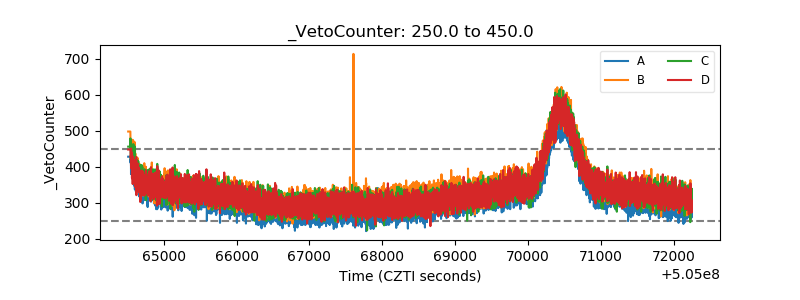 |