| Param | Original file | Final file |
|---|---|---|
| Filename | modeM0/AS1A14_099T01_9000006536_55539cztM0_level2.fits | modeM0/AS1A14_099T01_9000006536_55539cztM0_level2_quad_clean.evt |
| Size (bytes) | 457,799,040 | 97,381,440 |
| Size | 436.6 MB | 92.9 MB |
| Events in quadrant A | 3,560,468 | 638,878 |
| Events in quadrant B | 3,229,225 | 684,528 |
| Events in quadrant C | 4,152,645 | 601,201 |
| Events in quadrant D | 5,469,106 | 544,703 |
| Mode SS | |||
|---|---|---|---|
| Quadrant | BADHDUFLAG | Total packets | Discarded packets |
| A | 0 | 136 | 0 |
| B | 0 | 136 | 0 |
| C | 0 | 138 | 0 |
| D | 0 | 138 | 0 |
| Mode M0 | |||
|---|---|---|---|
| Quadrant | BADHDUFLAG | Total packets | Discarded packets |
| A | 0 | 15632 | 0 |
| B | 0 | 14883 | 0 |
| C | 0 | 17176 | 0 |
| D | 0 | 21129 | 0 |
| Quadrant | Total seconds | Saturated seconds | Saturation percentage |
|---|---|---|---|
| A | 6881 | 108 | 1.569539% |
| B | 6881 | 54 | 0.784770% |
| C | 6881 | 144 | 2.092719% |
| D | 6882 | 554 | 8.049985% |
Noise dominated data is calculated using 1-second bins in cleaned event files. If a bin has >2000 counts, and if more than 50% of those come from <1% of pixels, then it is considered to be noise-dominated and hence unusable.
| Quadrant | # 1 sec bins | Bins with >0 counts | Bins with >2000 counts | High rate bins dominated by noise | Noise dominated (total time) | Noise dominated (detector-on time) | Marked lightcurve |
|---|---|---|---|---|---|---|---|
| A | 6881 | 6881 | 82 | 82 | 1.19% | 1.19% | 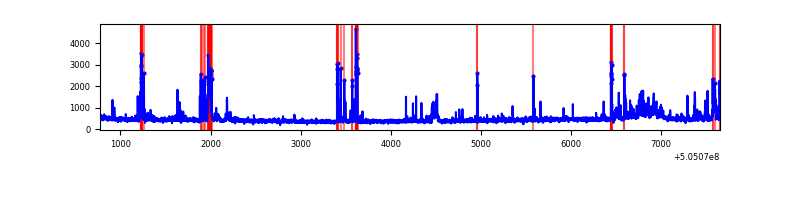 |
| B | 6881 | 6881 | 35 | 35 | 0.51% | 0.51% | 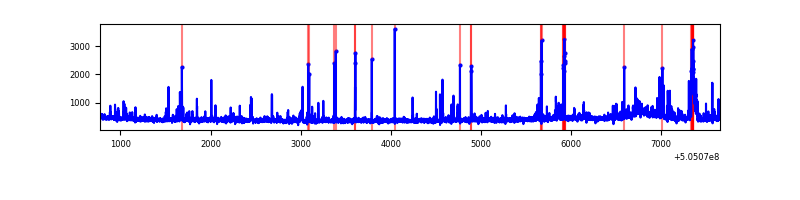 |
| C | 6881 | 6881 | 116 | 116 | 1.69% | 1.69% | 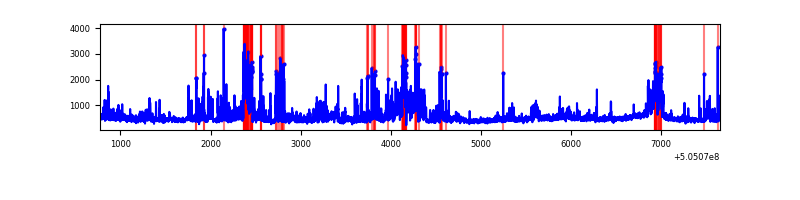 |
| D | 6882 | 6882 | 497 | 497 | 7.22% | 7.22% | 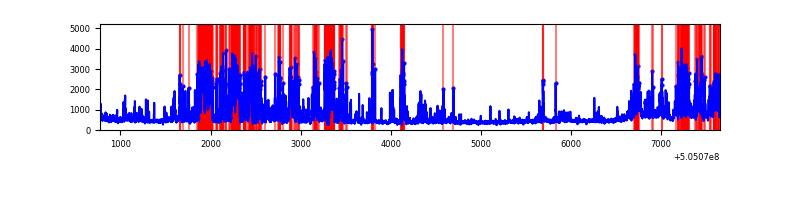 |
Top three noisy pixels from each quadrant. If the there are fewer than three noisy pixels in the level2.evt file, extra rows are filled as -1
| Pixel properties | Quadrant properties | ||||||
|---|---|---|---|---|---|---|---|
| Quadrant | DetID | PixID | Counts | Sigma | Mean | Median | Sigma |
| A | 0 | 8 | 353043 | 1951.94 | 720 | 700 | 180.5 |
| A | 4 | 159 | 195474 | 1079.03 | 720 | 700 | 180.5 |
| A | 4 | 3 | 67053 | 367.59 | 720 | 700 | 180.5 |
| B | 0 | 171 | 88551 | 572.38 | 711 | 683 | 153.5 |
| B | 10 | 247 | 86036 | 555.99 | 711 | 683 | 153.5 |
| B | 5 | 236 | 70243 | 453.12 | 711 | 683 | 153.5 |
| C | 9 | 38 | 951620 | 4982.83 | 696 | 687 | 190.8 |
| C | 12 | 250 | 138502 | 722.14 | 696 | 687 | 190.8 |
| C | 13 | 3 | 91284 | 474.72 | 696 | 687 | 190.8 |
| D | 11 | 129 | 1780301 | 9132.76 | 684 | 653 | 194.9 |
| D | 6 | 239 | 493648 | 2529.94 | 684 | 653 | 194.9 |
| D | 2 | 31 | 94953 | 483.93 | 684 | 653 | 194.9 |
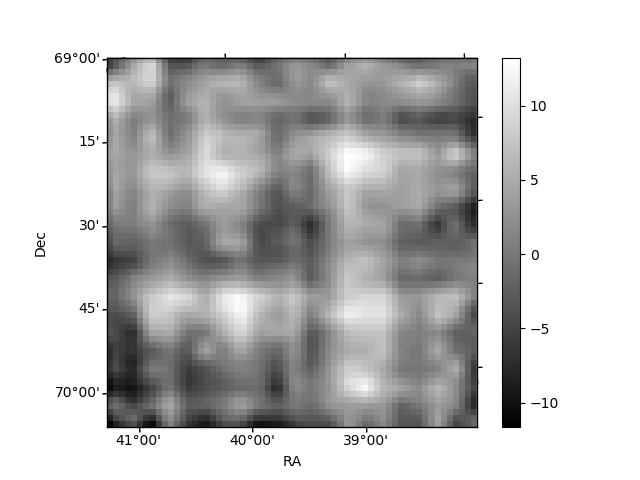
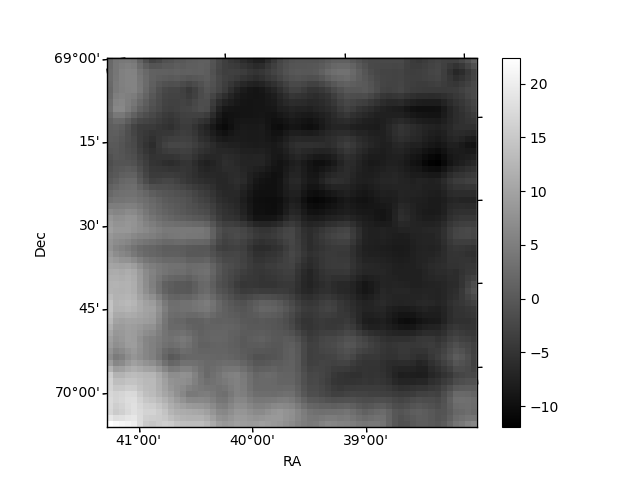
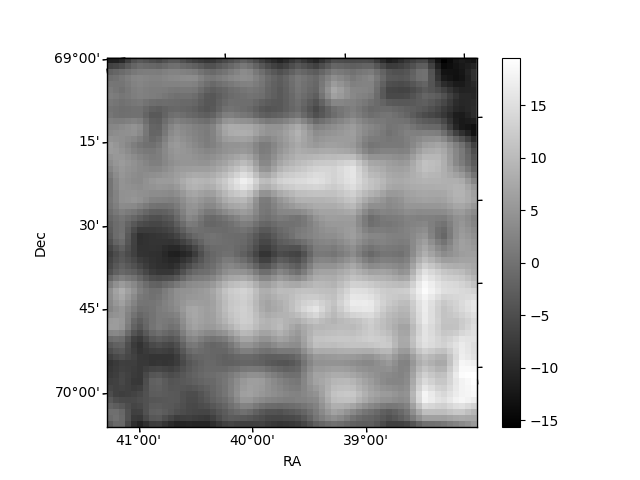
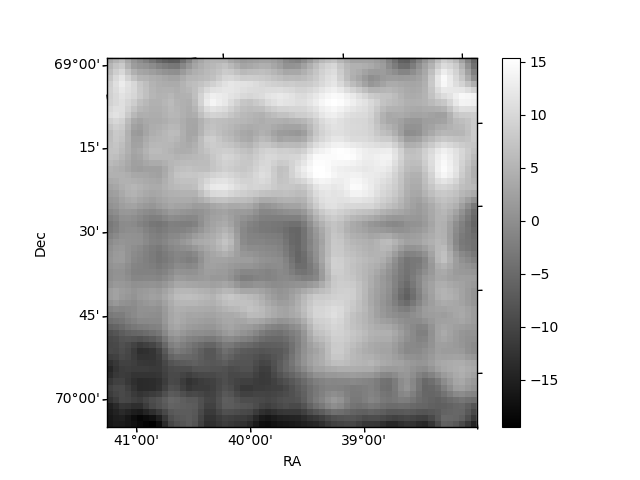
Histogram calculated using DETX and DETY for each event in the final _common_clean file
| Quadrant A | 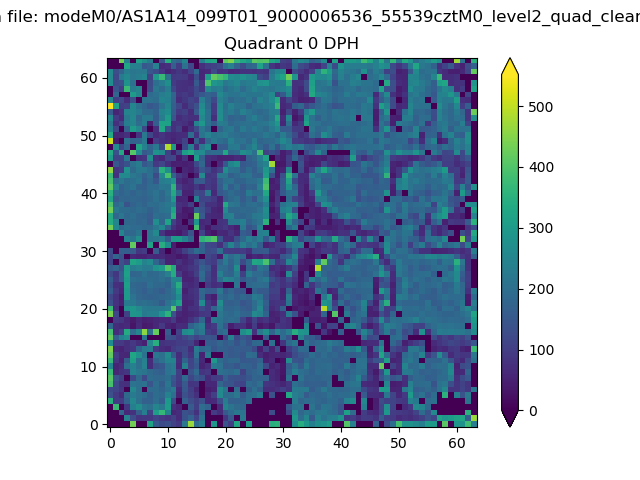 |
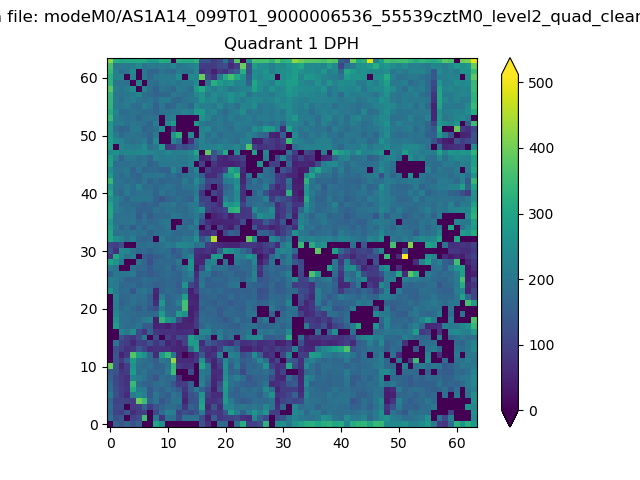 |
Quadrant B |
|---|---|---|---|
| Quadrant D | 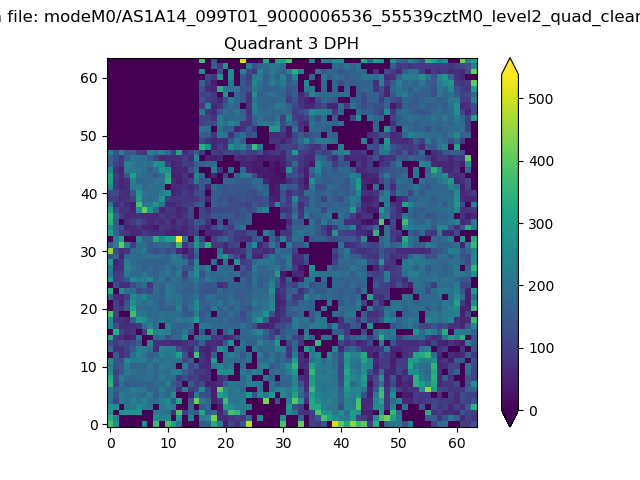 |
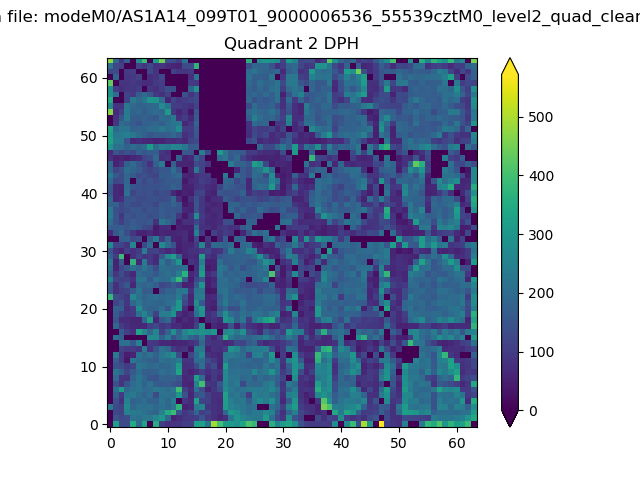 |
Quadrant C |
| Plot type | Count rate plots | Images |
|---|---|---|
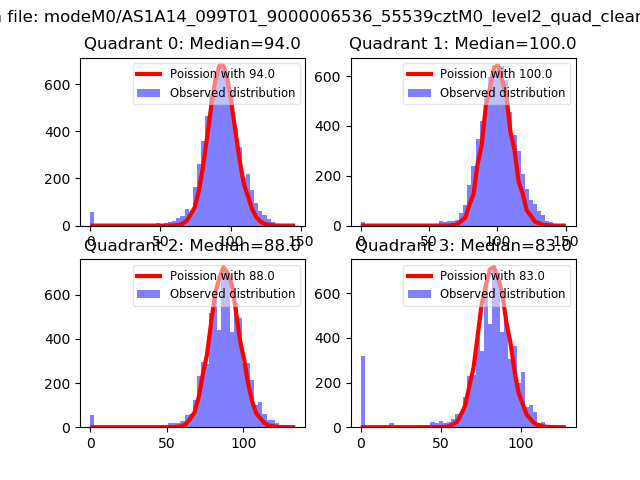
| Comparison with Poisson distribution Blue bars denote a histogram of data divided into 1 sec bins. Red curve is a Poisson curve with rate = median count rate of data. |
 |
 |
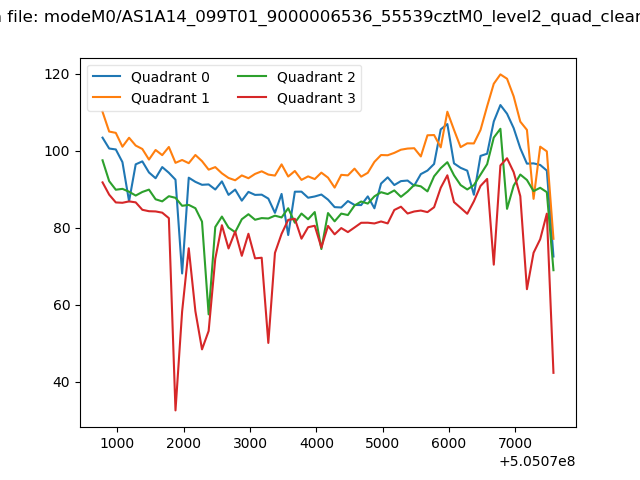
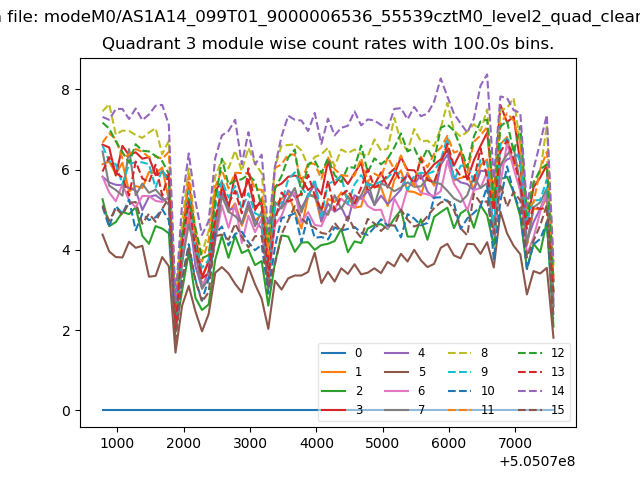
| Quadrant-wise count rates Data is divided into 100 sec bins |
 |
|
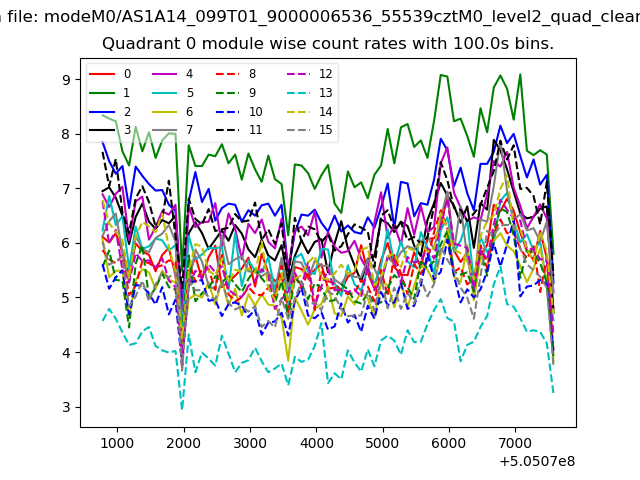
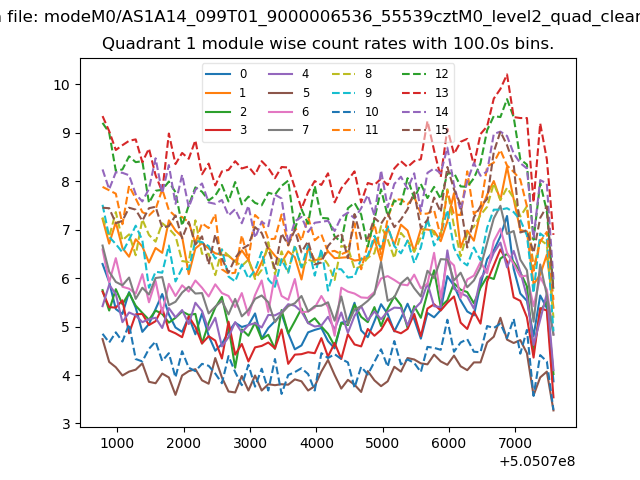
| Module-wise count rates for Quadrant A Data is divided into 100 sec bins |
 |
 |
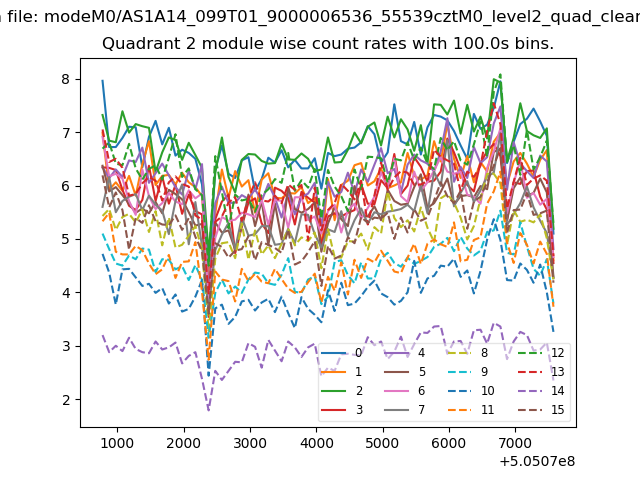
| Module-wise count rates for Quadrant B Data is divided into 100 sec bins |
 |
 |
| Module-wise count rates for Quadrant C Data is divided into 100 sec bins |
 |
 |
| Module-wise count rates for Quadrant D Data is divided into 100 sec bins |
 |
 |
| Parameter | Plot |
|---|---|
| CZT HV Monitor | 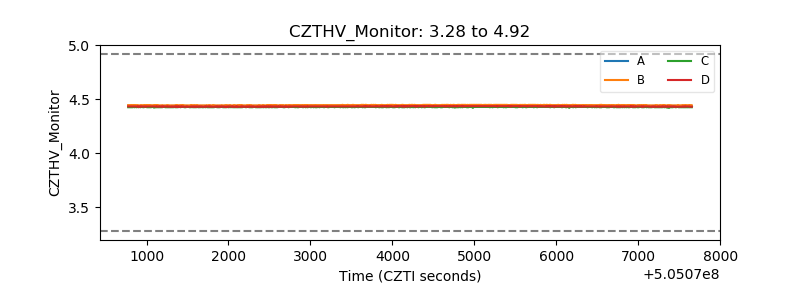 |
| D_VDD | 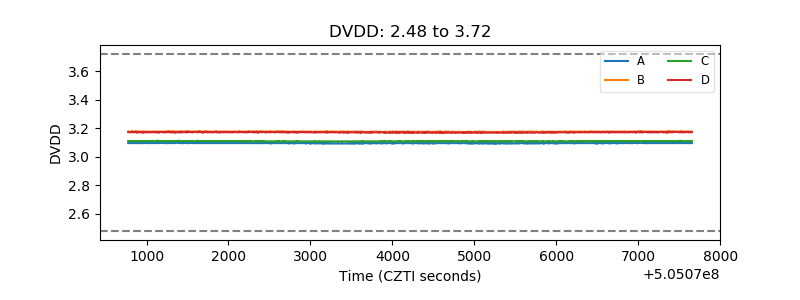 |
| Temperature 1 | 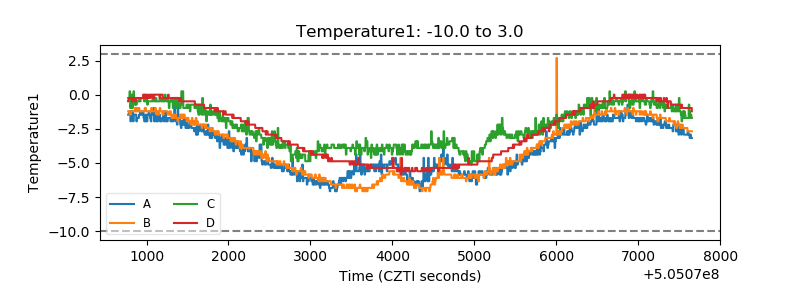 |
| Veto HV Monitor | 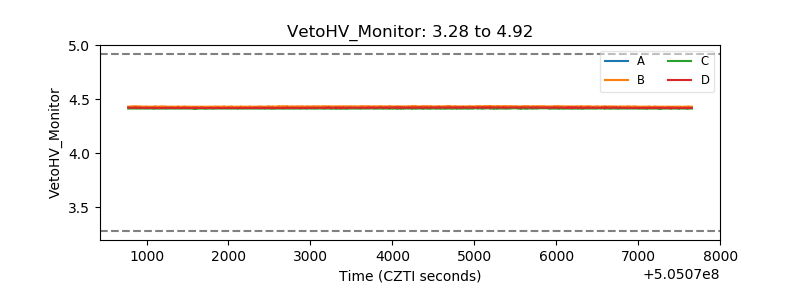 |
| Veto LLD | 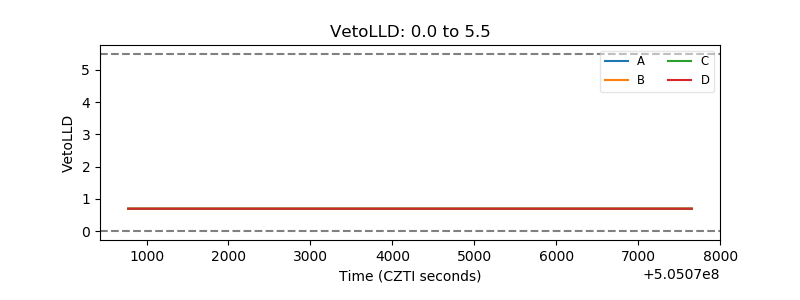 |
| Alpha Counter | 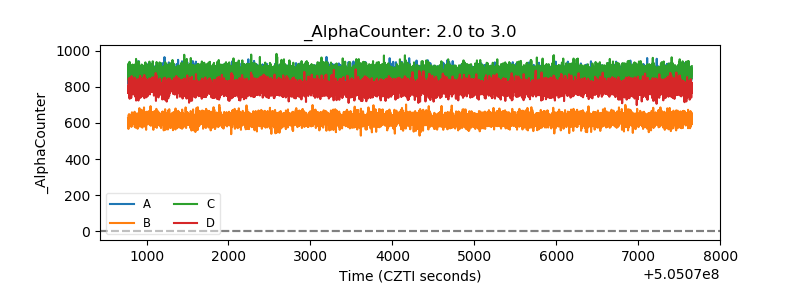 |
| _CPM_Rate | 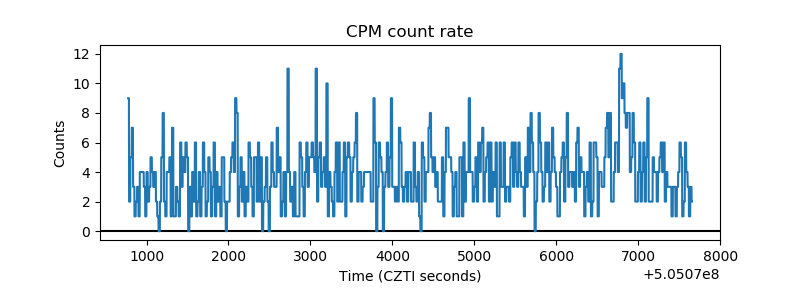 |
| CZT Counter | 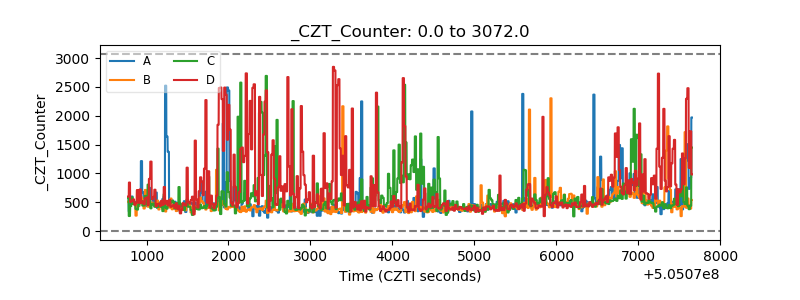 |
| +2.5 Volts monitor | 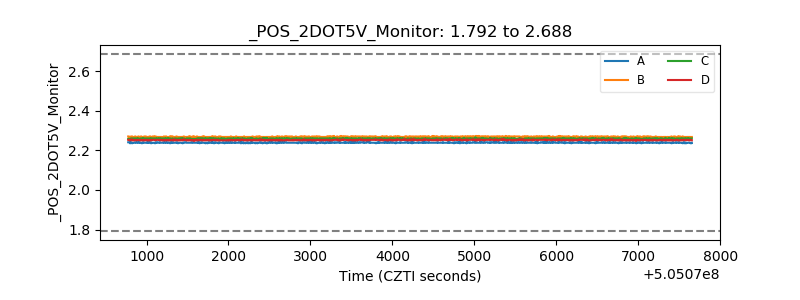 |
| +5 Volts monitor |  |
| _ROLL_ROT | 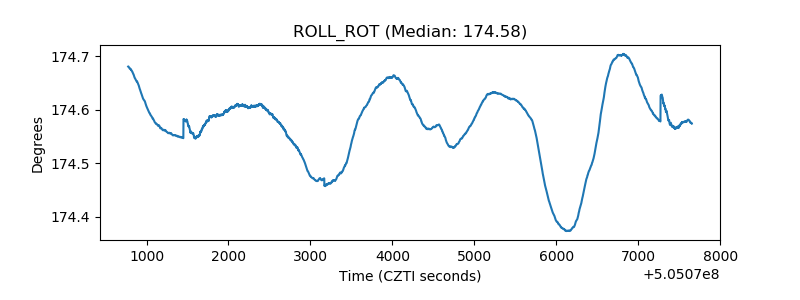 |
| _Roll_DEC | 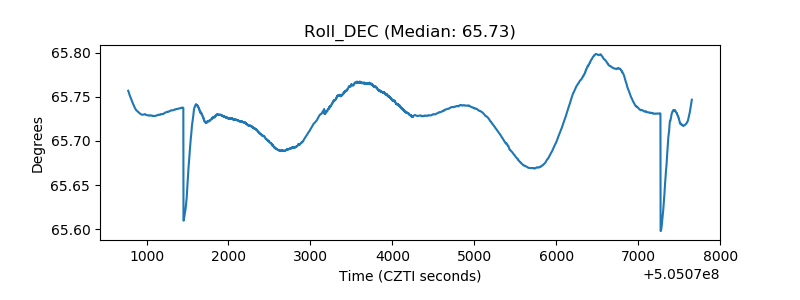 |
| _Roll_RA | 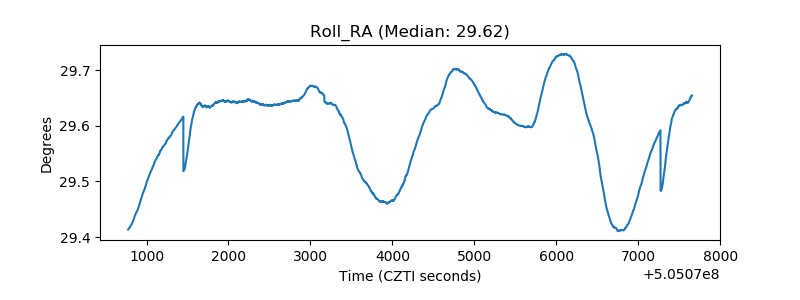 |
| Veto Counter | 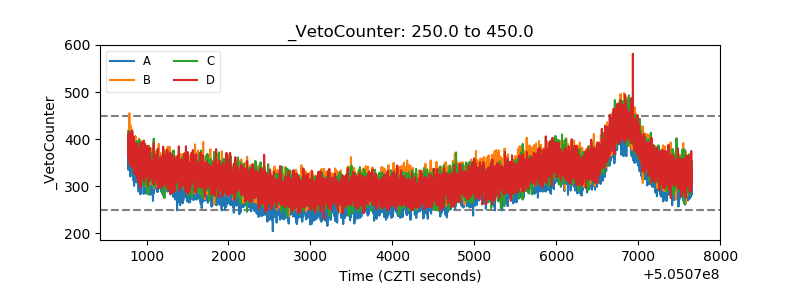 |