| Param | Original file | Final file |
|---|---|---|
| Filename | modeM0/AS1A14_021T06_9000006538_55539cztM0_level2.fits | modeM0/AS1A14_021T06_9000006538_55539cztM0_level2_quad_clean.evt |
| Size (bytes) | 501,984,000 | 94,887,360 |
| Size | 478.7 MB | 90.5 MB |
| Events in quadrant A | 3,644,555 | 636,786 |
| Events in quadrant B | 3,376,377 | 674,658 |
| Events in quadrant C | 5,491,601 | 546,162 |
| Events in quadrant D | 5,539,878 | 540,667 |
| Mode M0 | |||
|---|---|---|---|
| Quadrant | BADHDUFLAG | Total packets | Discarded packets |
| A | 0 | 16042 | 0 |
| B | 0 | 15185 | 8 |
| C | 0 | 21041 | 0 |
| D | 0 | 21305 | 0 |
| Mode SS | |||
|---|---|---|---|
| Quadrant | BADHDUFLAG | Total packets | Discarded packets |
| A | 0 | 136 | 0 |
| B | 0 | 136 | 0 |
| C | 0 | 136 | 0 |
| D | 0 | 136 | 0 |
| Quadrant | Total seconds | Saturated seconds | Saturation percentage |
|---|---|---|---|
| A | 6812 | 149 | 2.187317% |
| B | 6808 | 136 | 1.997650% |
| C | 6812 | 777 | 11.406342% |
| D | 6812 | 574 | 8.426307% |
Noise dominated data is calculated using 1-second bins in cleaned event files. If a bin has >2000 counts, and if more than 50% of those come from <1% of pixels, then it is considered to be noise-dominated and hence unusable.
| Quadrant | # 1 sec bins | Bins with >0 counts | Bins with >2000 counts | High rate bins dominated by noise | Noise dominated (total time) | Noise dominated (detector-on time) | Marked lightcurve |
|---|---|---|---|---|---|---|---|
| A | 6812 | 6812 | 100 | 100 | 1.47% | 1.47% | 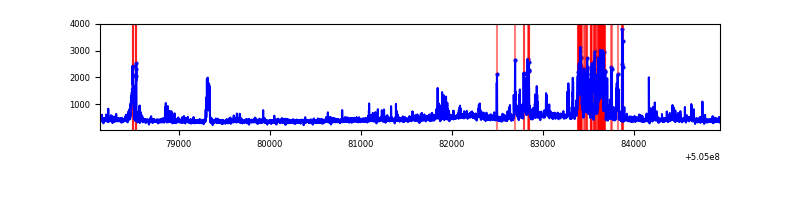 |
| B | 6812 | 6809 | 94 | 94 | 1.38% | 1.38% | 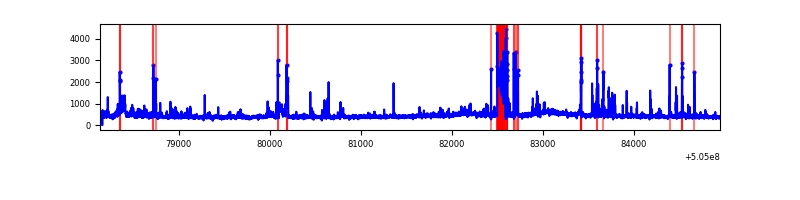 |
| C | 6812 | 6812 | 639 | 639 | 9.38% | 9.38% | 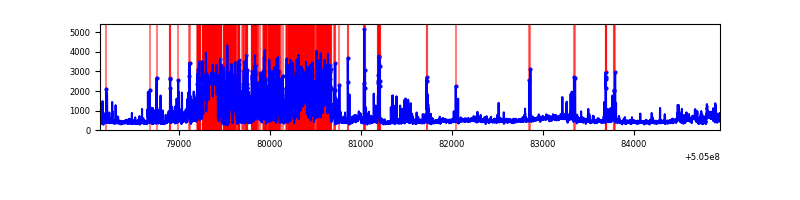 |
| D | 6812 | 6812 | 479 | 479 | 7.03% | 7.03% | 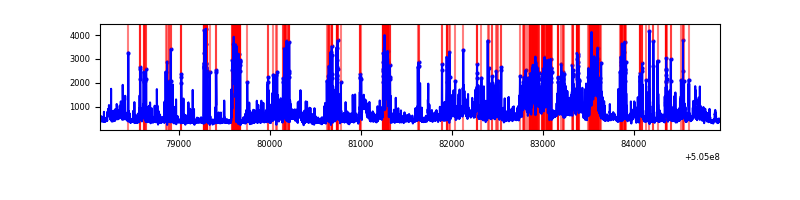 |
Top three noisy pixels from each quadrant. If the there are fewer than three noisy pixels in the level2.evt file, extra rows are filled as -1
| Pixel properties | Quadrant properties | ||||||
|---|---|---|---|---|---|---|---|
| Quadrant | DetID | PixID | Counts | Sigma | Mean | Median | Sigma |
| A | 4 | 159 | 591229 | 3389.14 | 699 | 682 | 174.2 |
| A | 7 | 14 | 98307 | 560.27 | 699 | 682 | 174.2 |
| A | 4 | 3 | 68407 | 388.67 | 699 | 682 | 174.2 |
| B | 4 | 206 | 276790 | 1842.3 | 693 | 667 | 149.9 |
| B | 0 | 171 | 123913 | 822.3 | 693 | 667 | 149.9 |
| B | 5 | 236 | 84174 | 557.16 | 693 | 667 | 149.9 |
| C | 15 | 148 | 2143788 | 11978.59 | 651 | 642 | 178.9 |
| C | 9 | 38 | 349322 | 1948.86 | 651 | 642 | 178.9 |
| C | 13 | 3 | 111238 | 618.15 | 651 | 642 | 178.9 |
| D | 11 | 129 | 1570777 | 8299.94 | 661 | 633 | 189.2 |
| D | 2 | 249 | 526725 | 2780.98 | 661 | 633 | 189.2 |
| D | 2 | 120 | 263063 | 1387.23 | 661 | 633 | 189.2 |
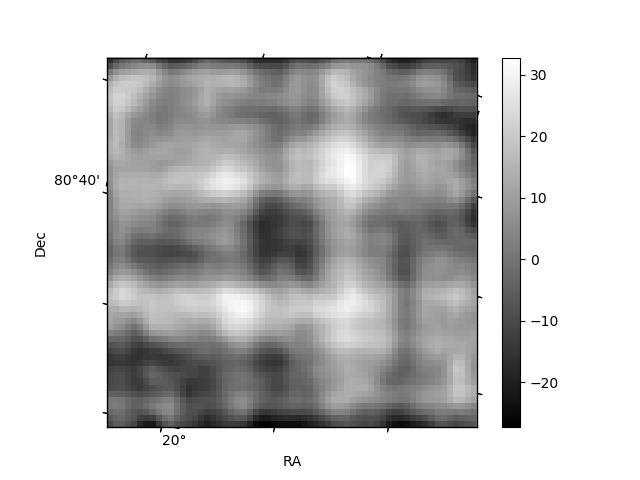
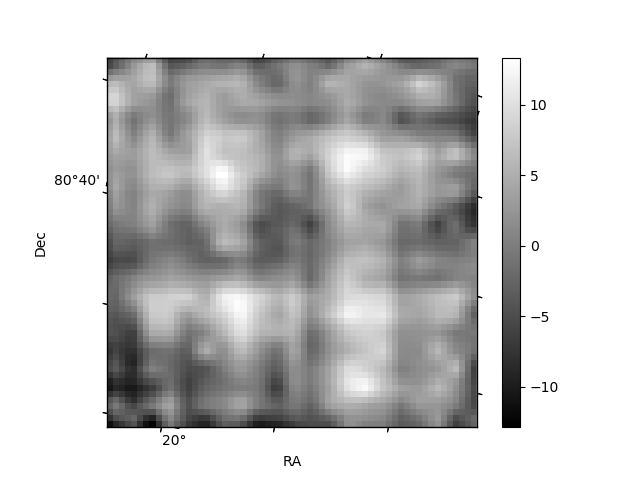
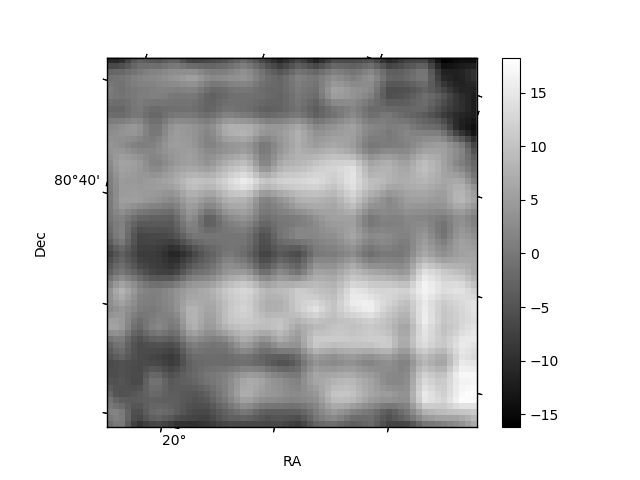
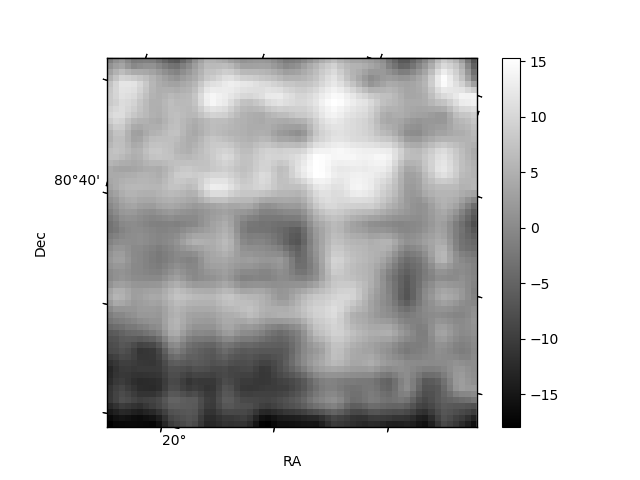
Histogram calculated using DETX and DETY for each event in the final _common_clean file
| Quadrant A | 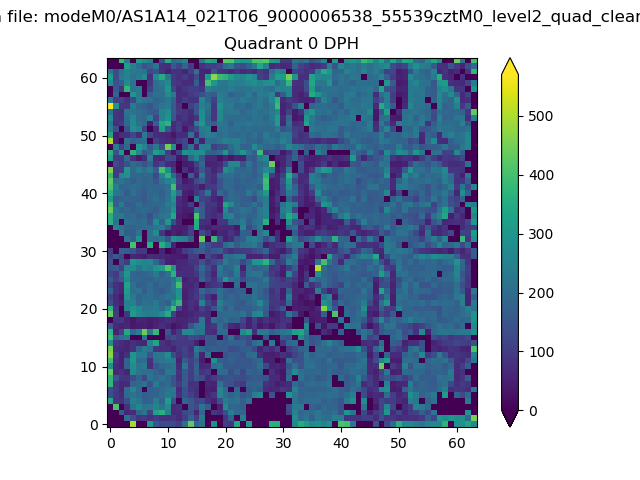 |
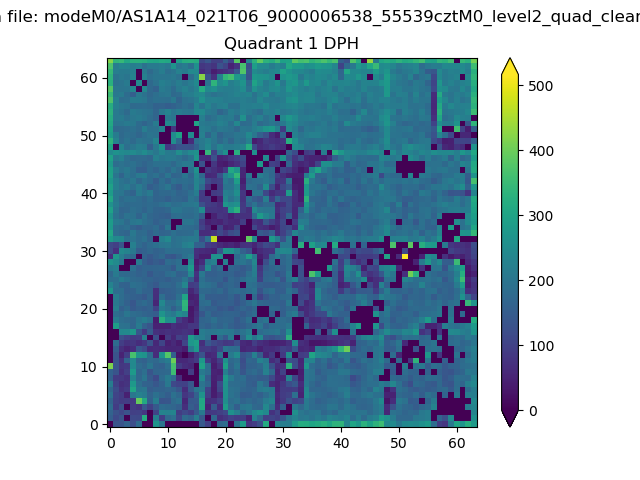 |
Quadrant B |
|---|---|---|---|
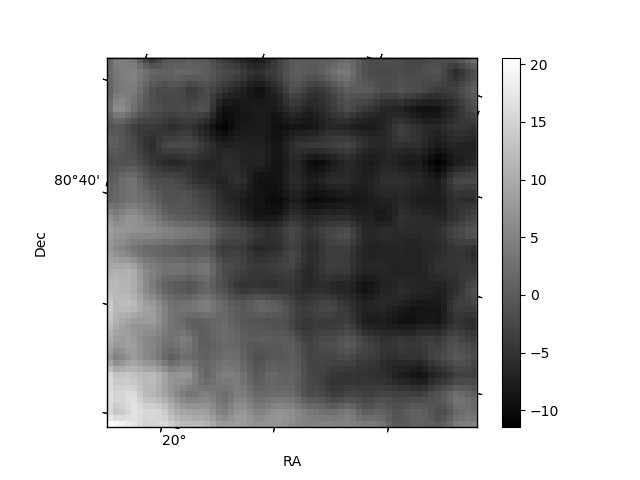
| Quadrant D | 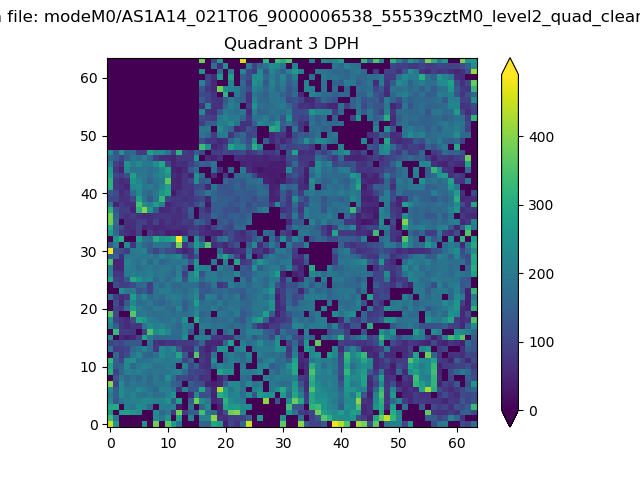 |
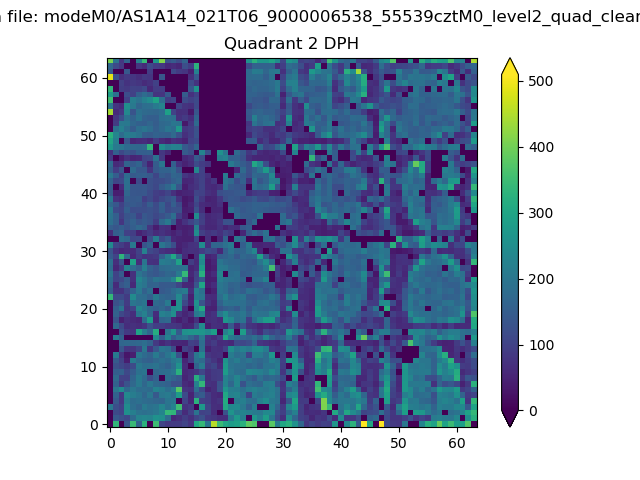 |
Quadrant C |
| Plot type | Count rate plots | Images |
|---|---|---|
| Comparison with Poisson distribution Blue bars denote a histogram of data divided into 1 sec bins. Red curve is a Poisson curve with rate = median count rate of data. |
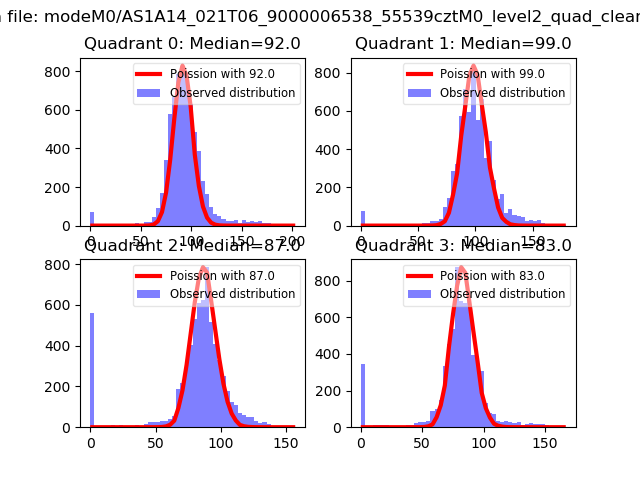 |
 |
| Quadrant-wise count rates Data is divided into 100 sec bins |
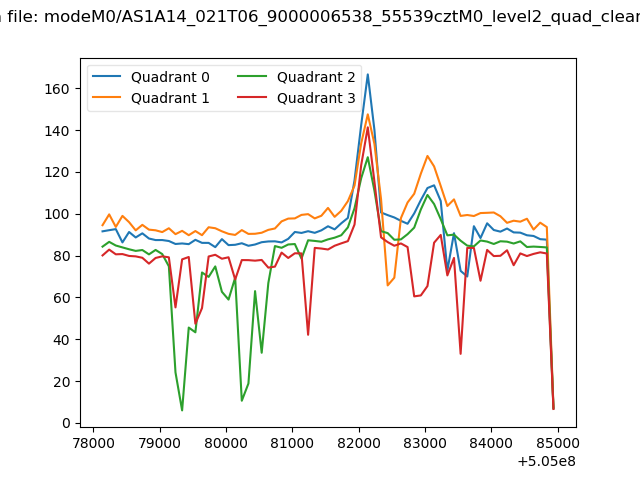 |
|
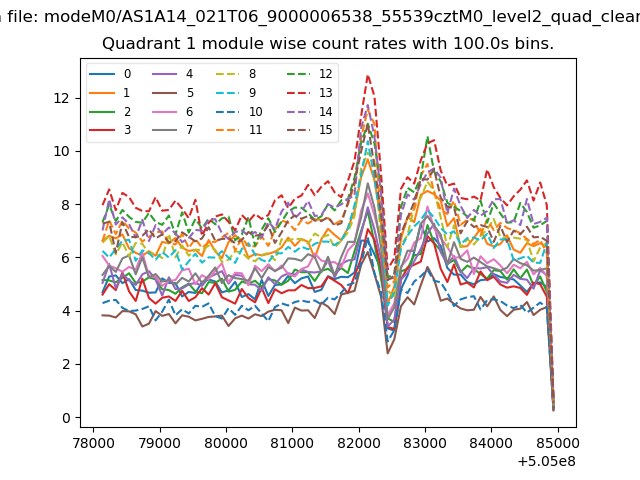
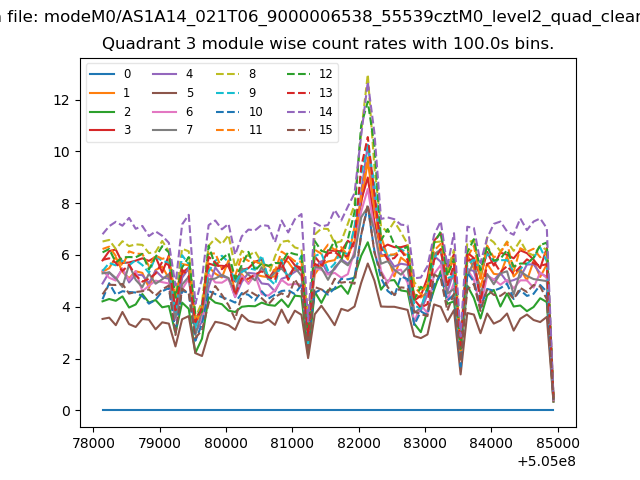
| Module-wise count rates for Quadrant A Data is divided into 100 sec bins |
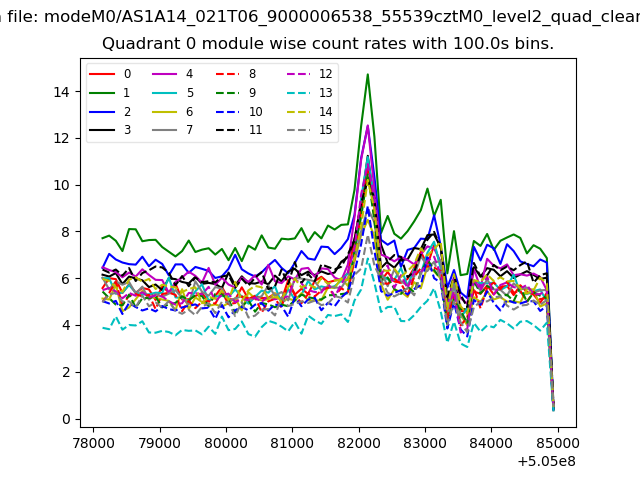 |
 |
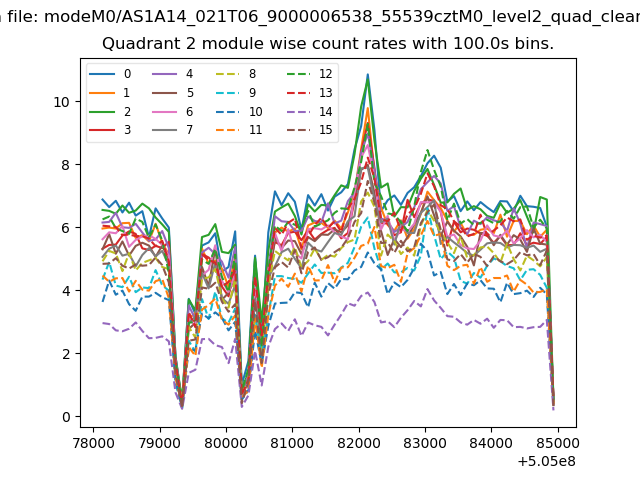
| Module-wise count rates for Quadrant B Data is divided into 100 sec bins |
 |
 |
| Module-wise count rates for Quadrant C Data is divided into 100 sec bins |
 |
 |
| Module-wise count rates for Quadrant D Data is divided into 100 sec bins |
 |
 |
| Parameter | Plot |
|---|---|
| CZT HV Monitor | 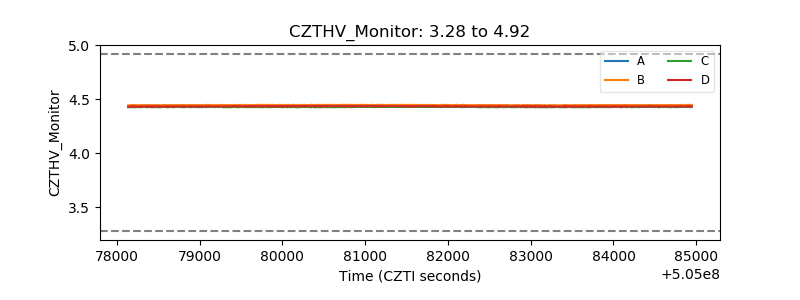 |
| D_VDD | 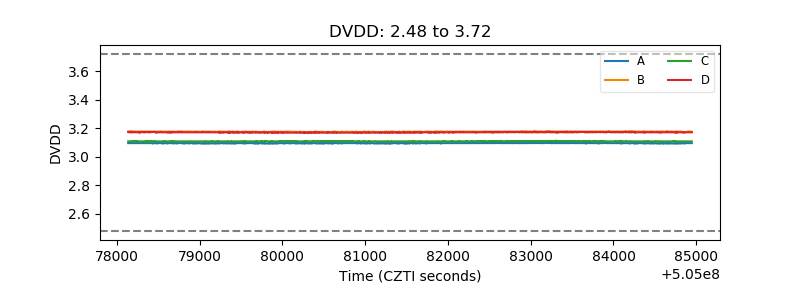 |
| Temperature 1 | 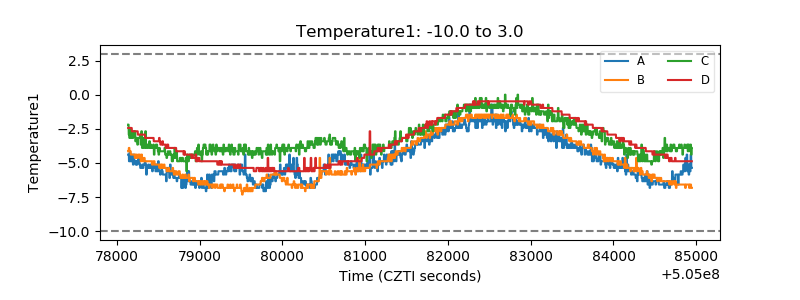 |
| Veto HV Monitor | 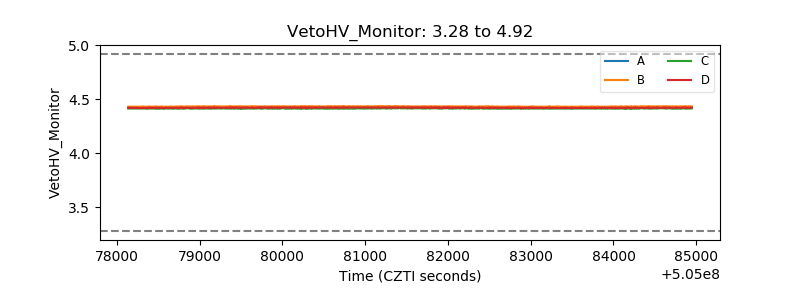 |
| Veto LLD | 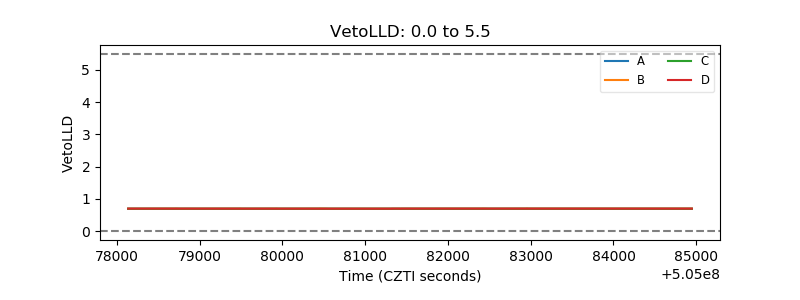 |
| Alpha Counter | 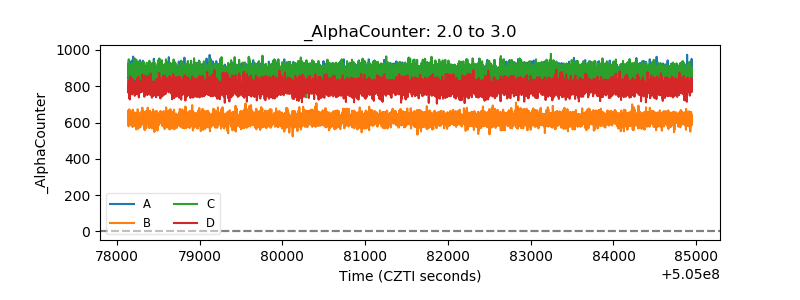 |
| _CPM_Rate | 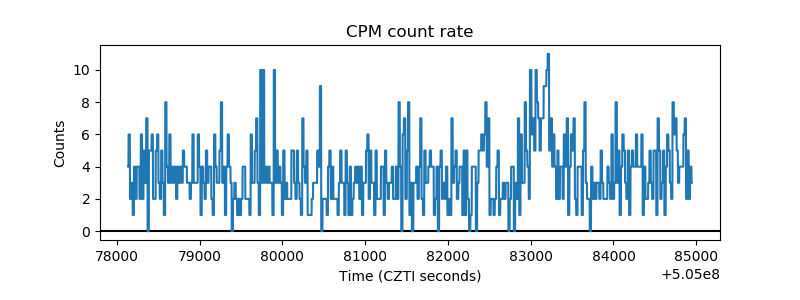 |
| CZT Counter | 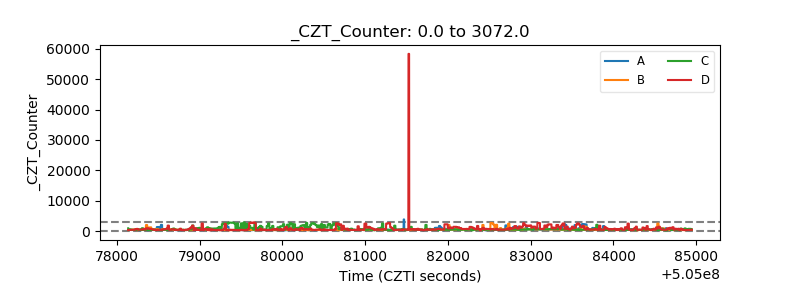 |
| +2.5 Volts monitor | 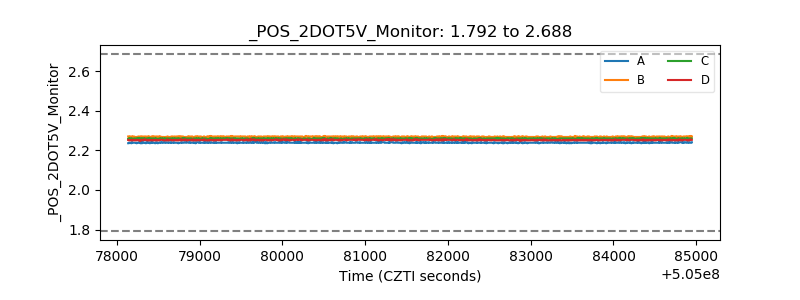 |
| +5 Volts monitor |  |
| _ROLL_ROT | 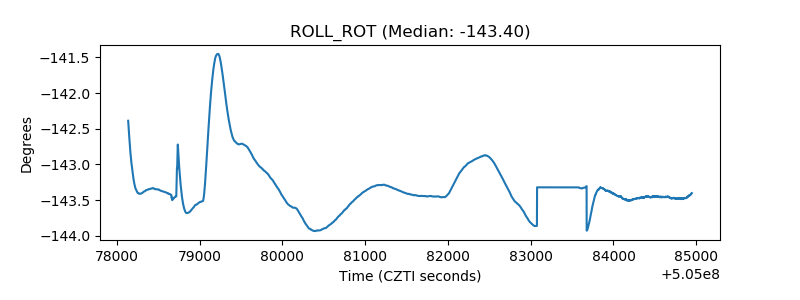 |
| _Roll_DEC | 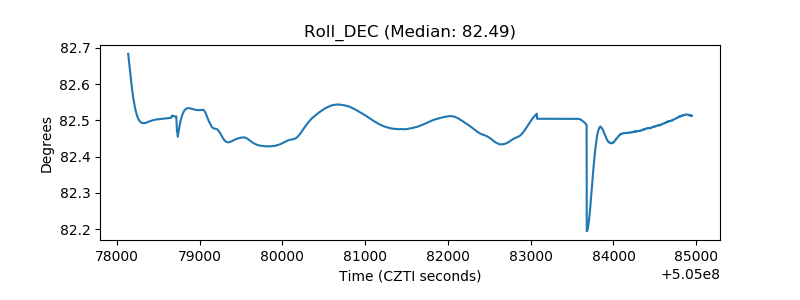 |
| _Roll_RA | 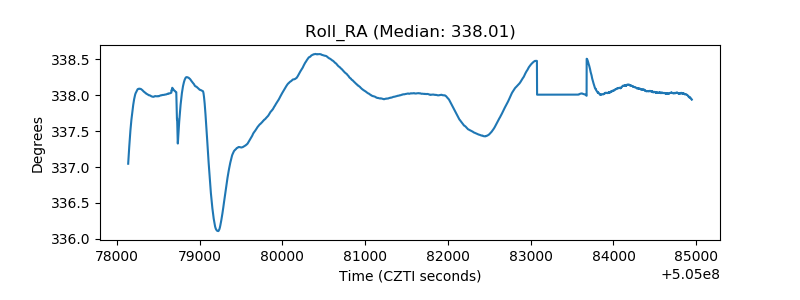 |
| Veto Counter | 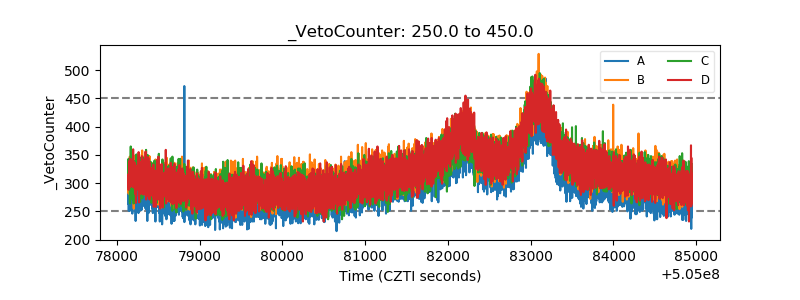 |