| Param | Original file | Final file |
|---|---|---|
| Filename | modeM0/AS1A14_021T06_9000006538_55542cztM0_level2.fits | modeM0/AS1A14_021T06_9000006538_55542cztM0_level2_quad_clean.evt |
| Size (bytes) | 1,223,087,040 | 279,325,440 |
| Size | 1.1 GB | 266.4 MB |
| Events in quadrant A | 9,916,027 | 1,807,267 |
| Events in quadrant B | 10,388,951 | 1,937,451 |
| Events in quadrant C | 10,891,354 | 1,738,014 |
| Events in quadrant D | 12,541,033 | 1,606,640 |
| Mode M9 | |||
|---|---|---|---|
| Quadrant | BADHDUFLAG | Total packets | Discarded packets |
| A | 0 | 12 | 0 |
| B | 0 | 12 | 0 |
| C | 0 | 12 | 0 |
| D | 0 | 12 | 0 |
| Mode M0 | |||
|---|---|---|---|
| Quadrant | BADHDUFLAG | Total packets | Discarded packets |
| A | 0 | 44556 | 5 |
| B | 0 | 45846 | 5 |
| C | 0 | 47014 | 5 |
| D | 0 | 51695 | 13 |
| Mode SS | |||
|---|---|---|---|
| Quadrant | BADHDUFLAG | Total packets | Discarded packets |
| A | 0 | 402 | 0 |
| B | 0 | 402 | 0 |
| C | 0 | 402 | 0 |
| D | 0 | 402 | 0 |
| Quadrant | Total seconds | Saturated seconds | Saturation percentage |
|---|---|---|---|
| A | 19853 | 365 | 1.838513% |
| B | 19854 | 414 | 2.085222% |
| C | 19854 | 278 | 1.400222% |
| D | 19853 | 679 | 3.420138% |
Noise dominated data is calculated using 1-second bins in cleaned event files. If a bin has >2000 counts, and if more than 50% of those come from <1% of pixels, then it is considered to be noise-dominated and hence unusable.
| Quadrant | # 1 sec bins | Bins with >0 counts | Bins with >2000 counts | High rate bins dominated by noise | Noise dominated (total time) | Noise dominated (detector-on time) | Marked lightcurve |
|---|---|---|---|---|---|---|---|
| A | 21108 | 19857 | 215 | 215 | 1.02% | 1.08% | 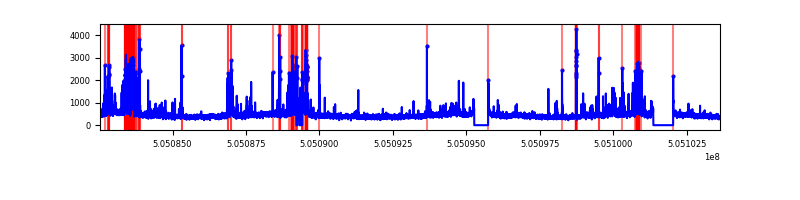 |
| B | 21109 | 19859 | 202 | 202 | 0.96% | 1.02% | 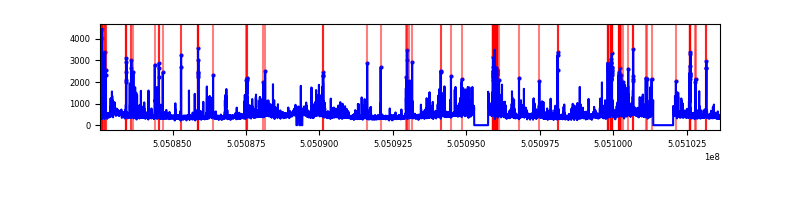 |
| C | 21109 | 19859 | 229 | 229 | 1.08% | 1.15% | 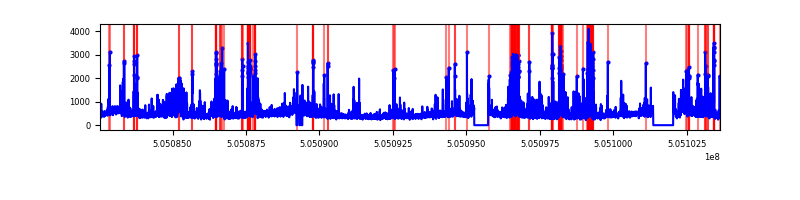 |
| D | 21109 | 19859 | 539 | 539 | 2.55% | 2.71% | 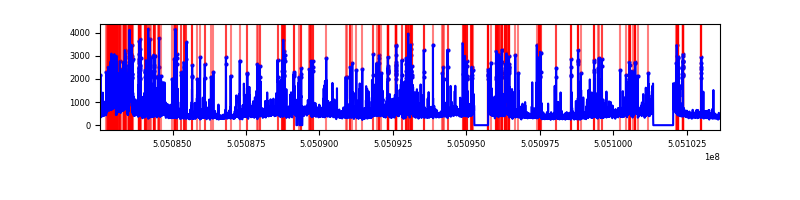 |
Top three noisy pixels from each quadrant. If the there are fewer than three noisy pixels in the level2.evt file, extra rows are filled as -1
| Pixel properties | Quadrant properties | ||||||
|---|---|---|---|---|---|---|---|
| Quadrant | DetID | PixID | Counts | Sigma | Mean | Median | Sigma |
| A | 4 | 159 | 917038 | 1795.32 | 2060 | 2004 | 509.7 |
| A | 0 | 8 | 310327 | 604.94 | 2060 | 2004 | 509.7 |
| A | 4 | 3 | 213078 | 414.13 | 2060 | 2004 | 509.7 |
| B | 4 | 206 | 921944 | 2131.69 | 2036 | 1961 | 431.6 |
| B | 5 | 236 | 632366 | 1460.71 | 2036 | 1961 | 431.6 |
| B | 0 | 171 | 314950 | 725.23 | 2036 | 1961 | 431.6 |
| C | 9 | 38 | 855482 | 1561.16 | 2012 | 1987 | 546.7 |
| C | 12 | 250 | 698418 | 1273.86 | 2012 | 1987 | 546.7 |
| C | 13 | 3 | 409021 | 744.52 | 2012 | 1987 | 546.7 |
| D | 11 | 129 | 1978817 | 3495.96 | 1993 | 1905 | 565.5 |
| D | 2 | 249 | 817453 | 1442.21 | 1993 | 1905 | 565.5 |
| D | 2 | 172 | 453440 | 798.49 | 1993 | 1905 | 565.5 |
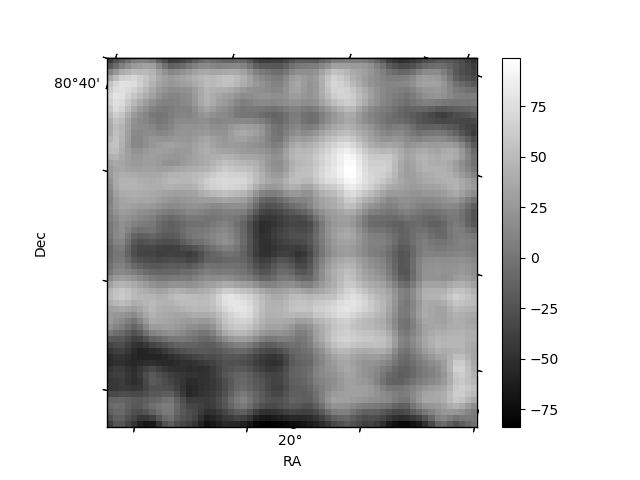
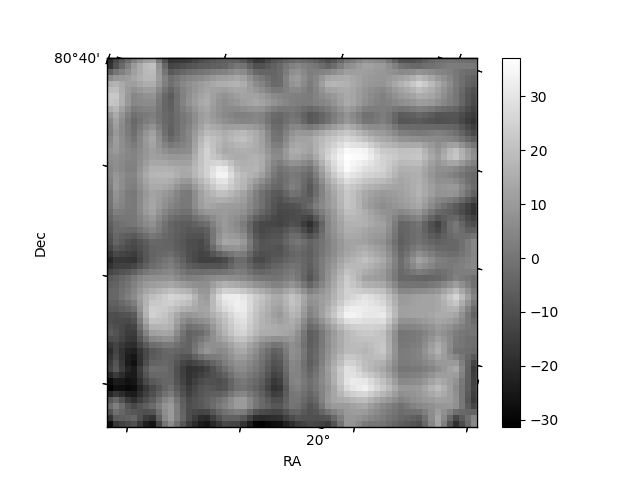
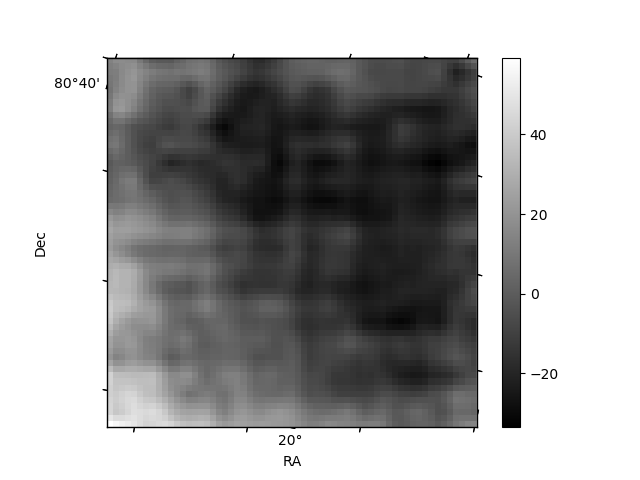
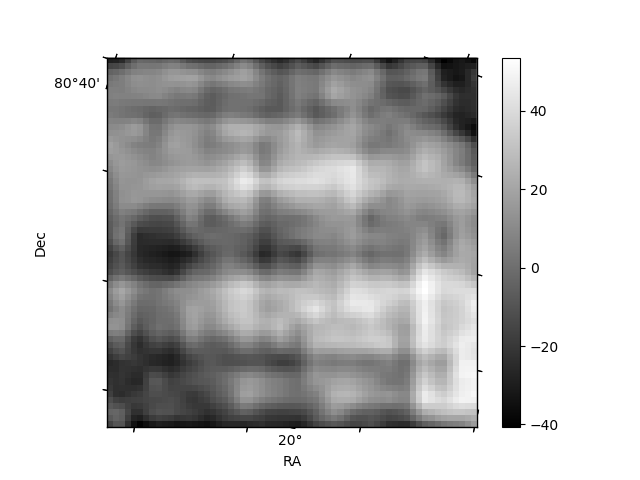
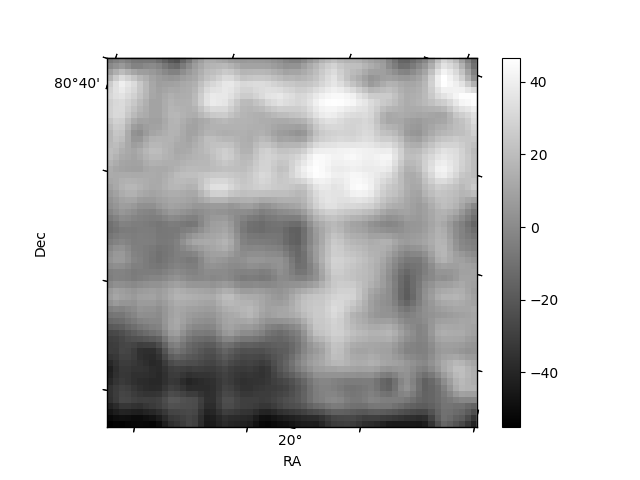
Histogram calculated using DETX and DETY for each event in the final _common_clean file
| Quadrant A | 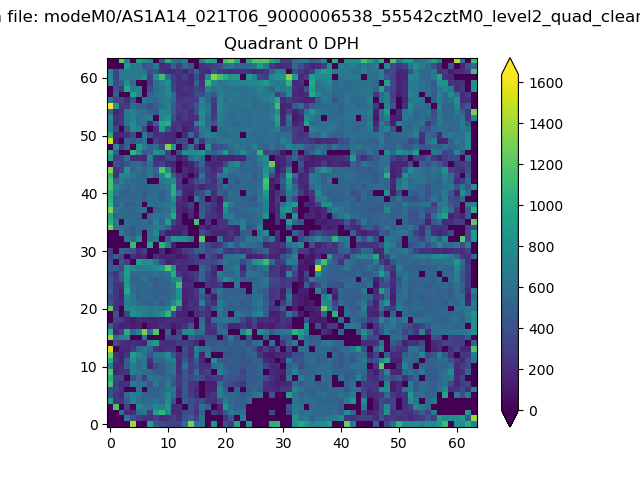 |
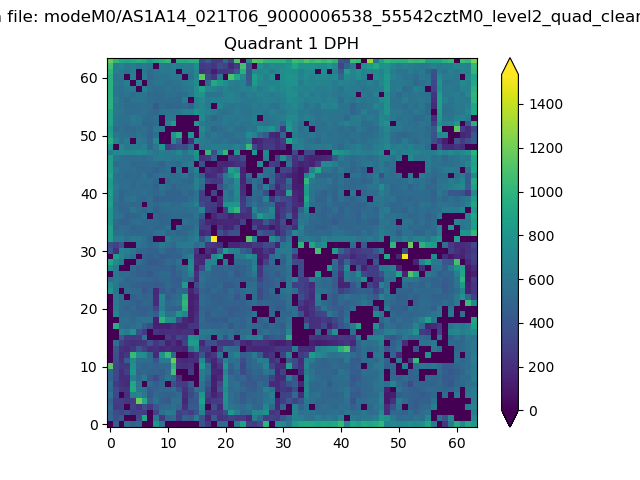 |
Quadrant B |
|---|---|---|---|
| Quadrant D | 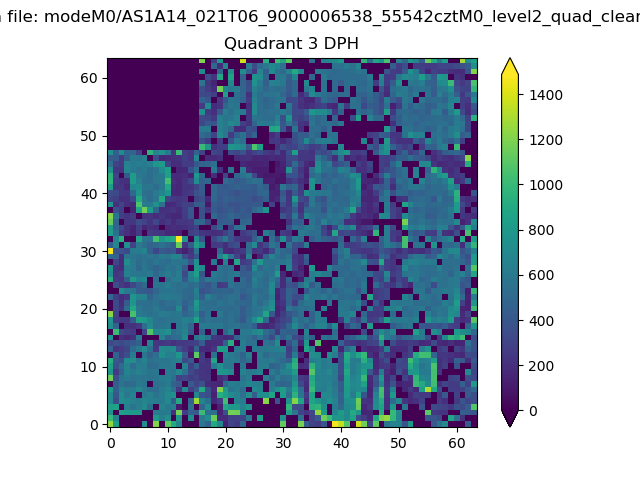 |
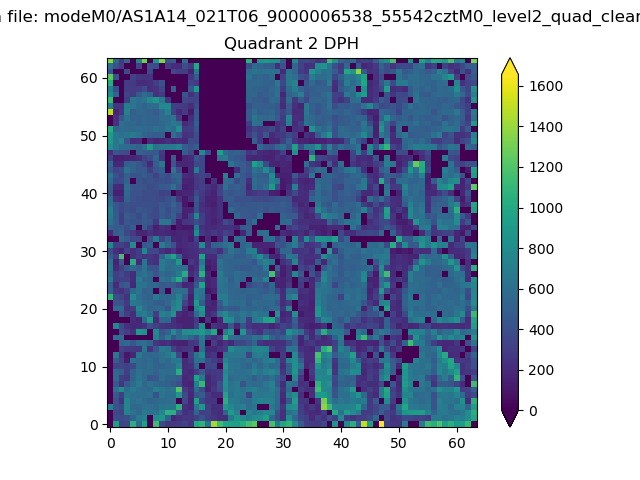 |
Quadrant C |
| Plot type | Count rate plots | Images |
|---|---|---|
| Comparison with Poisson distribution Blue bars denote a histogram of data divided into 1 sec bins. Red curve is a Poisson curve with rate = median count rate of data. |
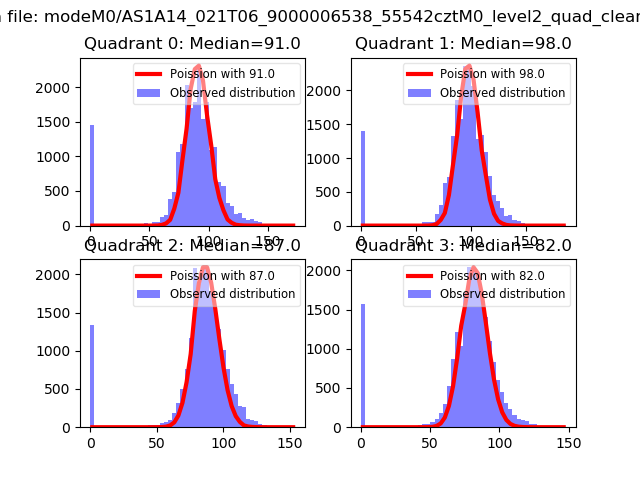 |
 |
| Quadrant-wise count rates Data is divided into 100 sec bins |
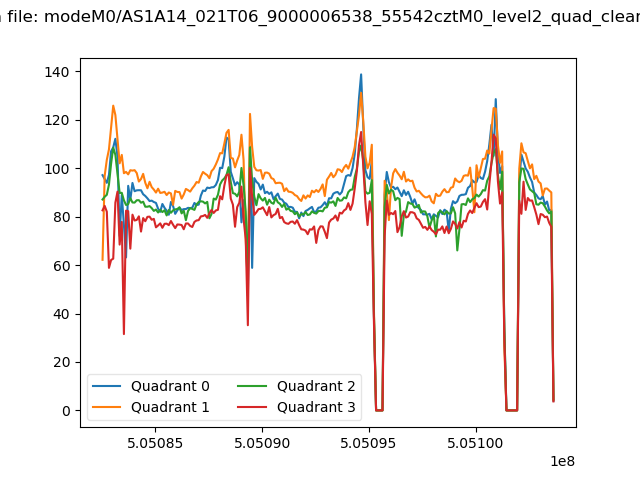 |
|
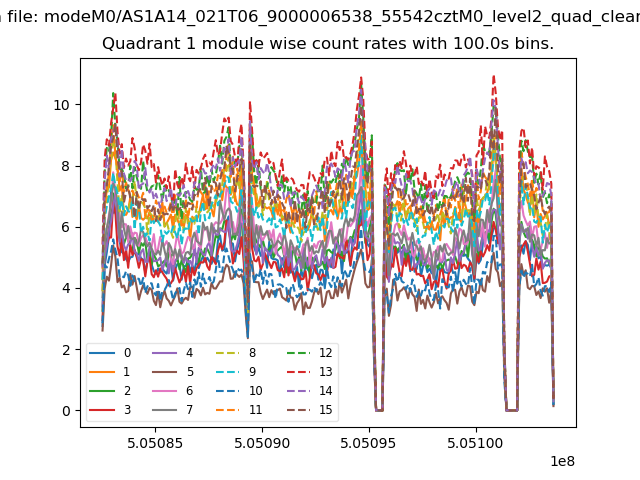
| Module-wise count rates for Quadrant A Data is divided into 100 sec bins |
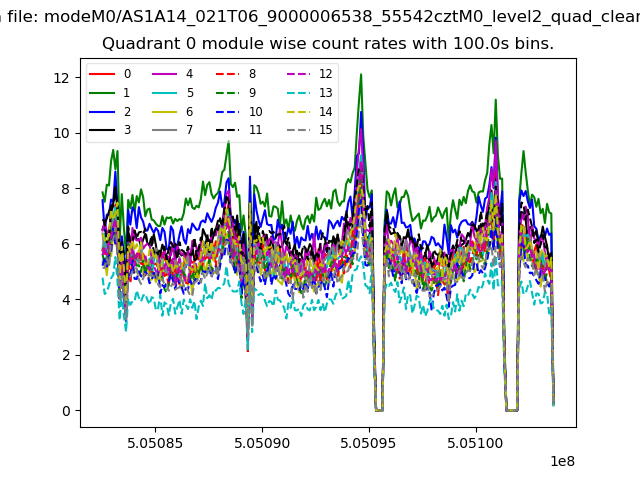 |
 |
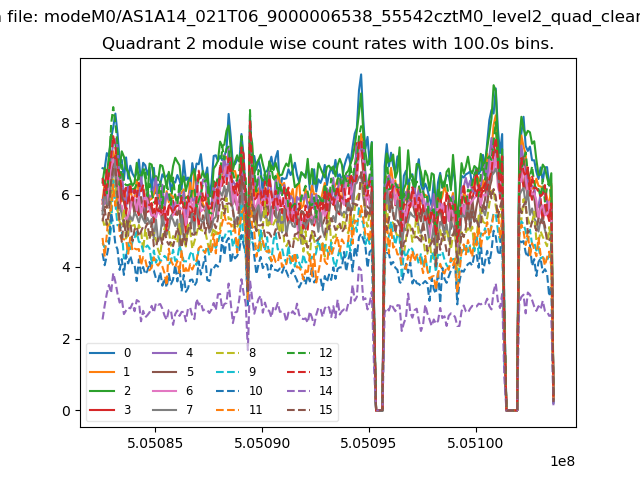
| Module-wise count rates for Quadrant B Data is divided into 100 sec bins |
 |
 |
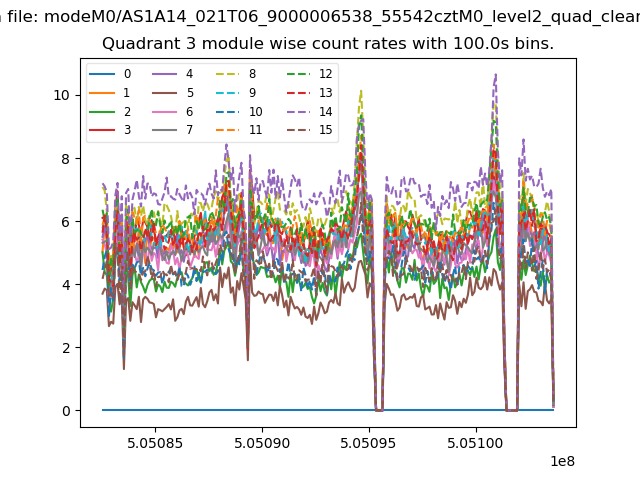
| Module-wise count rates for Quadrant C Data is divided into 100 sec bins |
 |
 |
| Module-wise count rates for Quadrant D Data is divided into 100 sec bins |
 |
 |
| Parameter | Plot |
|---|---|
| CZT HV Monitor | 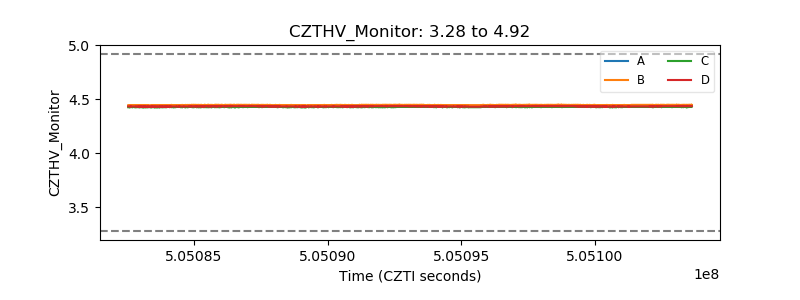 |
| D_VDD | 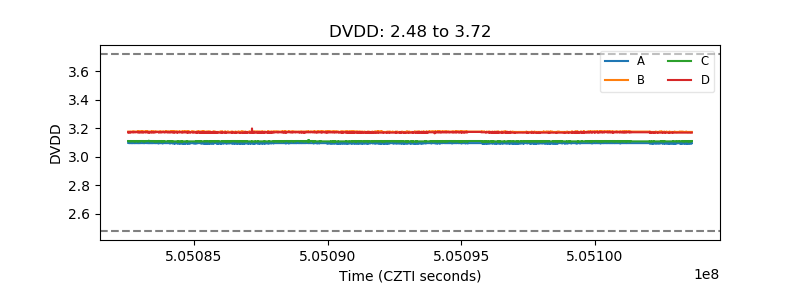 |
| Temperature 1 | 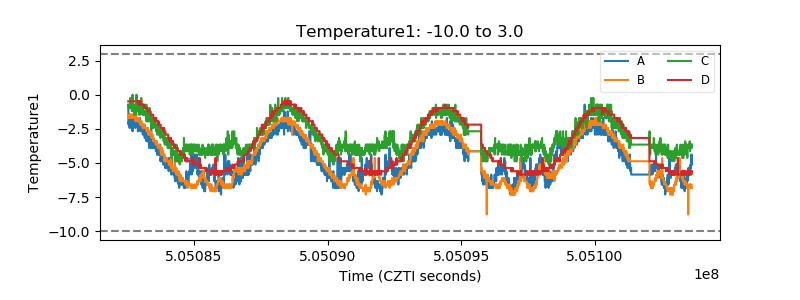 |
| Veto HV Monitor | 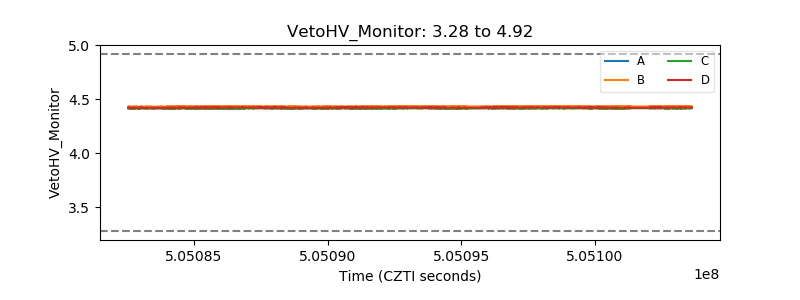 |
| Veto LLD | 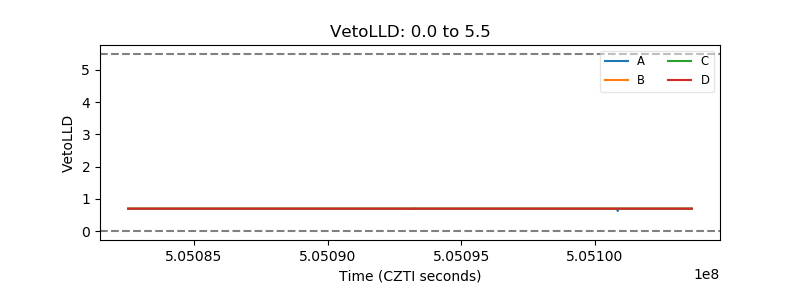 |
| Alpha Counter | 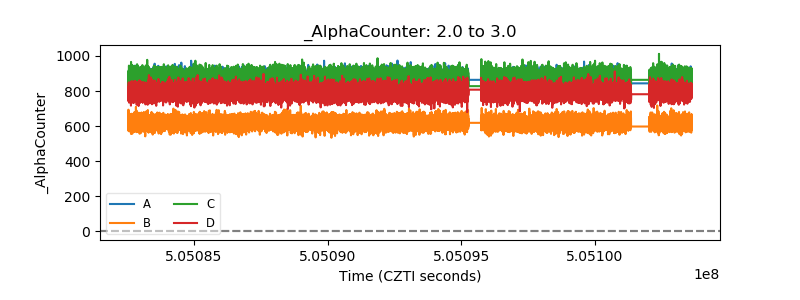 |
| _CPM_Rate | 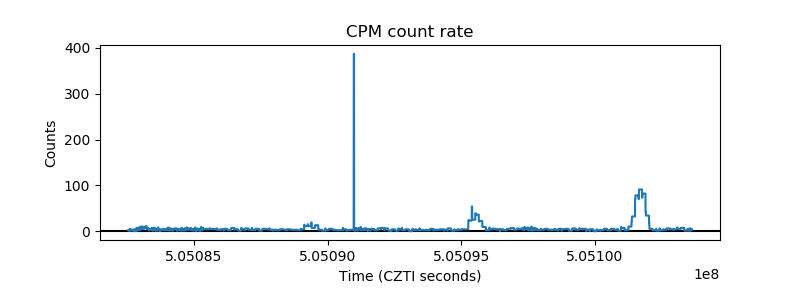 |
| CZT Counter | 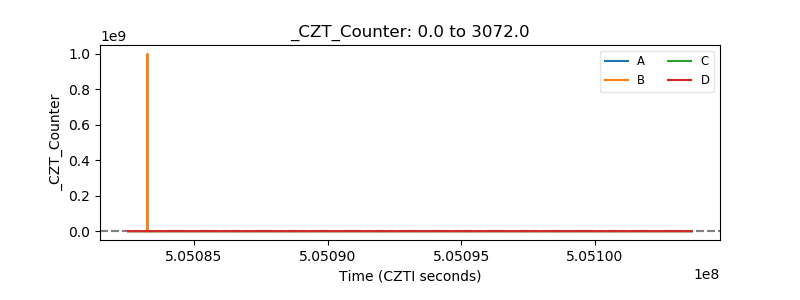 |
| +2.5 Volts monitor | 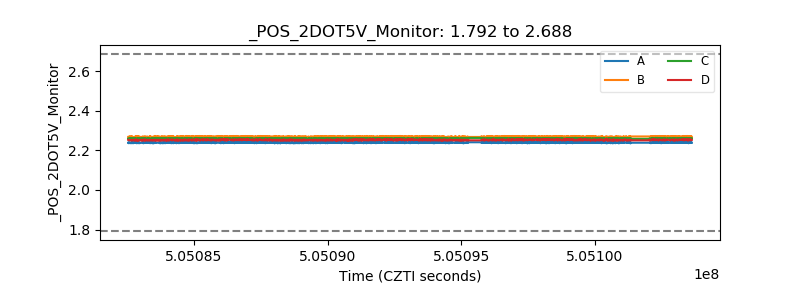 |
| +5 Volts monitor | 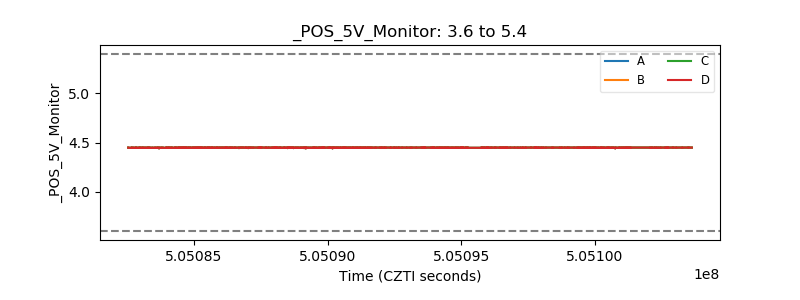 |
| _ROLL_ROT | 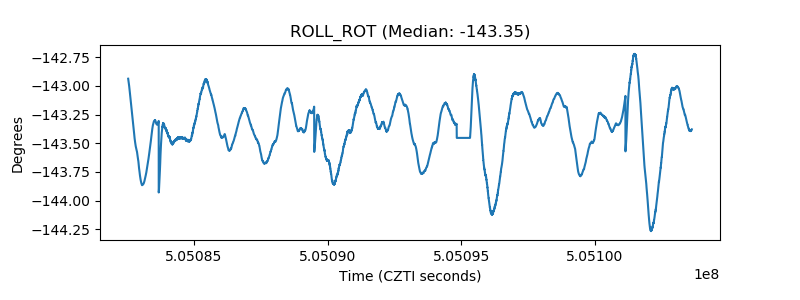 |
| _Roll_DEC | 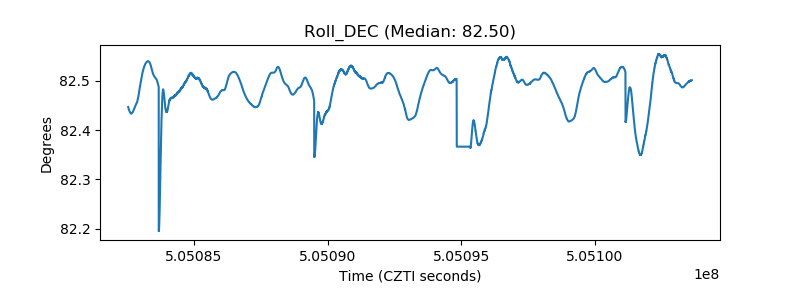 |
| _Roll_RA | 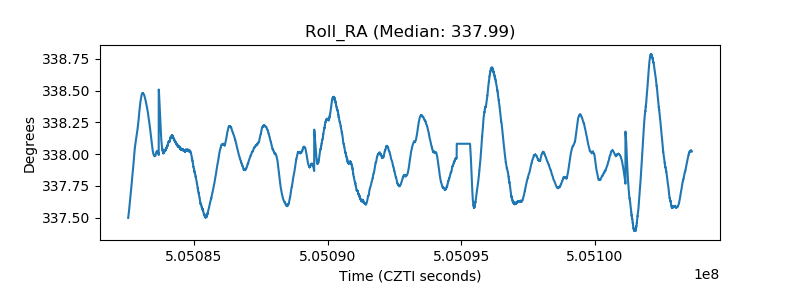 |
| Veto Counter | 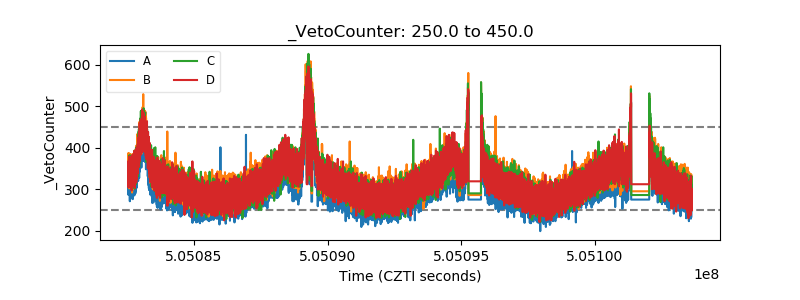 |