| Param | Original file | Final file |
|---|---|---|
| Filename | modeM0/AS1A14_021T06_9000006538_55545cztM0_level2.fits | modeM0/AS1A14_021T06_9000006538_55545cztM0_level2_quad_clean.evt |
| Size (bytes) | 688,345,920 | 70,824,960 |
| Size | 656.5 MB | 67.5 MB |
| Events in quadrant A | 2,742,294 | 565,986 |
| Events in quadrant B | 2,648,136 | 607,612 |
| Events in quadrant C | 3,057,956 | 539,447 |
| Events in quadrant D | 16,554,457 | 3,069 |
| Mode M9 | |||
|---|---|---|---|
| Quadrant | BADHDUFLAG | Total packets | Discarded packets |
| A | 0 | 9 | 0 |
| B | 0 | 9 | 0 |
| C | 0 | 9 | 0 |
| D | 0 | 9 | 0 |
| Mode M0 | |||
|---|---|---|---|
| Quadrant | BADHDUFLAG | Total packets | Discarded packets |
| A | 0 | 12978 | 1 |
| B | 0 | 12707 | 1 |
| C | 0 | 13798 | 1 |
| D | 0 | 53243 | 19 |
| Mode SS | |||
|---|---|---|---|
| Quadrant | BADHDUFLAG | Total packets | Discarded packets |
| A | 0 | 126 | 0 |
| B | 0 | 126 | 0 |
| C | 0 | 126 | 0 |
| D | 0 | 126 | 0 |
| Quadrant | Total seconds | Saturated seconds | Saturation percentage |
|---|---|---|---|
| A | 6128 | 88 | 1.436031% |
| B | 6128 | 82 | 1.338120% |
| C | 6128 | 90 | 1.468668% |
| D | 6127 | 6096 | 99.494043% |
Noise dominated data is calculated using 1-second bins in cleaned event files. If a bin has >2000 counts, and if more than 50% of those come from <1% of pixels, then it is considered to be noise-dominated and hence unusable.
| Quadrant | # 1 sec bins | Bins with >0 counts | Bins with >2000 counts | High rate bins dominated by noise | Noise dominated (total time) | Noise dominated (detector-on time) | Marked lightcurve |
|---|---|---|---|---|---|---|---|
| A | 7078 | 6128 | 28 | 28 | 0.40% | 0.46% | 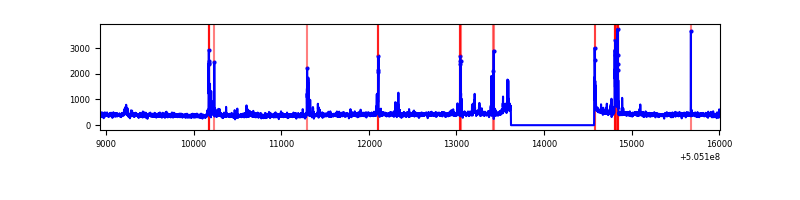 |
| B | 7078 | 6128 | 18 | 18 | 0.25% | 0.29% | 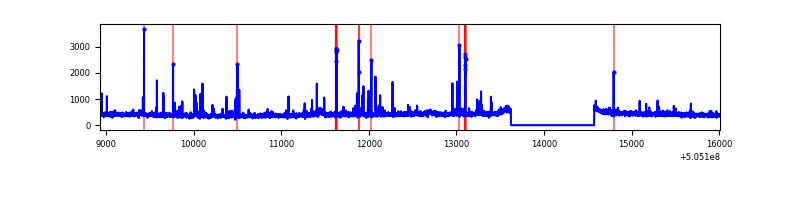 |
| C | 7078 | 6128 | 51 | 51 | 0.72% | 0.83% | 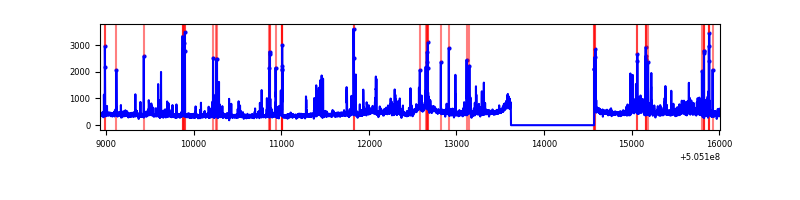 |
| D | 7078 | 6126 | 6074 | 6074 | 85.82% | 99.15% | 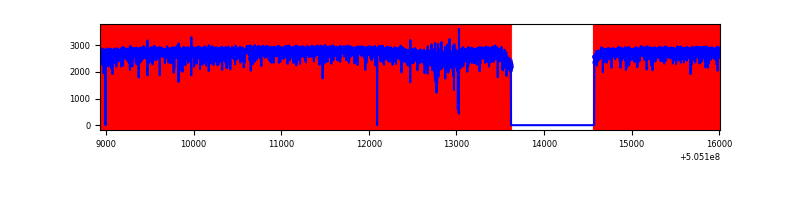 |
Top three noisy pixels from each quadrant. If the there are fewer than three noisy pixels in the level2.evt file, extra rows are filled as -1
| Pixel properties | Quadrant properties | ||||||
|---|---|---|---|---|---|---|---|
| Quadrant | DetID | PixID | Counts | Sigma | Mean | Median | Sigma |
| A | 0 | 8 | 132405 | 851.35 | 623 | 606 | 154.8 |
| A | 15 | 32 | 88833 | 569.9 | 623 | 606 | 154.8 |
| A | 4 | 3 | 48875 | 311.79 | 623 | 606 | 154.8 |
| B | 0 | 171 | 43611 | 324.83 | 618 | 596 | 132.4 |
| B | 10 | 247 | 36873 | 273.95 | 618 | 596 | 132.4 |
| B | 1 | 238 | 35042 | 260.12 | 618 | 596 | 132.4 |
| C | 9 | 38 | 221138 | 1322.7 | 602 | 594 | 166.7 |
| C | 13 | 3 | 192707 | 1152.19 | 602 | 594 | 166.7 |
| C | 15 | 178 | 77178 | 459.31 | 602 | 594 | 166.7 |
| D | 7 | 70 | 15417359 | 214339.88 | 249 | 237 | 71.9 |
| D | 2 | 172 | 37244 | 514.5 | 249 | 237 | 71.9 |
| D | 6 | 239 | 23777 | 327.27 | 249 | 237 | 71.9 |
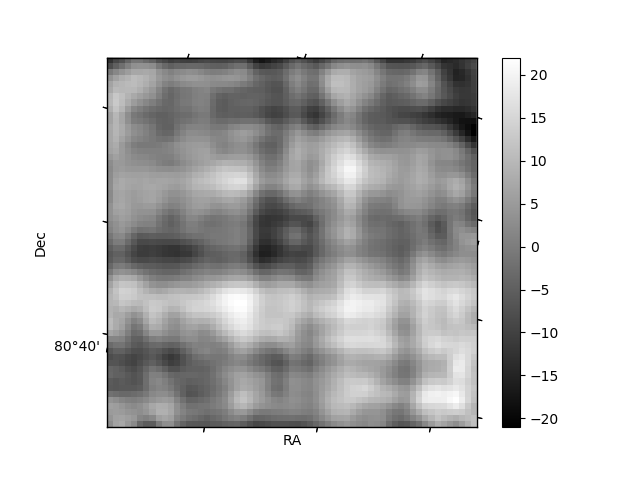
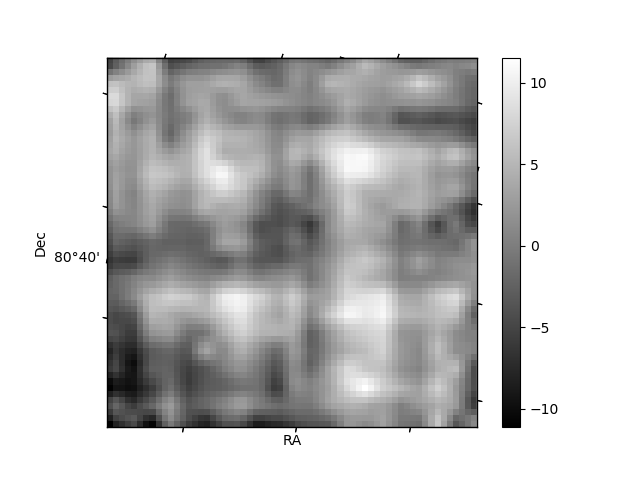
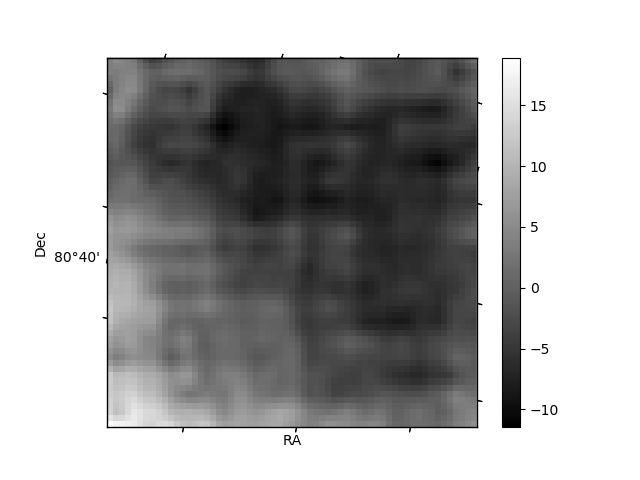
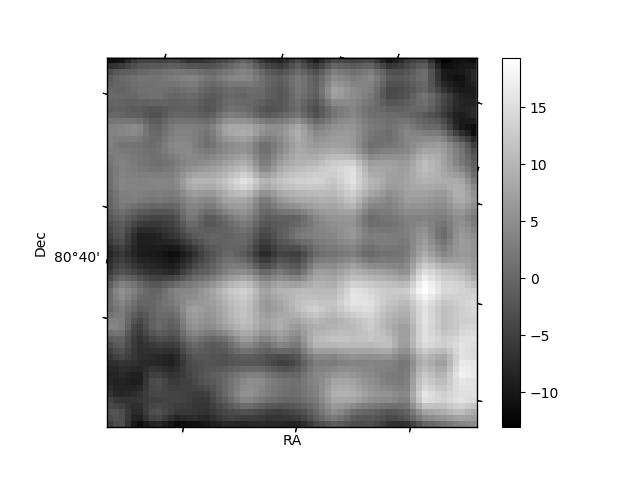
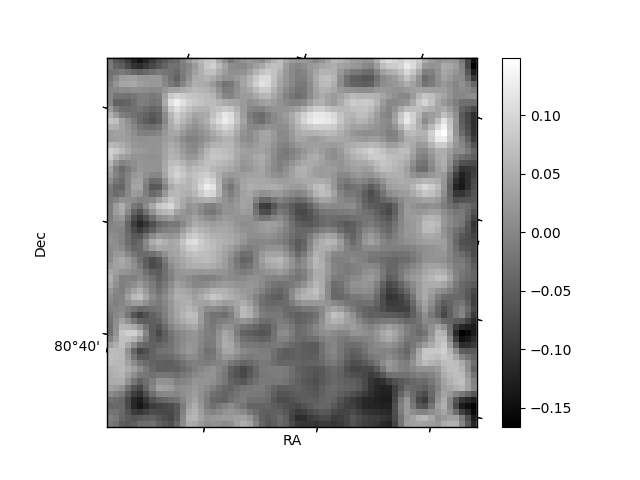
Histogram calculated using DETX and DETY for each event in the final _common_clean file
| Quadrant A | 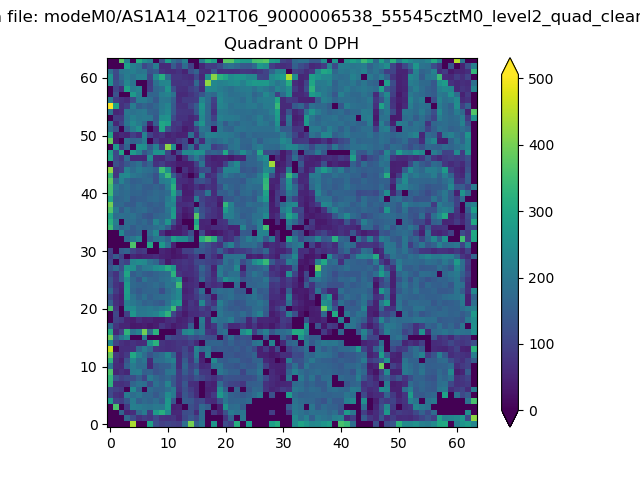 |
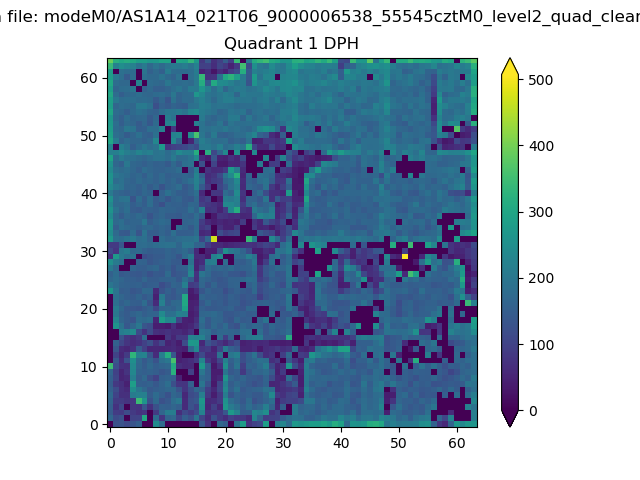 |
Quadrant B |
|---|---|---|---|
| Quadrant D | 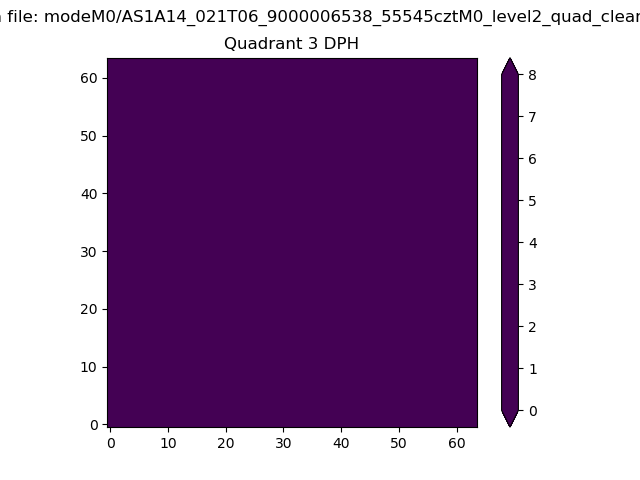 |
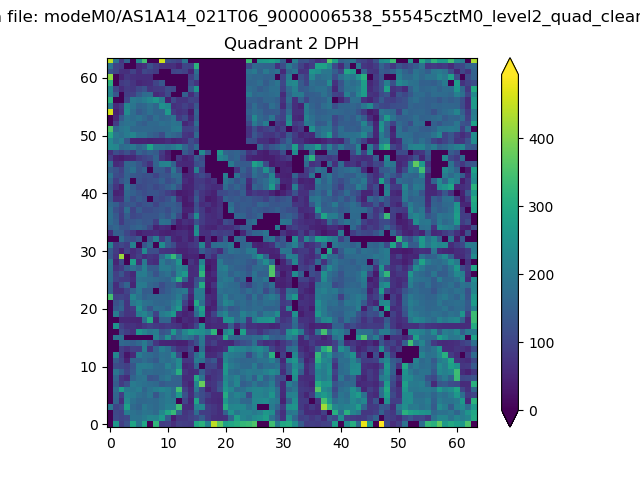 |
Quadrant C |
| Plot type | Count rate plots | Images |
|---|---|---|
| Comparison with Poisson distribution Blue bars denote a histogram of data divided into 1 sec bins. Red curve is a Poisson curve with rate = median count rate of data. |
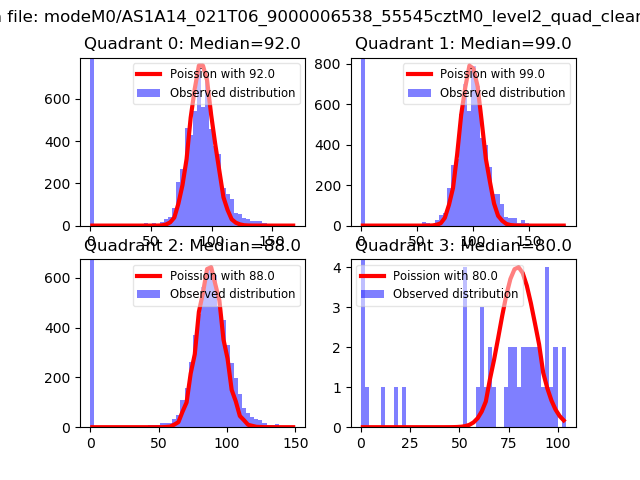 |
 |
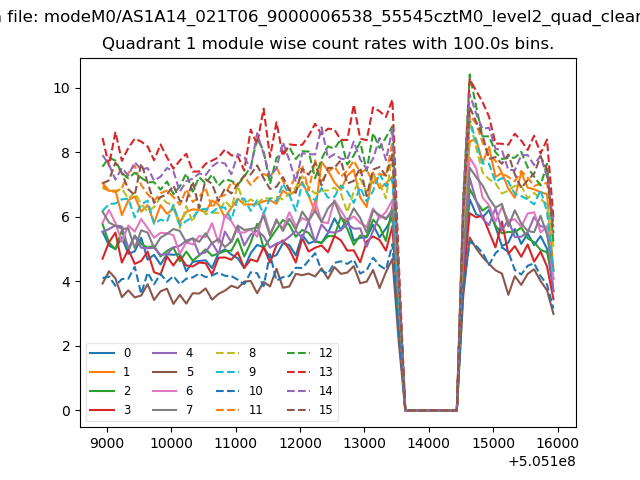
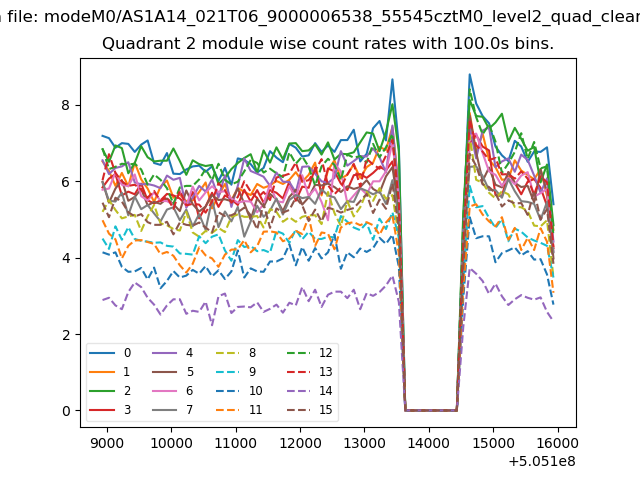
| Quadrant-wise count rates Data is divided into 100 sec bins |
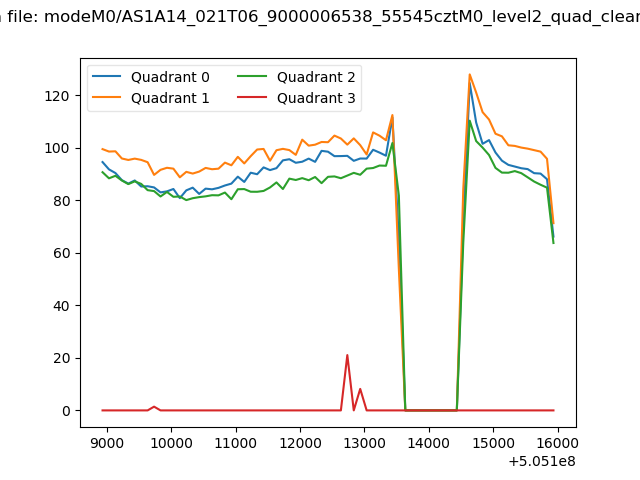 |
|
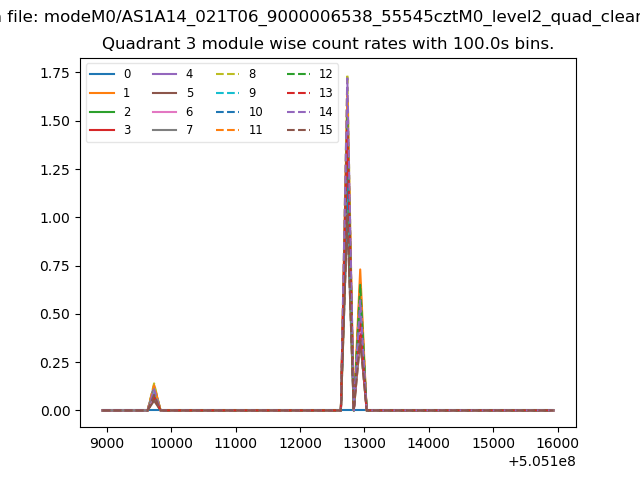
| Module-wise count rates for Quadrant A Data is divided into 100 sec bins |
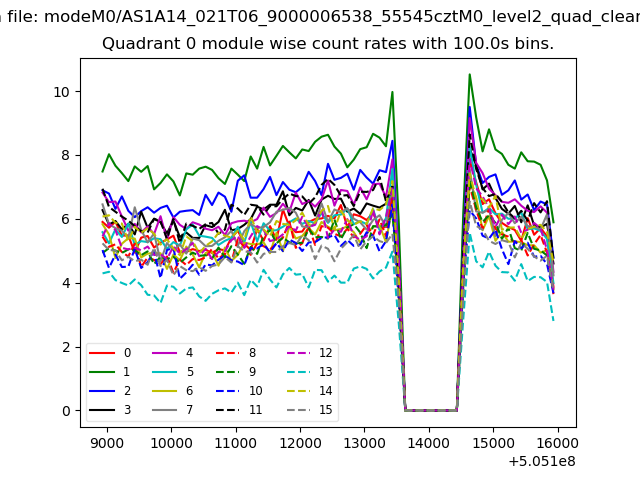 |
 |
| Module-wise count rates for Quadrant B Data is divided into 100 sec bins |
 |
 |
| Module-wise count rates for Quadrant C Data is divided into 100 sec bins |
 |
 |
| Module-wise count rates for Quadrant D Data is divided into 100 sec bins |
 |
 |
| Parameter | Plot |
|---|---|
| CZT HV Monitor | 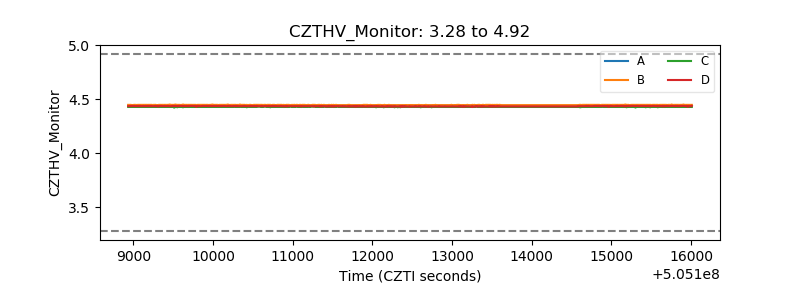 |
| D_VDD | 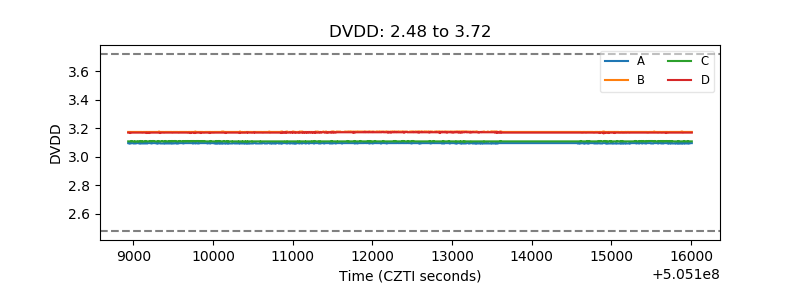 |
| Temperature 1 | 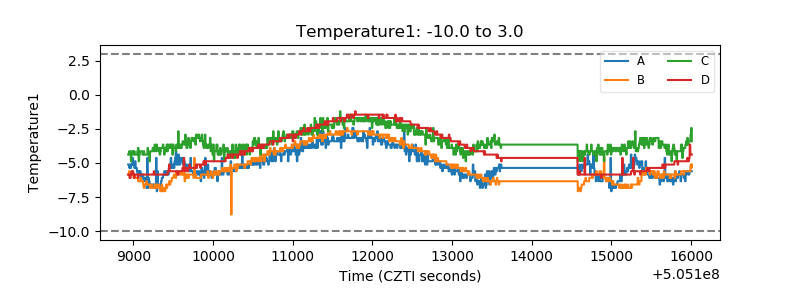 |
| Veto HV Monitor | 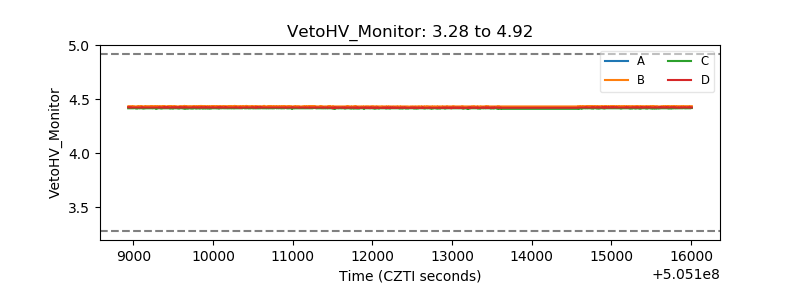 |
| Veto LLD | 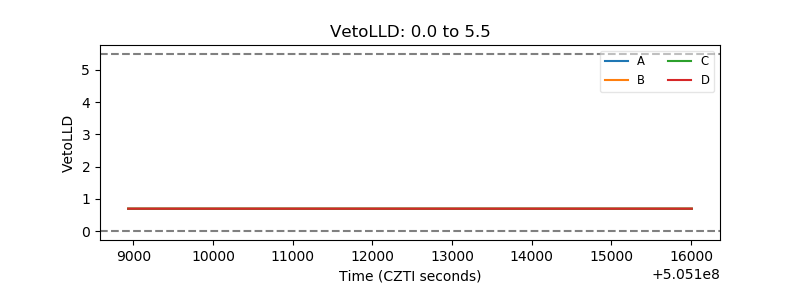 |
| Alpha Counter | 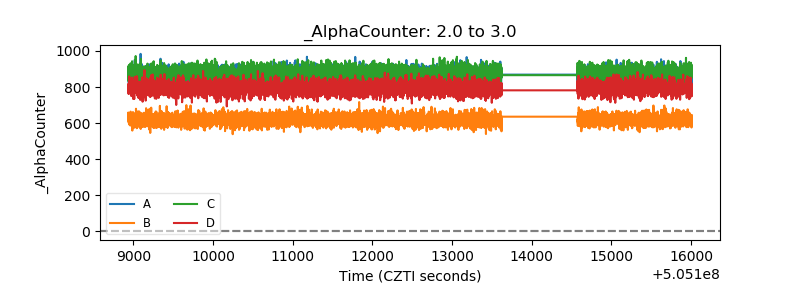 |
| _CPM_Rate | 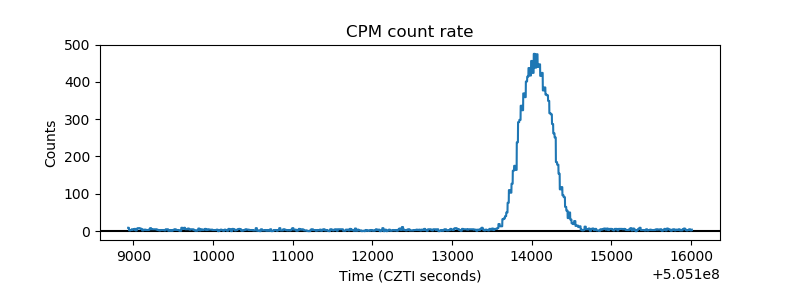 |
| CZT Counter | 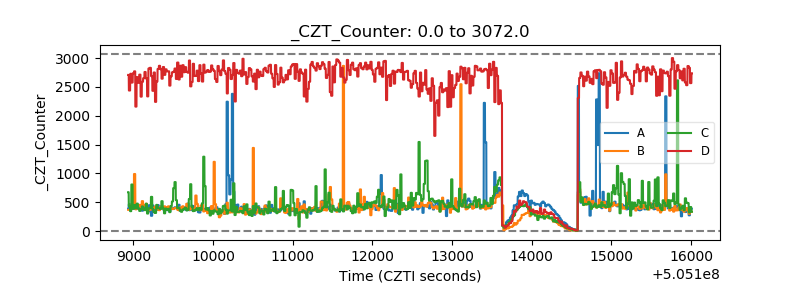 |
| +2.5 Volts monitor | 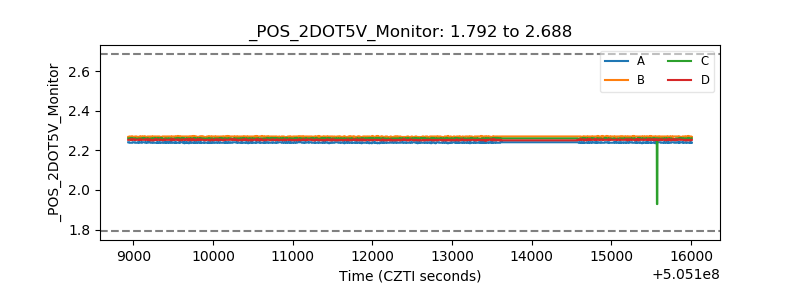 |
| +5 Volts monitor | 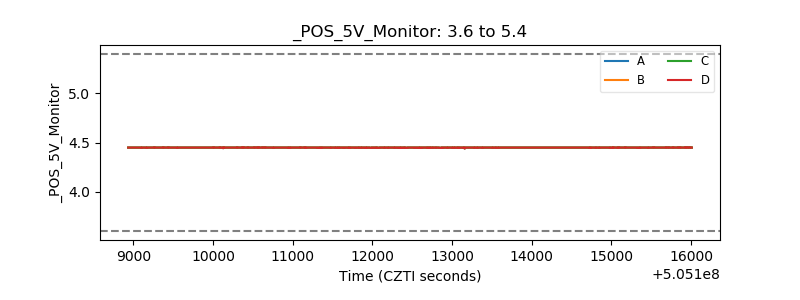 |
| _ROLL_ROT | 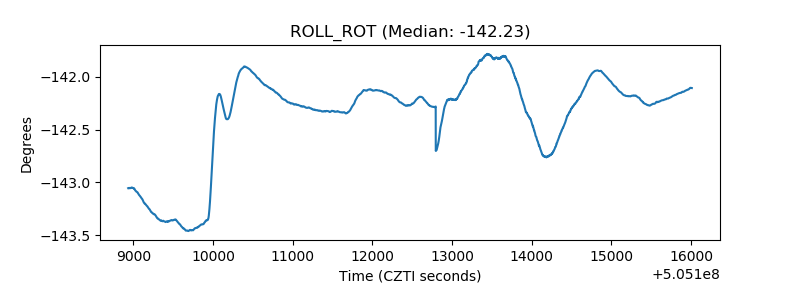 |
| _Roll_DEC | 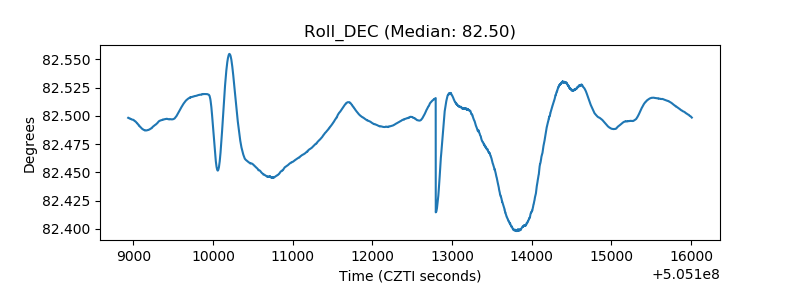 |
| _Roll_RA | 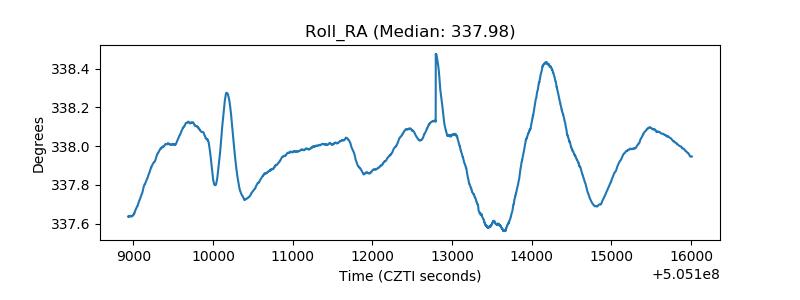 |
| Veto Counter | 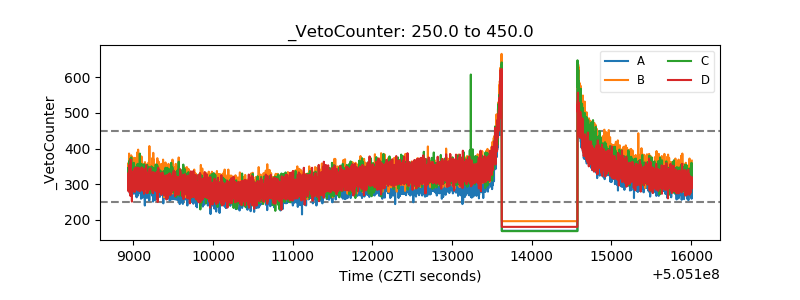 |