| Param | Original file | Final file |
|---|---|---|
| Filename | modeM0/AS1A14_021T06_9000006538_55546cztM0_level2.fits | modeM0/AS1A14_021T06_9000006538_55546cztM0_level2_quad_clean.evt |
| Size (bytes) | 500,077,440 | 77,302,080 |
| Size | 476.9 MB | 73.7 MB |
| Events in quadrant A | 2,550,760 | 555,048 |
| Events in quadrant B | 2,634,007 | 595,418 |
| Events in quadrant C | 3,299,069 | 515,925 |
| Events in quadrant D | 9,572,636 | 266,671 |
| Mode M9 | |||
|---|---|---|---|
| Quadrant | BADHDUFLAG | Total packets | Discarded packets |
| A | 0 | 11 | 0 |
| B | 0 | 11 | 0 |
| C | 0 | 11 | 0 |
| D | 0 | 11 | 0 |
| Mode M0 | |||
|---|---|---|---|
| Quadrant | BADHDUFLAG | Total packets | Discarded packets |
| A | 0 | 12104 | 1 |
| B | 0 | 12439 | 1 |
| C | 0 | 14221 | 1 |
| D | 0 | 32407 | 2 |
| Mode SS | |||
|---|---|---|---|
| Quadrant | BADHDUFLAG | Total packets | Discarded packets |
| A | 0 | 118 | 0 |
| B | 0 | 118 | 0 |
| C | 0 | 118 | 0 |
| D | 0 | 118 | 0 |
| Quadrant | Total seconds | Saturated seconds | Saturation percentage |
|---|---|---|---|
| A | 5835 | 42 | 0.719794% |
| B | 5835 | 58 | 0.994002% |
| C | 5836 | 138 | 2.364633% |
| D | 5835 | 2906 | 49.802913% |
Noise dominated data is calculated using 1-second bins in cleaned event files. If a bin has >2000 counts, and if more than 50% of those come from <1% of pixels, then it is considered to be noise-dominated and hence unusable.
| Quadrant | # 1 sec bins | Bins with >0 counts | Bins with >2000 counts | High rate bins dominated by noise | Noise dominated (total time) | Noise dominated (detector-on time) | Marked lightcurve |
|---|---|---|---|---|---|---|---|
| A | 6920 | 5836 | 13 | 13 | 0.19% | 0.22% | 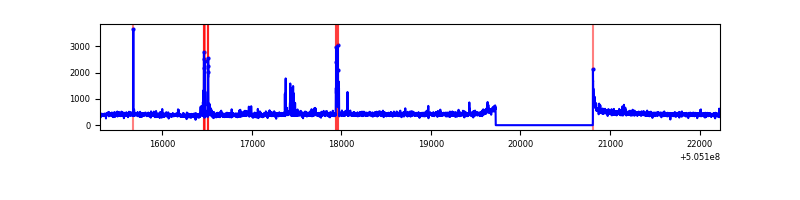 |
| B | 6920 | 5836 | 15 | 15 | 0.22% | 0.26% | 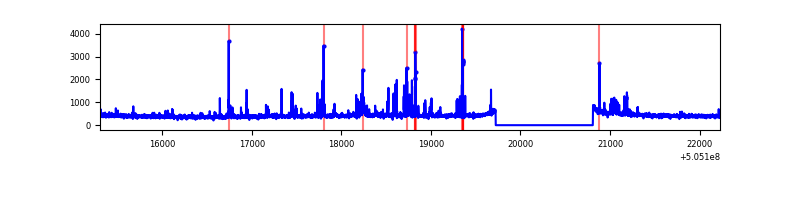 |
| C | 6921 | 5837 | 117 | 117 | 1.69% | 2.00% | 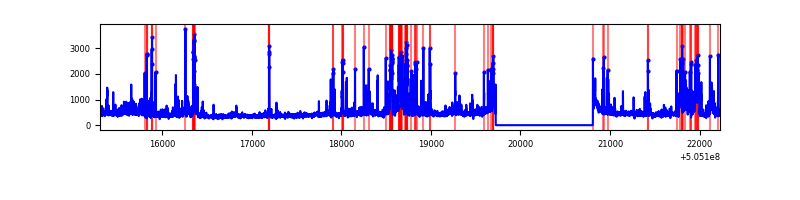 |
| D | 6920 | 5836 | 2897 | 2897 | 41.86% | 49.64% | 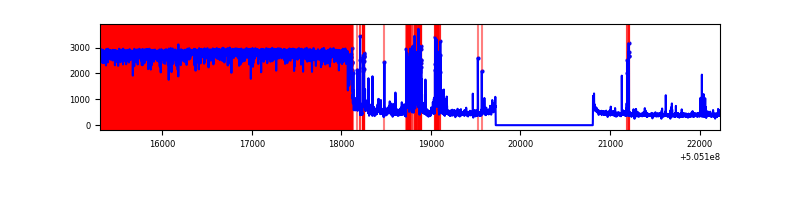 |
Top three noisy pixels from each quadrant. If the there are fewer than three noisy pixels in the level2.evt file, extra rows are filled as -1
| Pixel properties | Quadrant properties | ||||||
|---|---|---|---|---|---|---|---|
| Quadrant | DetID | PixID | Counts | Sigma | Mean | Median | Sigma |
| A | 0 | 8 | 125137 | 840.56 | 600 | 585 | 148.2 |
| A | 4 | 3 | 57067 | 381.18 | 600 | 585 | 148.2 |
| A | 13 | 254 | 13228 | 85.32 | 600 | 585 | 148.2 |
| B | 4 | 206 | 92344 | 722.76 | 591 | 570 | 127.0 |
| B | 0 | 171 | 72800 | 568.84 | 591 | 570 | 127.0 |
| B | 10 | 247 | 53025 | 413.1 | 591 | 570 | 127.0 |
| C | 9 | 38 | 639992 | 4059.25 | 570 | 563 | 157.5 |
| C | 13 | 3 | 188909 | 1195.67 | 570 | 563 | 157.5 |
| C | 12 | 252 | 94648 | 597.27 | 570 | 563 | 157.5 |
| D | 7 | 70 | 7292055 | 63960.84 | 401 | 381 | 114.0 |
| D | 6 | 239 | 330997 | 2900.08 | 401 | 381 | 114.0 |
| D | 11 | 129 | 123986 | 1084.23 | 401 | 381 | 114.0 |
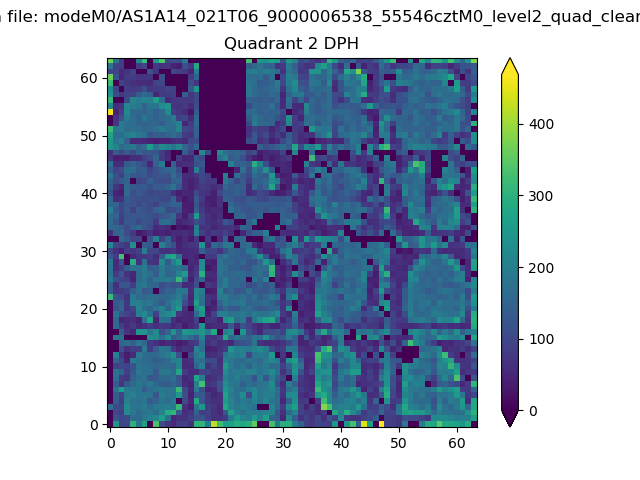
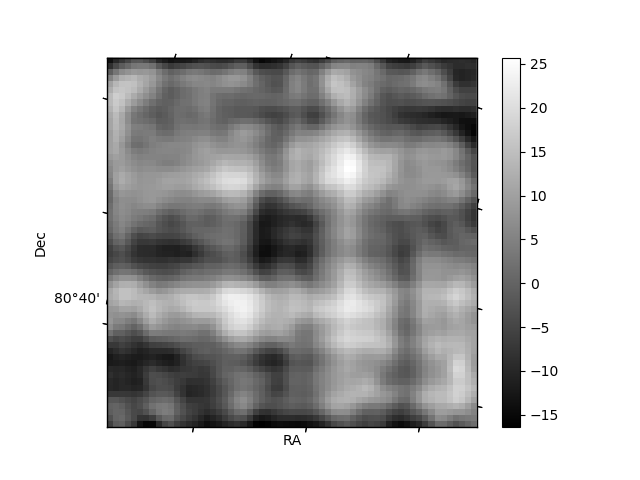
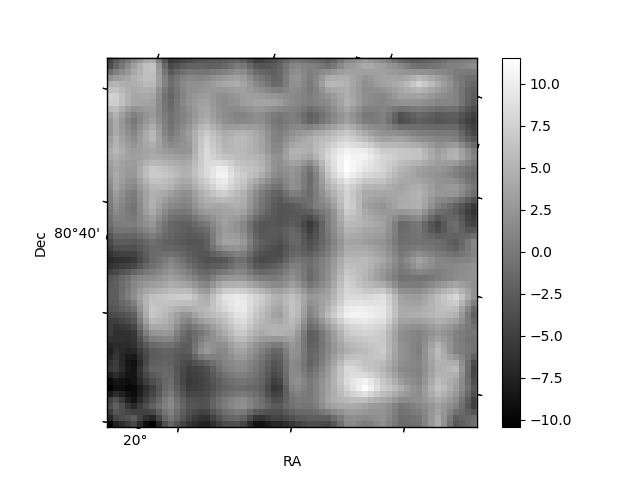
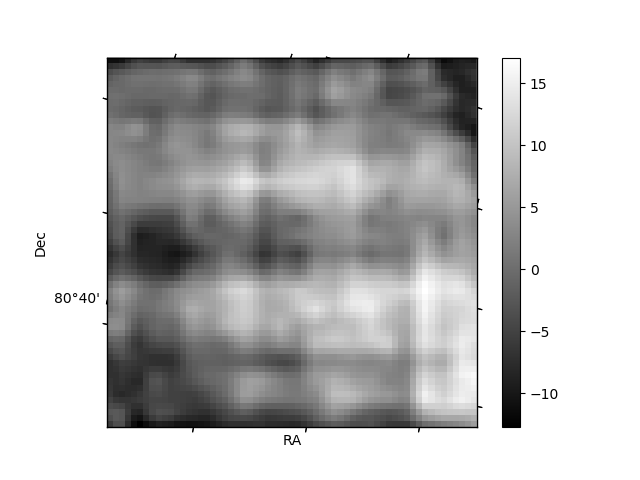
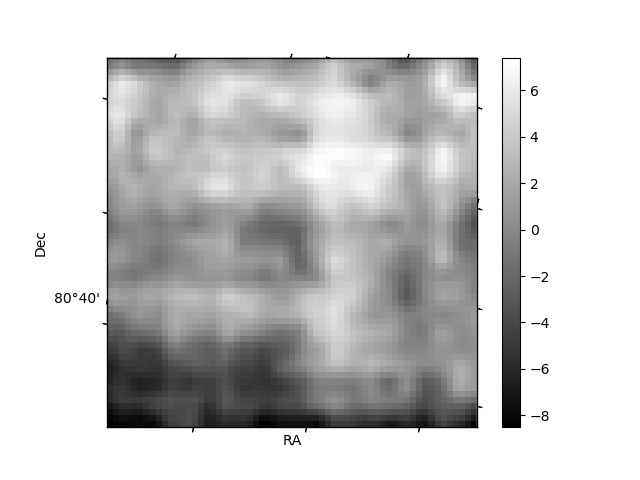
Histogram calculated using DETX and DETY for each event in the final _common_clean file
| Quadrant A | 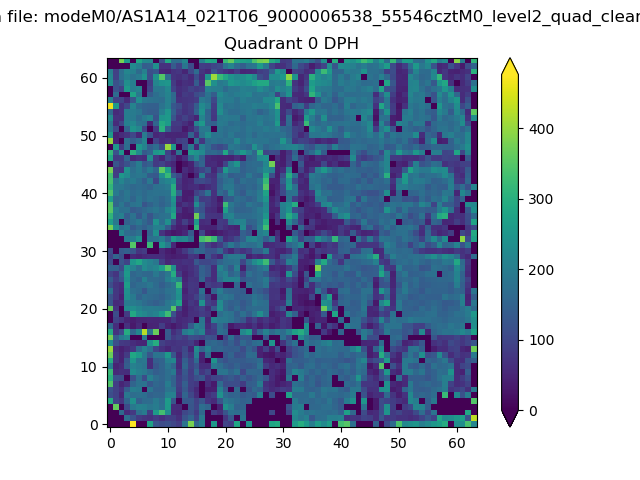 |
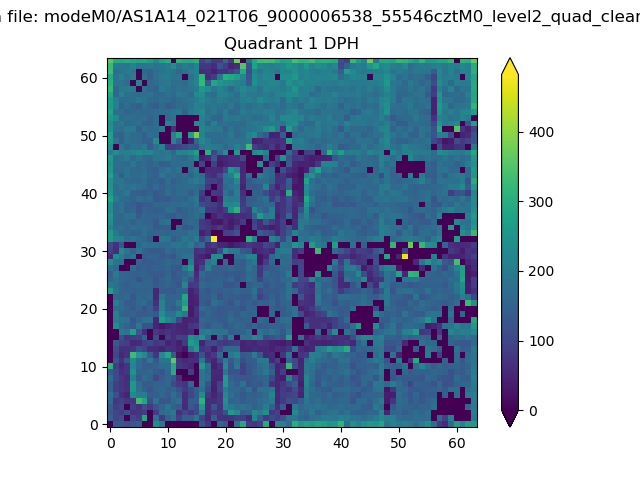 |
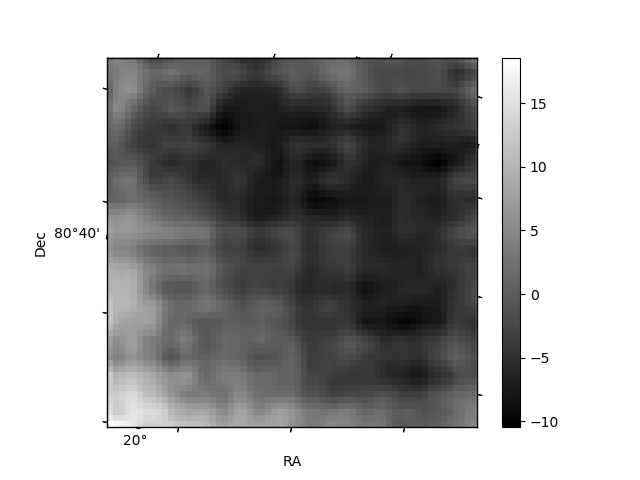
Quadrant B |
|---|---|---|---|
| Quadrant D | 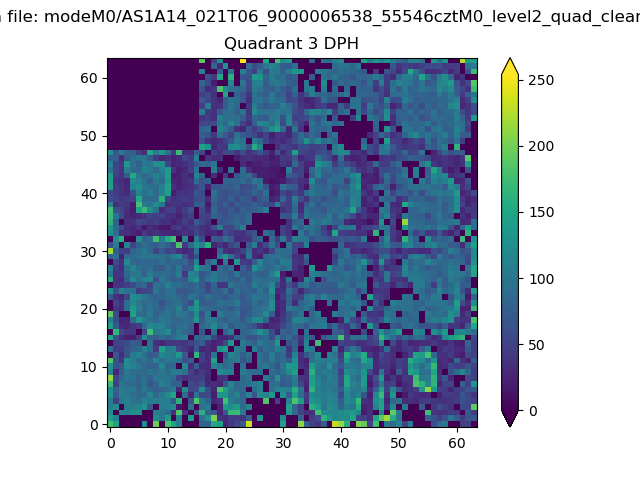 |
 |
Quadrant C |
| Plot type | Count rate plots | Images |
|---|---|---|
| Comparison with Poisson distribution Blue bars denote a histogram of data divided into 1 sec bins. Red curve is a Poisson curve with rate = median count rate of data. |
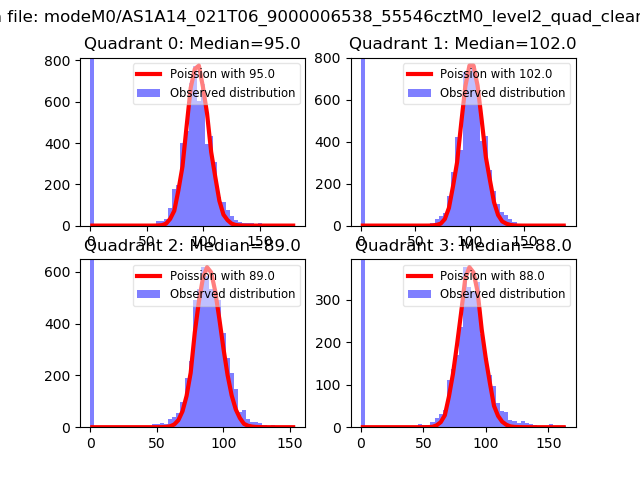 |
 |
| Quadrant-wise count rates Data is divided into 100 sec bins |
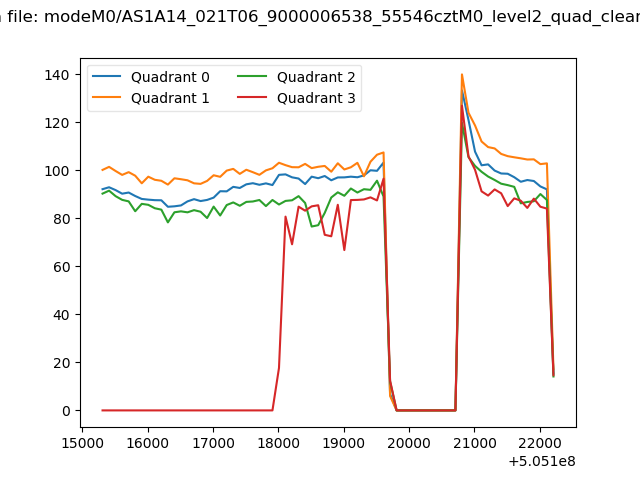 |
|
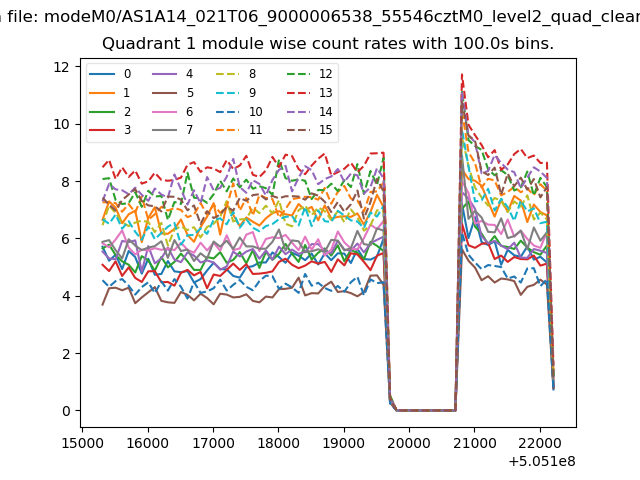
| Module-wise count rates for Quadrant A Data is divided into 100 sec bins |
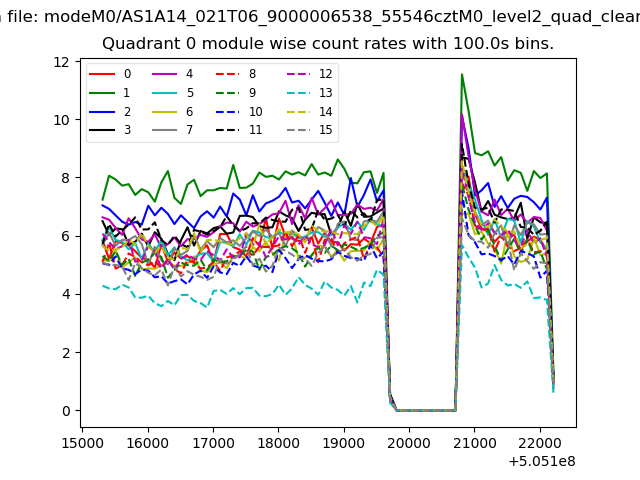 |
 |
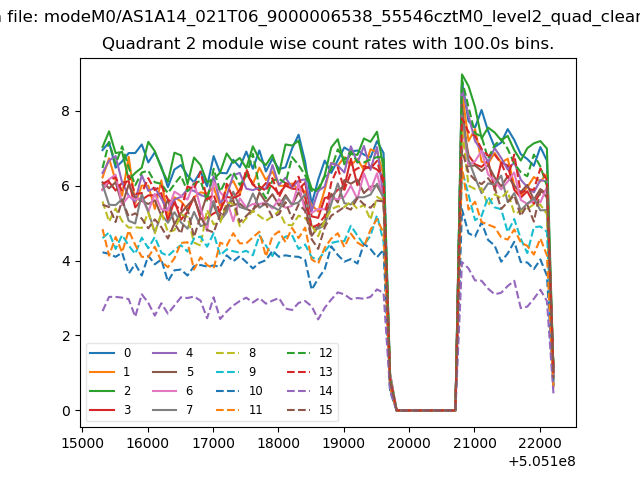
| Module-wise count rates for Quadrant B Data is divided into 100 sec bins |
 |
 |
| Module-wise count rates for Quadrant C Data is divided into 100 sec bins |
 |
 |
| Module-wise count rates for Quadrant D Data is divided into 100 sec bins |
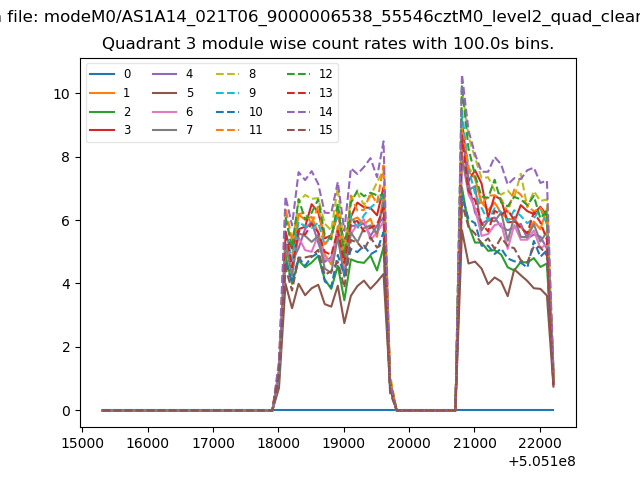 |
 |
| Parameter | Plot |
|---|---|
| CZT HV Monitor | 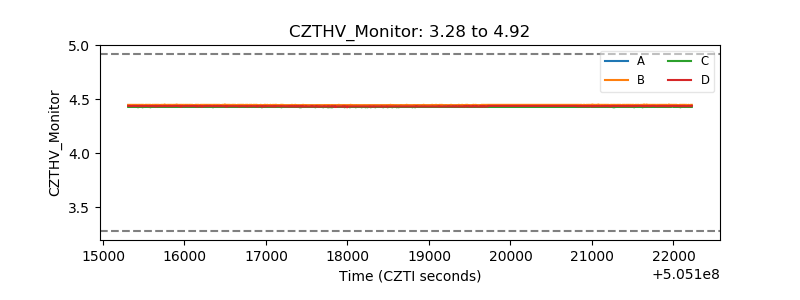 |
| D_VDD | 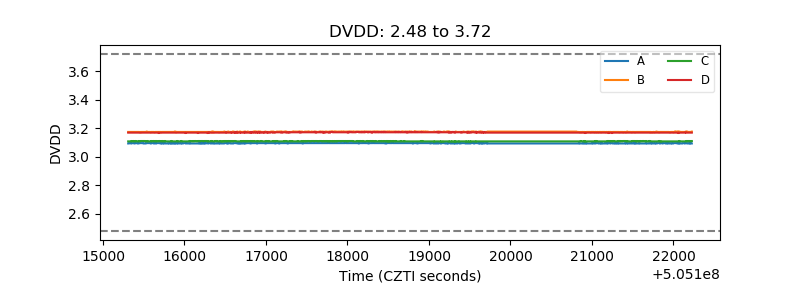 |
| Temperature 1 | 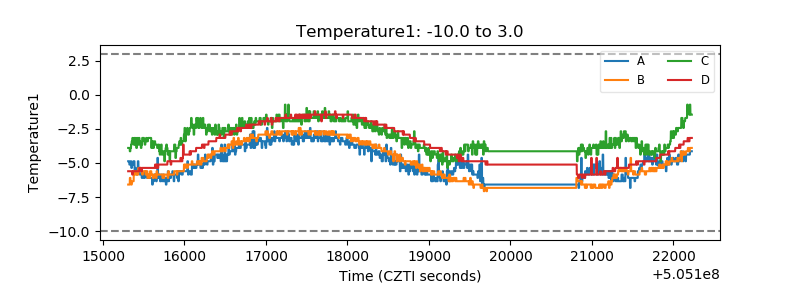 |
| Veto HV Monitor | 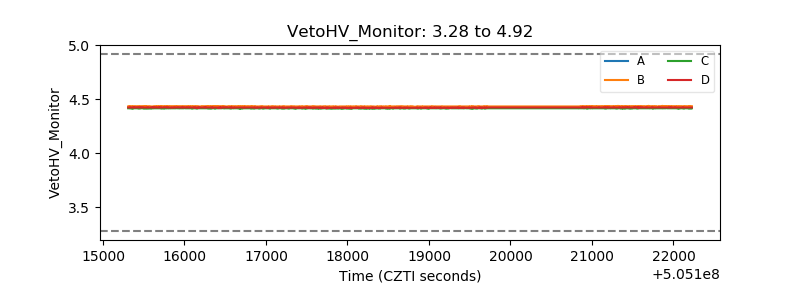 |
| Veto LLD | 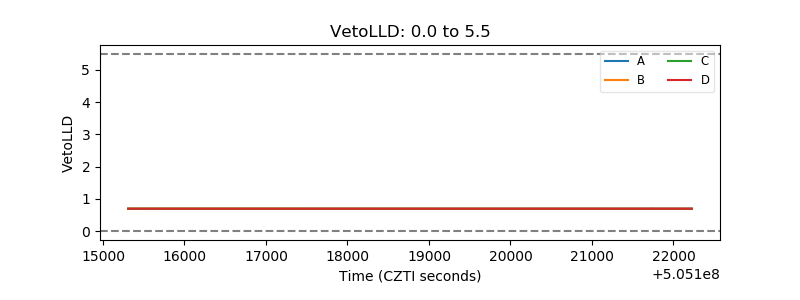 |
| Alpha Counter | 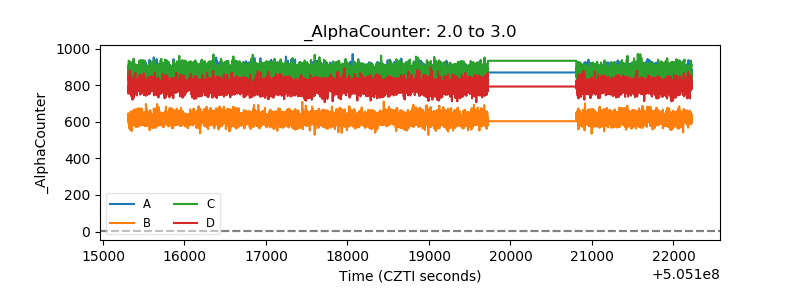 |
| _CPM_Rate | 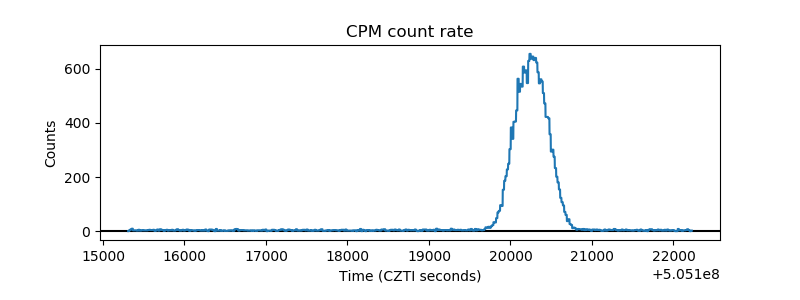 |
| CZT Counter | 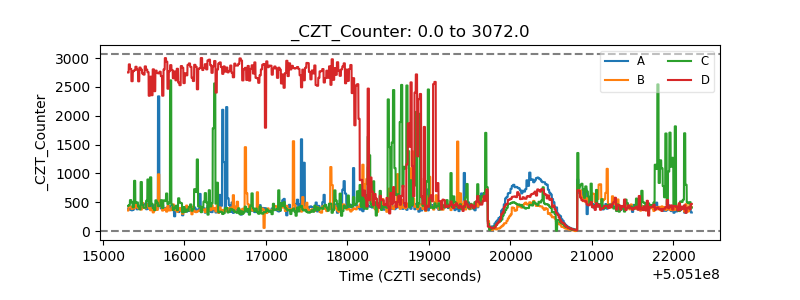 |
| +2.5 Volts monitor | 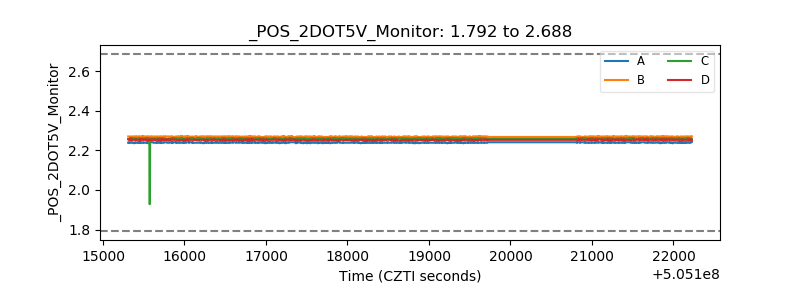 |
| +5 Volts monitor | 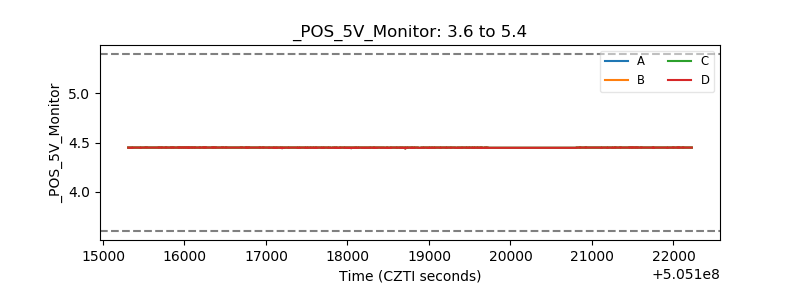 |
| _ROLL_ROT | 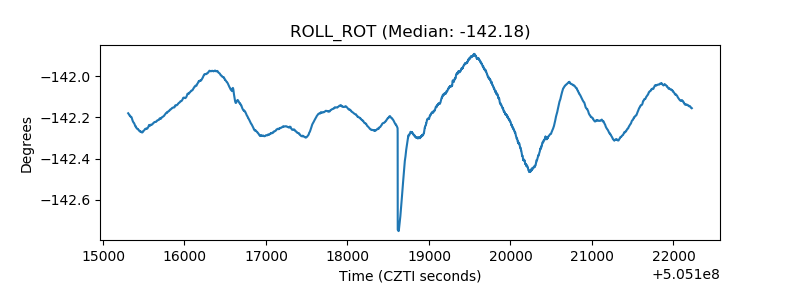 |
| _Roll_DEC | 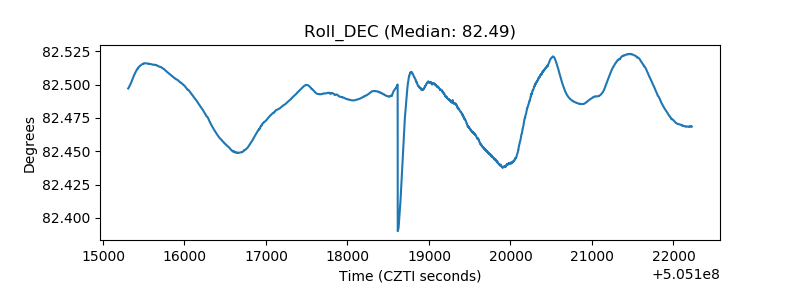 |
| _Roll_RA | 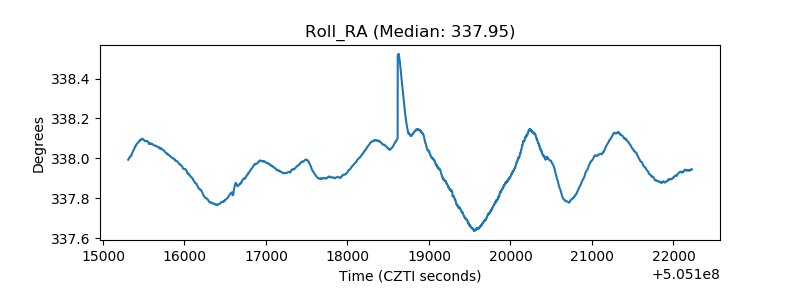 |
| Veto Counter | 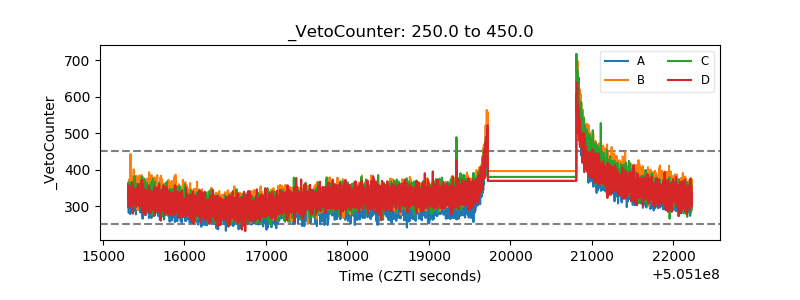 |