| Param | Original file | Final file |
|---|---|---|
| Filename | modeM0/AS1A14_021T06_9000006538_55548cztM0_level2.fits | modeM0/AS1A14_021T06_9000006538_55548cztM0_level2_quad_clean.evt |
| Size (bytes) | 398,160,000 | 87,287,040 |
| Size | 379.7 MB | 83.2 MB |
| Events in quadrant A | 2,802,078 | 587,091 |
| Events in quadrant B | 3,002,411 | 630,732 |
| Events in quadrant C | 2,991,269 | 546,864 |
| Events in quadrant D | 5,473,978 | 458,212 |
| Mode M9 | |||
|---|---|---|---|
| Quadrant | BADHDUFLAG | Total packets | Discarded packets |
| A | 0 | 11 | 0 |
| B | 0 | 11 | 0 |
| C | 0 | 11 | 0 |
| D | 0 | 11 | 0 |
| Mode M0 | |||
|---|---|---|---|
| Quadrant | BADHDUFLAG | Total packets | Discarded packets |
| A | 0 | 12903 | 49 |
| B | 0 | 13393 | 32 |
| C | 0 | 13474 | 65 |
| D | 0 | 20930 | 410 |
| Mode SS | |||
|---|---|---|---|
| Quadrant | BADHDUFLAG | Total packets | Discarded packets |
| A | 0 | 122 | 2 |
| B | 0 | 122 | 0 |
| C | 0 | 122 | 0 |
| D | 0 | 122 | 0 |
| Quadrant | Total seconds | Saturated seconds | Saturation percentage |
|---|---|---|---|
| A | 6028 | 107 | 1.775050% |
| B | 6036 | 109 | 1.805832% |
| C | 6022 | 98 | 1.627366% |
| D | 5988 | 865 | 14.445558% |
Noise dominated data is calculated using 1-second bins in cleaned event files. If a bin has >2000 counts, and if more than 50% of those come from <1% of pixels, then it is considered to be noise-dominated and hence unusable.
| Quadrant | # 1 sec bins | Bins with >0 counts | Bins with >2000 counts | High rate bins dominated by noise | Noise dominated (total time) | Noise dominated (detector-on time) | Marked lightcurve |
|---|---|---|---|---|---|---|---|
| A | 7151 | 6050 | 31 | 31 | 0.43% | 0.51% | 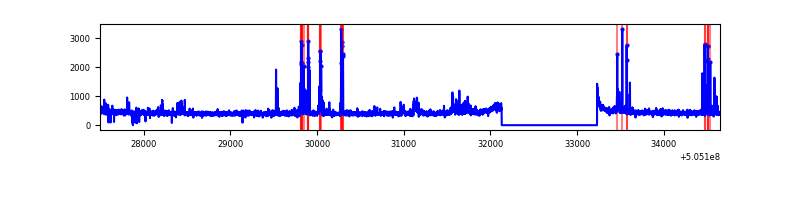 |
| B | 7151 | 6049 | 19 | 19 | 0.27% | 0.31% | 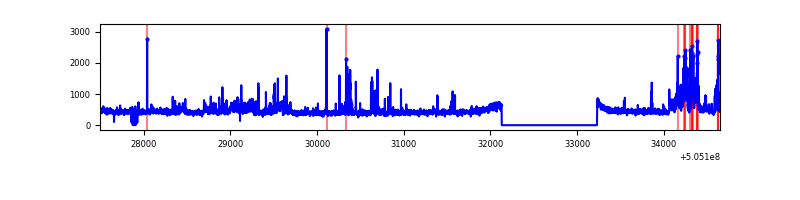 |
| C | 7151 | 6049 | 53 | 53 | 0.74% | 0.88% | 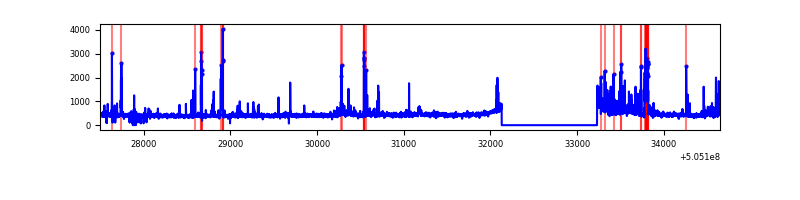 |
| D | 7151 | 6015 | 827 | 827 | 11.56% | 13.75% | 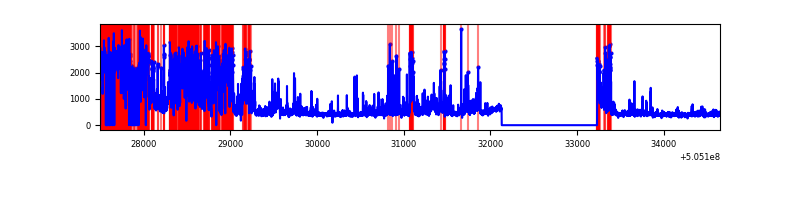 |
Top three noisy pixels from each quadrant. If the there are fewer than three noisy pixels in the level2.evt file, extra rows are filled as -1
| Pixel properties | Quadrant properties | ||||||
|---|---|---|---|---|---|---|---|
| Quadrant | DetID | PixID | Counts | Sigma | Mean | Median | Sigma |
| A | 0 | 8 | 160891 | 1009.23 | 637 | 621 | 158.8 |
| A | 15 | 32 | 82110 | 513.14 | 637 | 621 | 158.8 |
| A | 4 | 239 | 28568 | 175.98 | 637 | 621 | 158.8 |
| B | 4 | 206 | 444698 | 3292.06 | 625 | 601 | 134.9 |
| B | 10 | 247 | 27544 | 199.73 | 625 | 601 | 134.9 |
| B | 7 | 252 | 23264 | 168.0 | 625 | 601 | 134.9 |
| C | 9 | 38 | 209741 | 1258.95 | 606 | 598 | 166.1 |
| C | 13 | 3 | 147414 | 883.77 | 606 | 598 | 166.1 |
| C | 1 | 16 | 127921 | 766.43 | 606 | 598 | 166.1 |
| D | 11 | 129 | 2775721 | 16916.93 | 576 | 550 | 164.0 |
| D | 8 | 160 | 178678 | 1085.84 | 576 | 550 | 164.0 |
| D | 2 | 172 | 74819 | 452.73 | 576 | 550 | 164.0 |
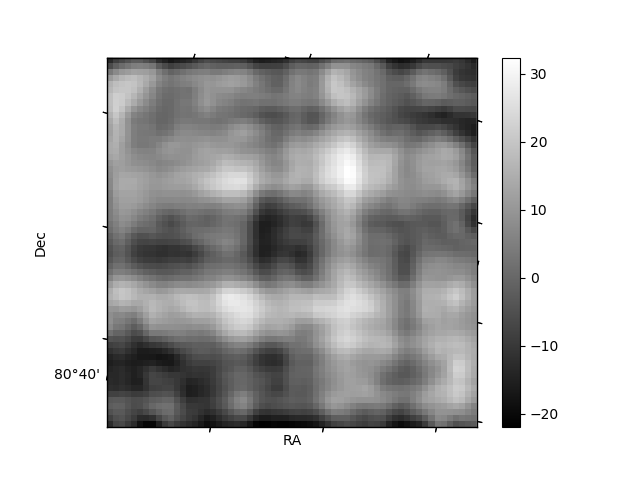
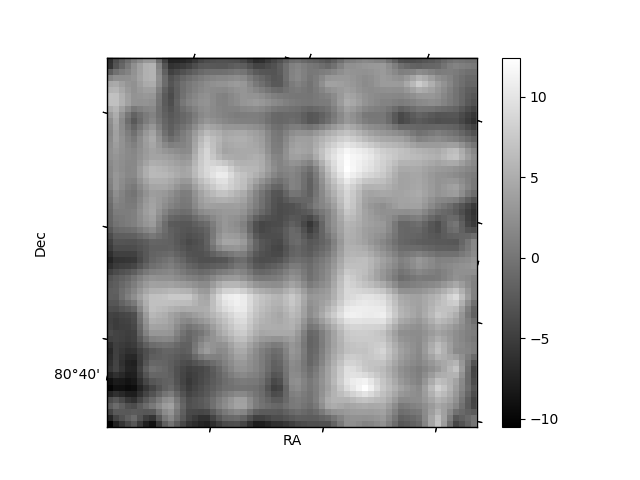
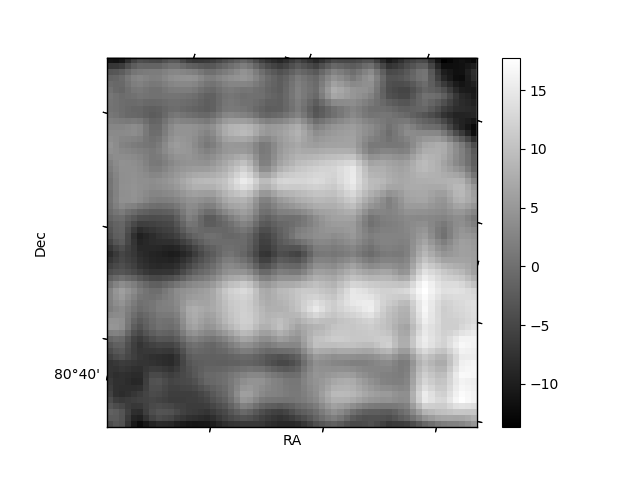
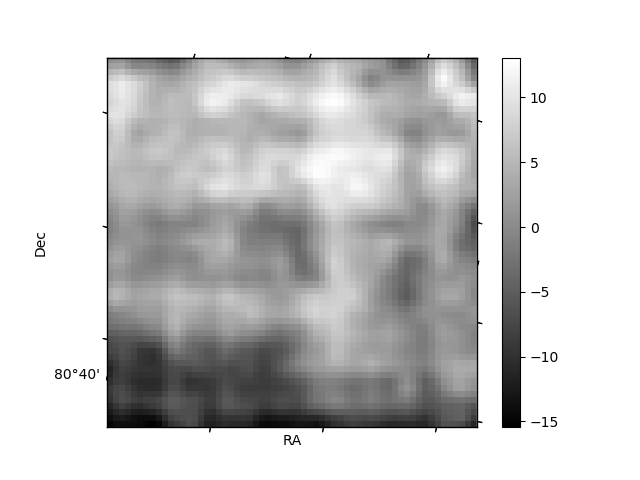
Histogram calculated using DETX and DETY for each event in the final _common_clean file
| Quadrant A | 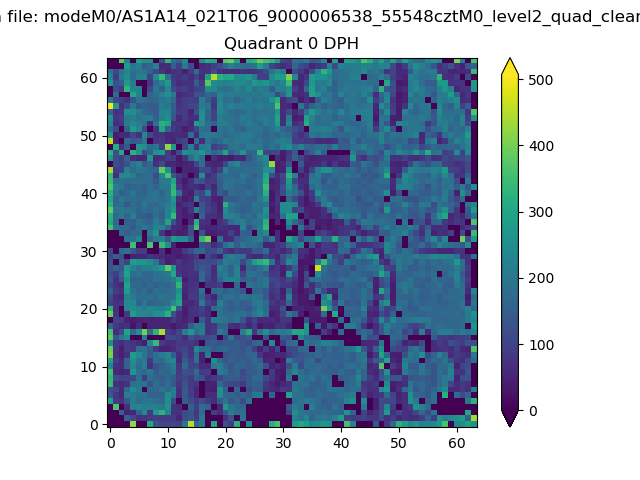 |
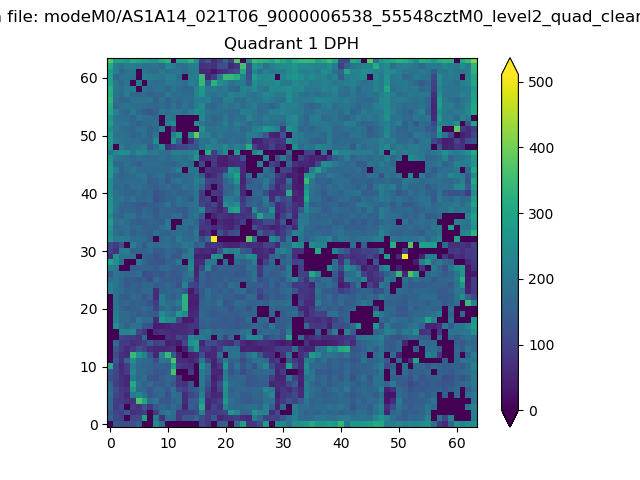 |
Quadrant B |
|---|---|---|---|
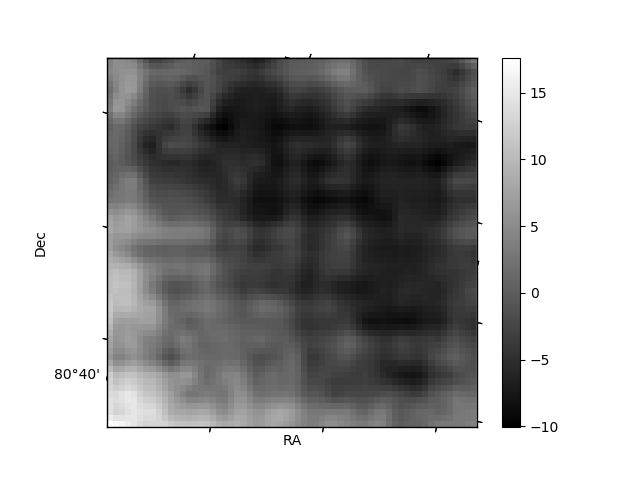
| Quadrant D | 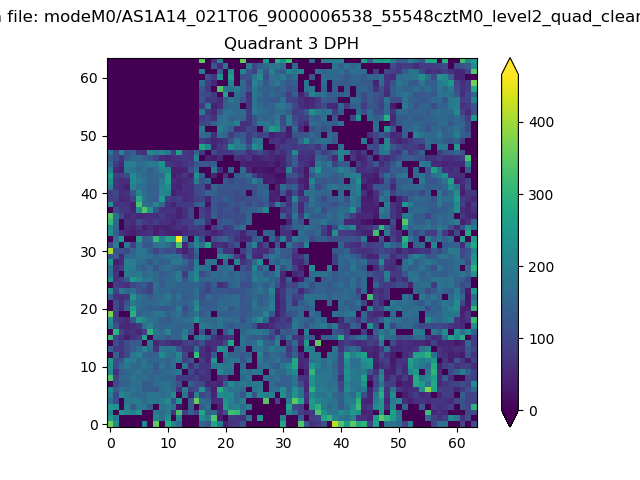 |
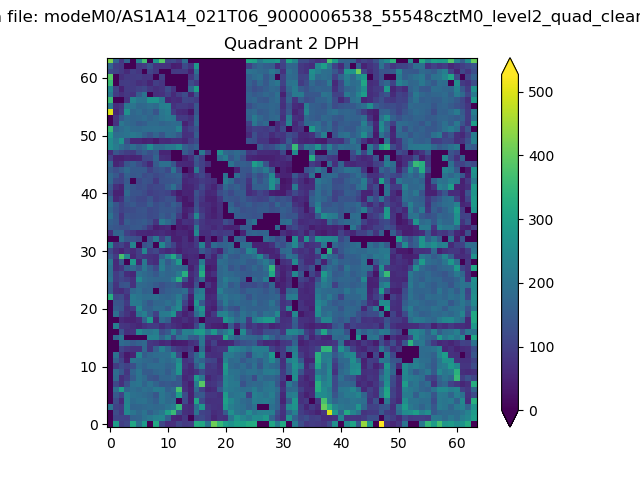 |
Quadrant C |
| Plot type | Count rate plots | Images |
|---|---|---|
| Comparison with Poisson distribution Blue bars denote a histogram of data divided into 1 sec bins. Red curve is a Poisson curve with rate = median count rate of data. |
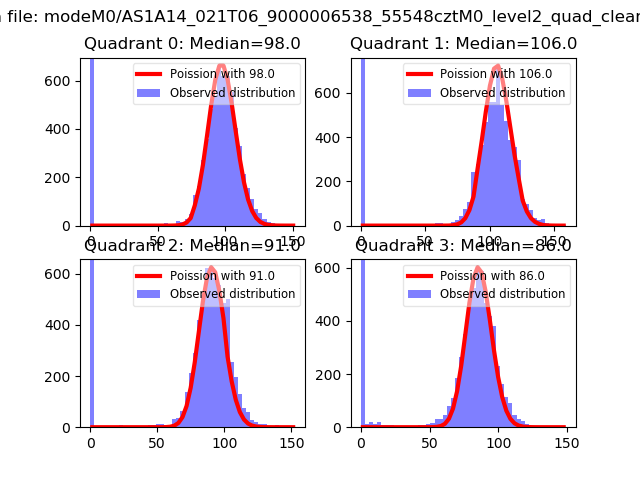 |
 |
| Quadrant-wise count rates Data is divided into 100 sec bins |
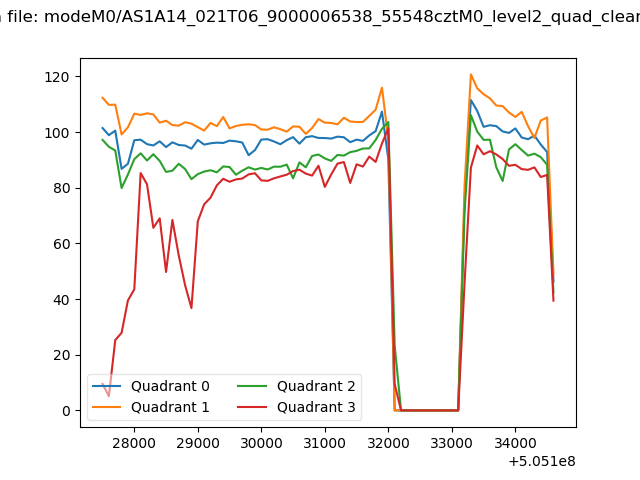 |
|
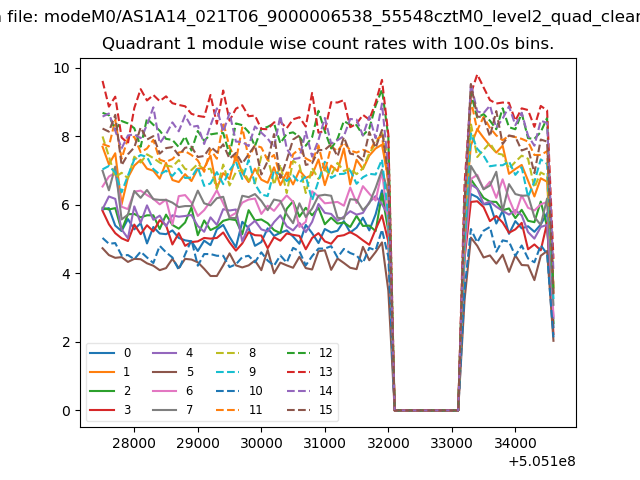
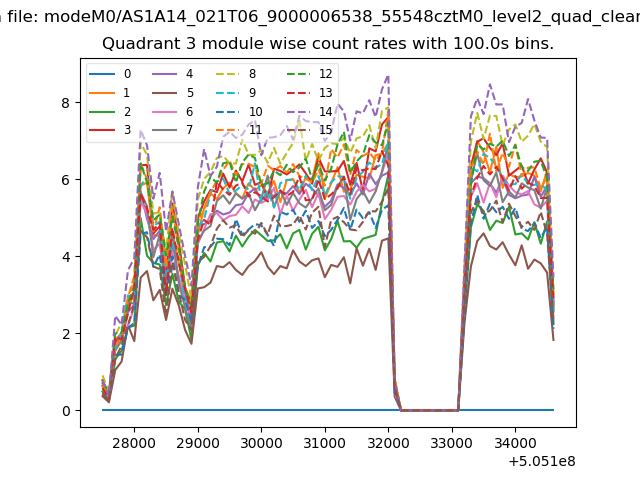
| Module-wise count rates for Quadrant A Data is divided into 100 sec bins |
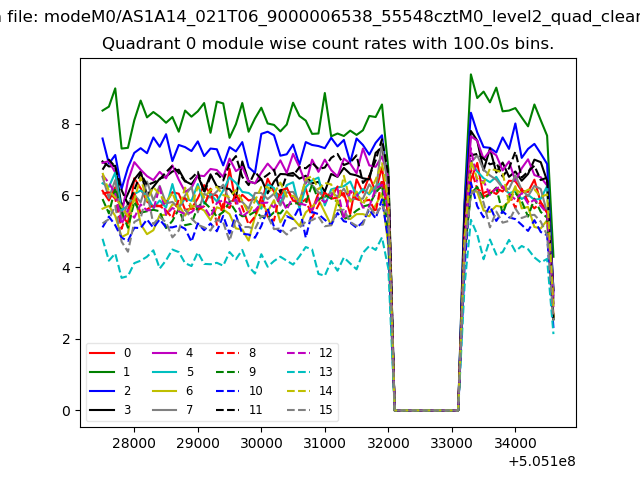 |
 |
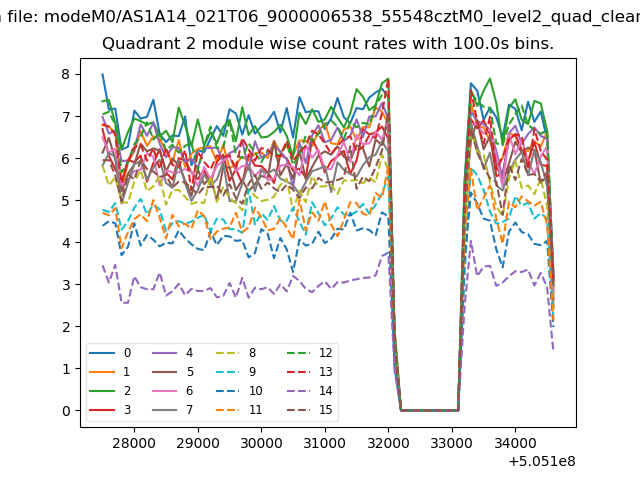
| Module-wise count rates for Quadrant B Data is divided into 100 sec bins |
 |
 |
| Module-wise count rates for Quadrant C Data is divided into 100 sec bins |
 |
 |
| Module-wise count rates for Quadrant D Data is divided into 100 sec bins |
 |
 |
| Parameter | Plot |
|---|---|
| CZT HV Monitor |  |
| D_VDD | 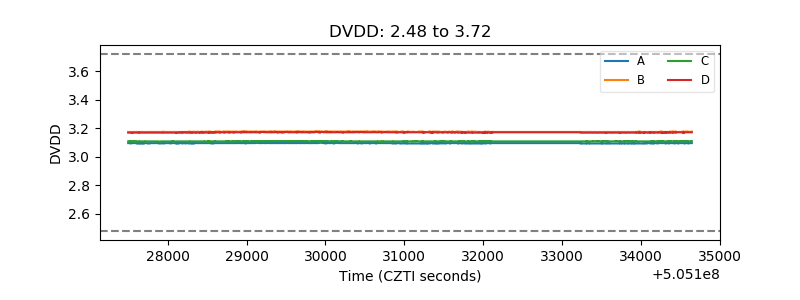 |
| Temperature 1 | 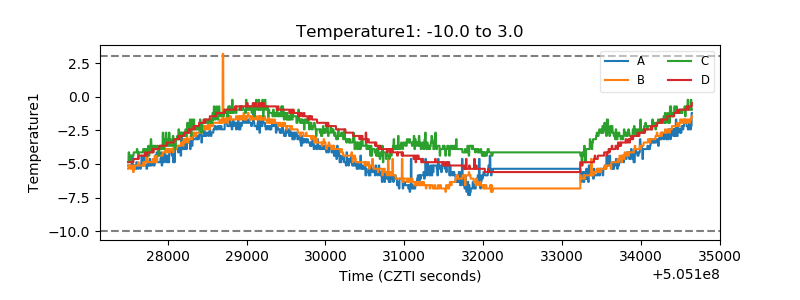 |
| Veto HV Monitor | 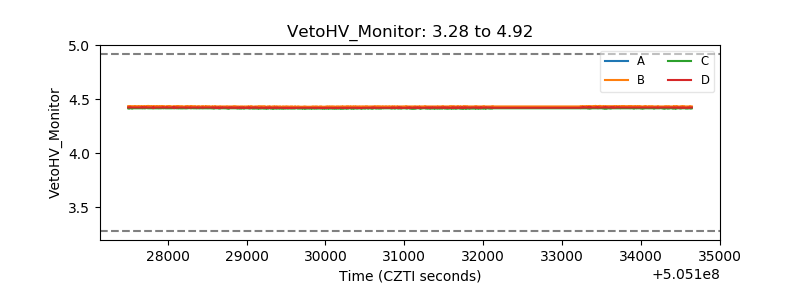 |
| Veto LLD | 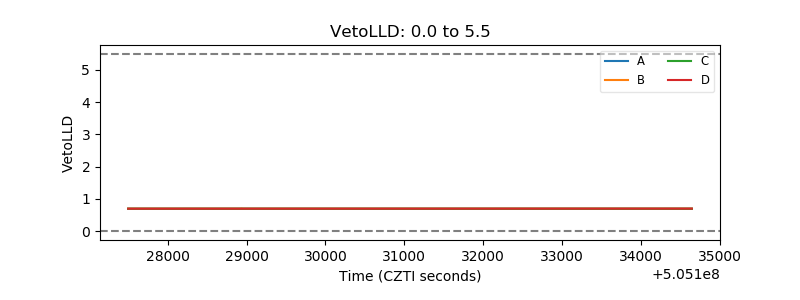 |
| Alpha Counter | 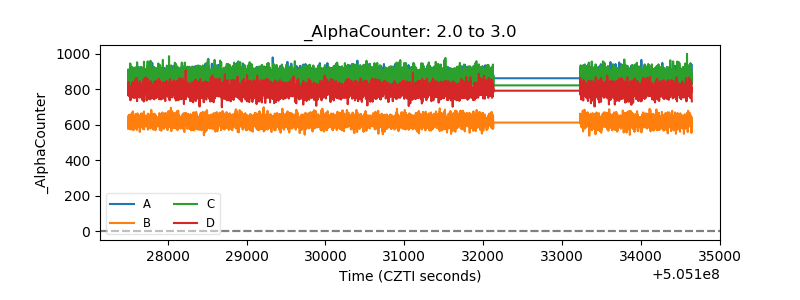 |
| _CPM_Rate | 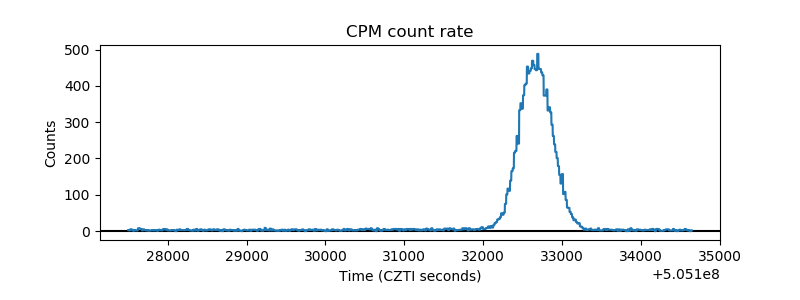 |
| CZT Counter | 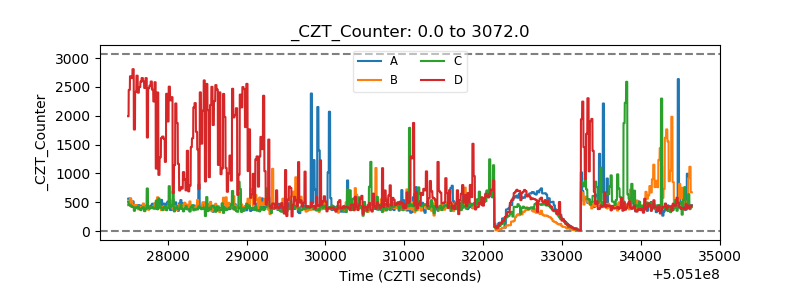 |
| +2.5 Volts monitor | 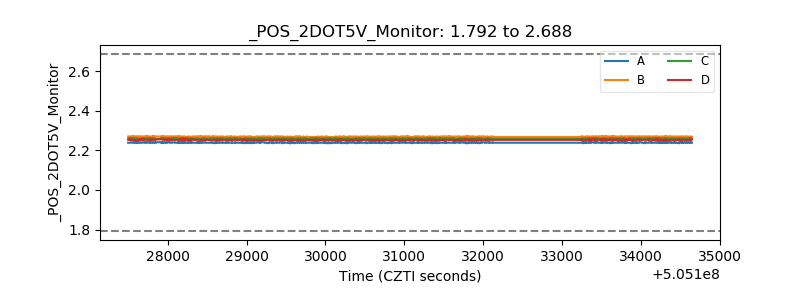 |
| +5 Volts monitor | 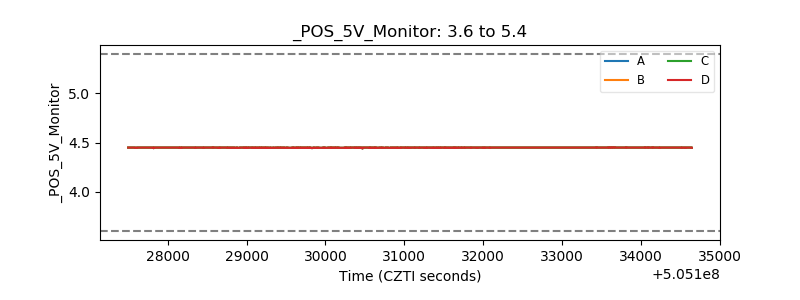 |
| _ROLL_ROT | 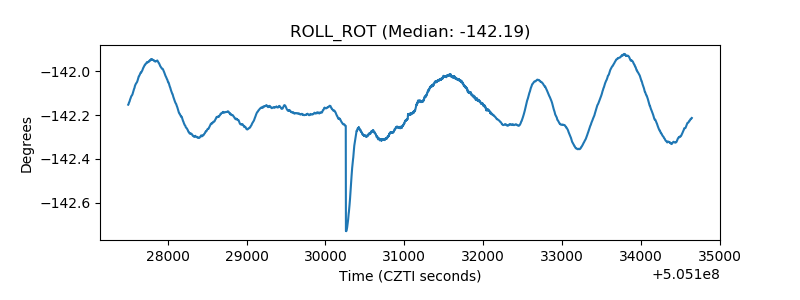 |
| _Roll_DEC | 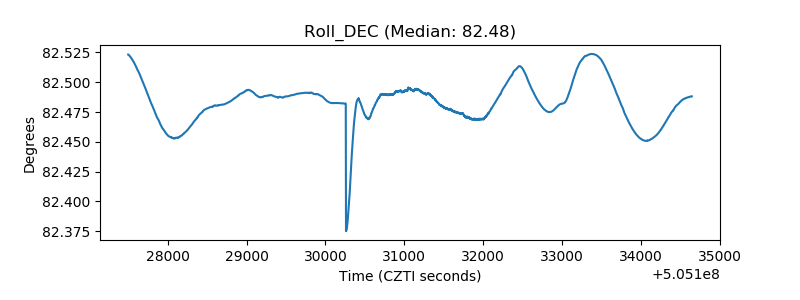 |
| _Roll_RA | 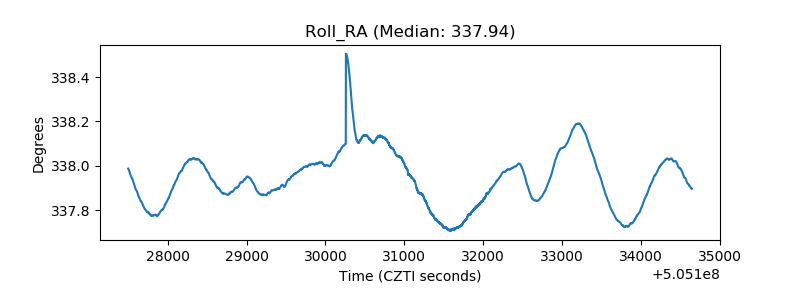 |
| Veto Counter | 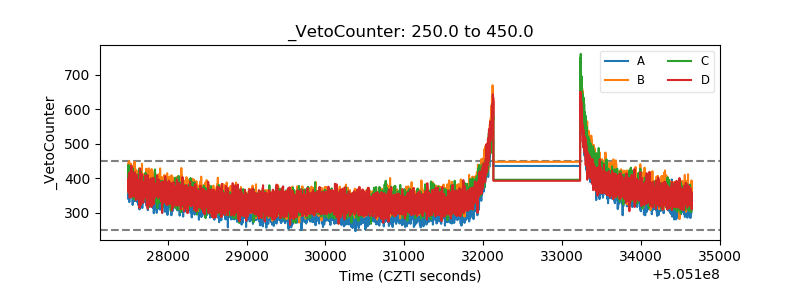 |