| Param | Original file | Final file |
|---|---|---|
| Filename | modeM0/AS1A14_021T06_9000006538_55549cztM0_level2.fits | modeM0/AS1A14_021T06_9000006538_55549cztM0_level2_quad_clean.evt |
| Size (bytes) | 357,566,400 | 75,885,120 |
| Size | 341.0 MB | 72.4 MB |
| Events in quadrant A | 2,428,342 | 506,057 |
| Events in quadrant B | 3,611,572 | 520,598 |
| Events in quadrant C | 3,501,467 | 454,345 |
| Events in quadrant D | 3,280,079 | 444,905 |
| Mode M9 | |||
|---|---|---|---|
| Quadrant | BADHDUFLAG | Total packets | Discarded packets |
| A | 0 | 10 | 0 |
| B | 0 | 10 | 0 |
| C | 0 | 10 | 0 |
| D | 0 | 11 | 0 |
| Mode M0 | |||
|---|---|---|---|
| Quadrant | BADHDUFLAG | Total packets | Discarded packets |
| A | 0 | 12313 | 1007 |
| B | 0 | 15884 | 1471 |
| C | 0 | 15654 | 1507 |
| D | 0 | 14853 | 1278 |
| Mode SS | |||
|---|---|---|---|
| Quadrant | BADHDUFLAG | Total packets | Discarded packets |
| A | 0 | 114 | 4 |
| B | 0 | 114 | 12 |
| C | 0 | 114 | 10 |
| D | 0 | 114 | 10 |
| Quadrant | Total seconds | Saturated seconds | Saturation percentage |
|---|---|---|---|
| A | 5351 | 72 | 1.345543% |
| B | 5266 | 211 | 4.006836% |
| C | 5291 | 276 | 5.216405% |
| D | 5328 | 176 | 3.303303% |
Noise dominated data is calculated using 1-second bins in cleaned event files. If a bin has >2000 counts, and if more than 50% of those come from <1% of pixels, then it is considered to be noise-dominated and hence unusable.
| Quadrant | # 1 sec bins | Bins with >0 counts | Bins with >2000 counts | High rate bins dominated by noise | Noise dominated (total time) | Noise dominated (detector-on time) | Marked lightcurve |
|---|---|---|---|---|---|---|---|
| A | 7627 | 5667 | 17 | 17 | 0.22% | 0.30% | 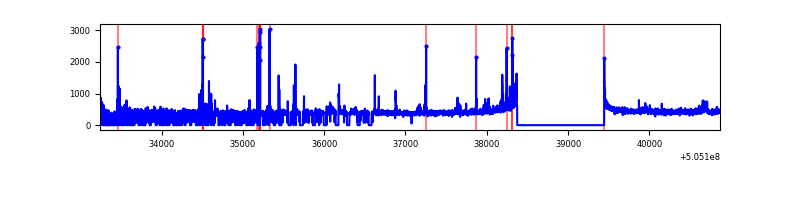 |
| B | 7624 | 5617 | 107 | 107 | 1.40% | 1.90% | 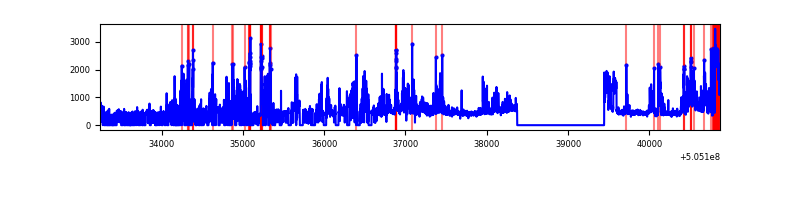 |
| C | 7625 | 5605 | 235 | 235 | 3.08% | 4.19% | 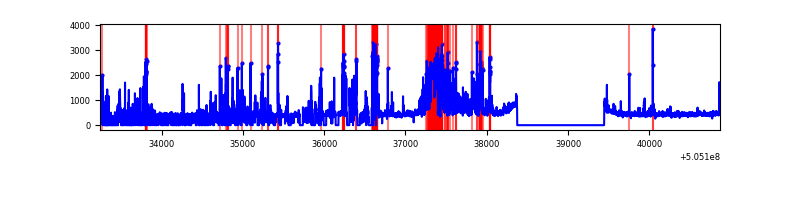 |
| D | 7626 | 5650 | 121 | 121 | 1.59% | 2.14% | 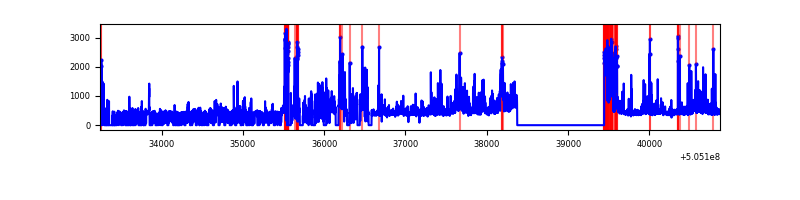 |
Top three noisy pixels from each quadrant. If the there are fewer than three noisy pixels in the level2.evt file, extra rows are filled as -1
| Pixel properties | Quadrant properties | ||||||
|---|---|---|---|---|---|---|---|
| Quadrant | DetID | PixID | Counts | Sigma | Mean | Median | Sigma |
| A | 0 | 8 | 101044 | 721.72 | 562 | 547 | 139.2 |
| A | 4 | 159 | 49046 | 348.3 | 562 | 547 | 139.2 |
| A | 3 | 78 | 23390 | 164.05 | 562 | 547 | 139.2 |
| B | 4 | 206 | 1281436 | 11205.63 | 540 | 522 | 114.3 |
| B | 10 | 247 | 80064 | 695.85 | 540 | 522 | 114.3 |
| B | 7 | 252 | 47780 | 413.42 | 540 | 522 | 114.3 |
| C | 9 | 38 | 942236 | 6471.28 | 526 | 519 | 145.5 |
| C | 13 | 3 | 192087 | 1316.41 | 526 | 519 | 145.5 |
| C | 1 | 16 | 126569 | 866.19 | 526 | 519 | 145.5 |
| D | 11 | 129 | 464494 | 3053.08 | 535 | 512 | 152.0 |
| D | 8 | 160 | 203408 | 1335.09 | 535 | 512 | 152.0 |
| D | 3 | 12 | 172600 | 1132.37 | 535 | 512 | 152.0 |
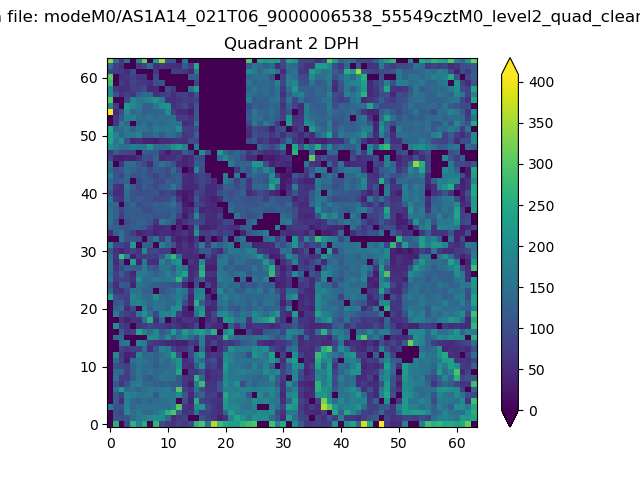
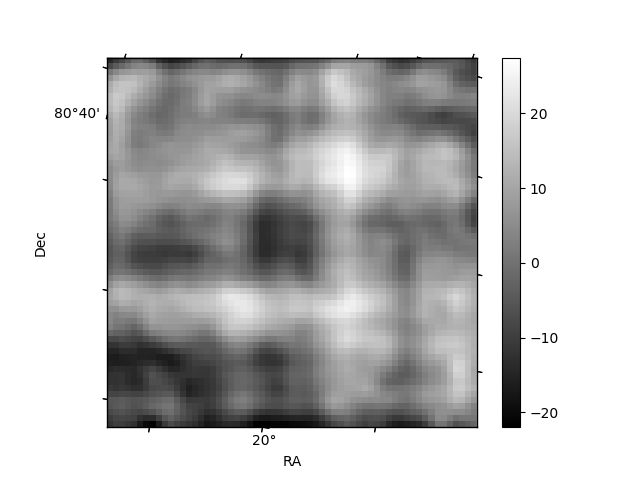
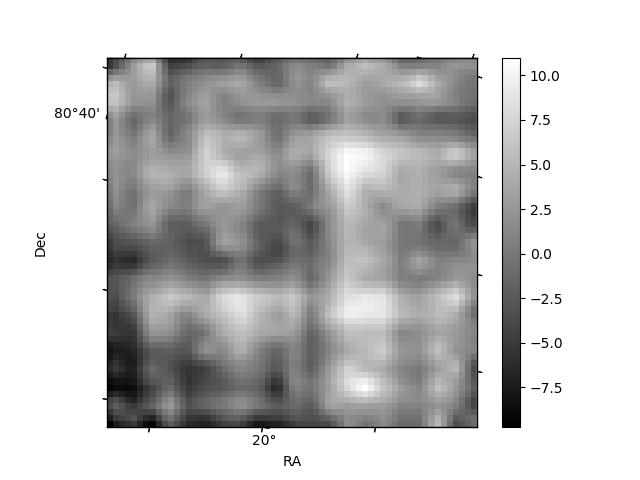
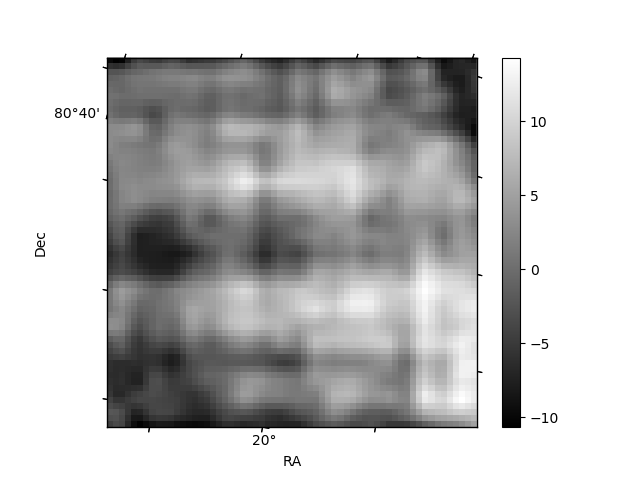
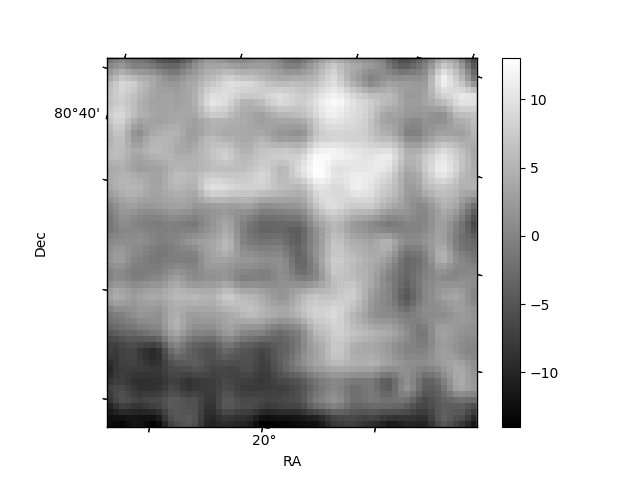
Histogram calculated using DETX and DETY for each event in the final _common_clean file
| Quadrant A | 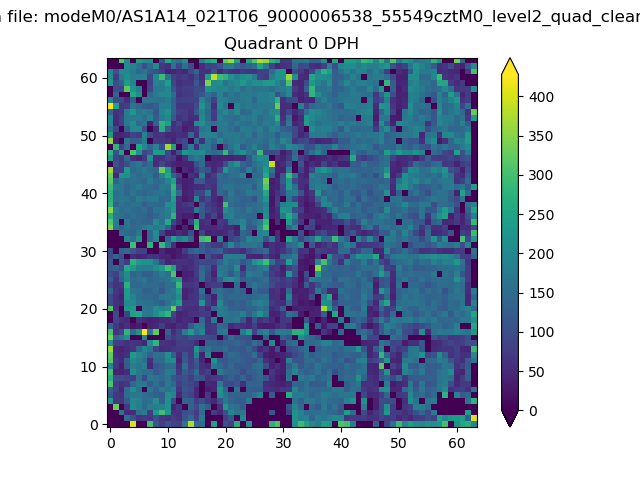 |
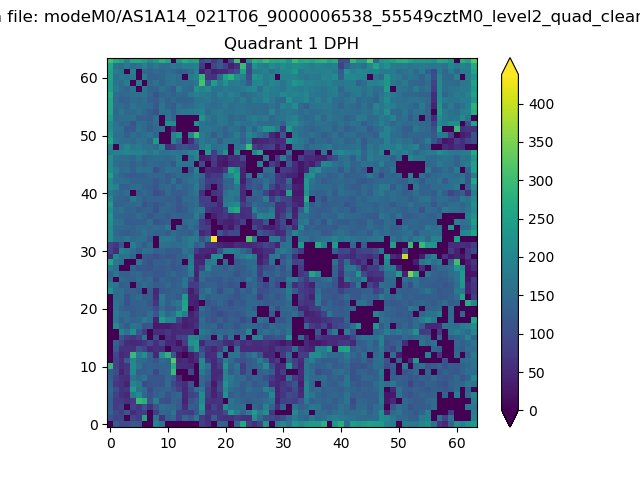 |
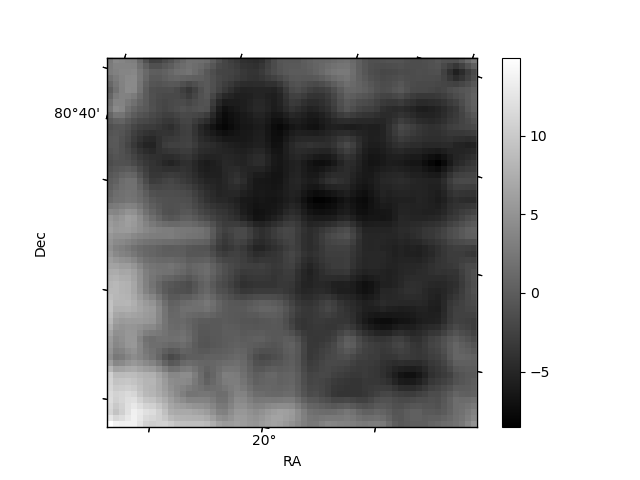
Quadrant B |
|---|---|---|---|
| Quadrant D | 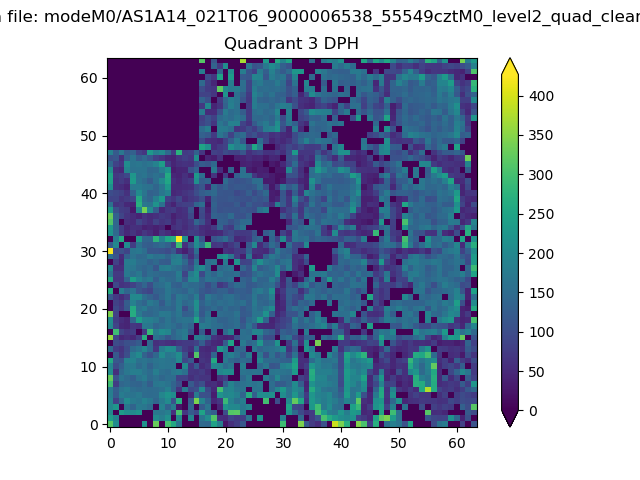 |
 |
Quadrant C |
| Plot type | Count rate plots | Images |
|---|---|---|
| Comparison with Poisson distribution Blue bars denote a histogram of data divided into 1 sec bins. Red curve is a Poisson curve with rate = median count rate of data. |
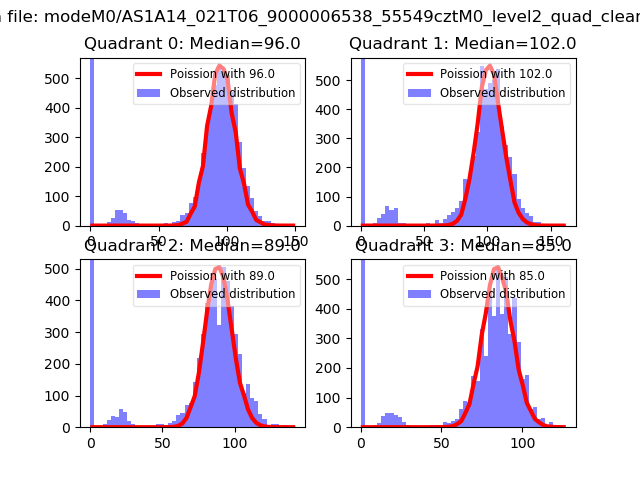 |
 |
| Quadrant-wise count rates Data is divided into 100 sec bins |
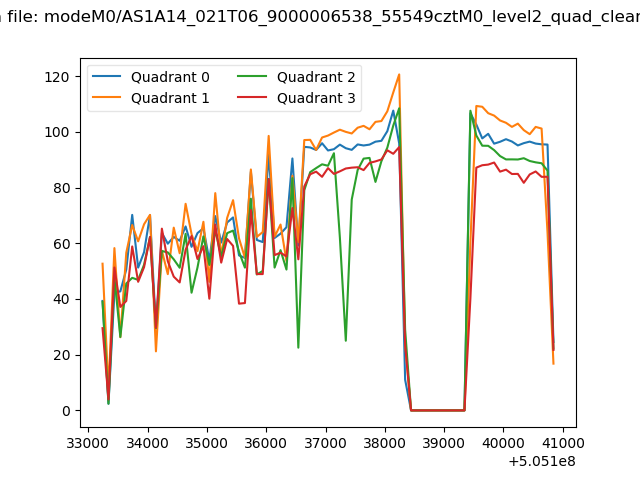 |
|
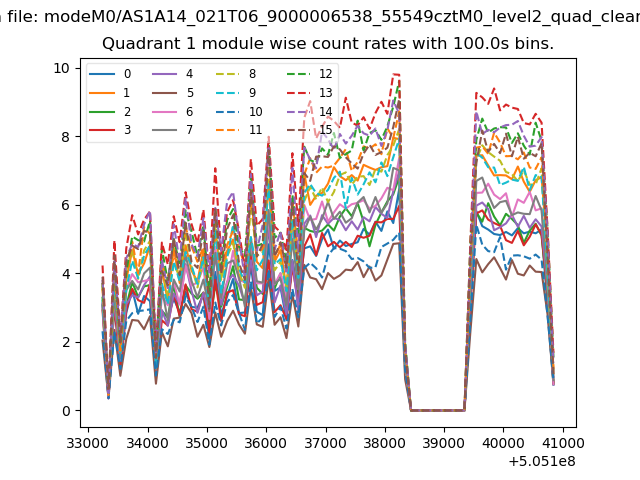
| Module-wise count rates for Quadrant A Data is divided into 100 sec bins |
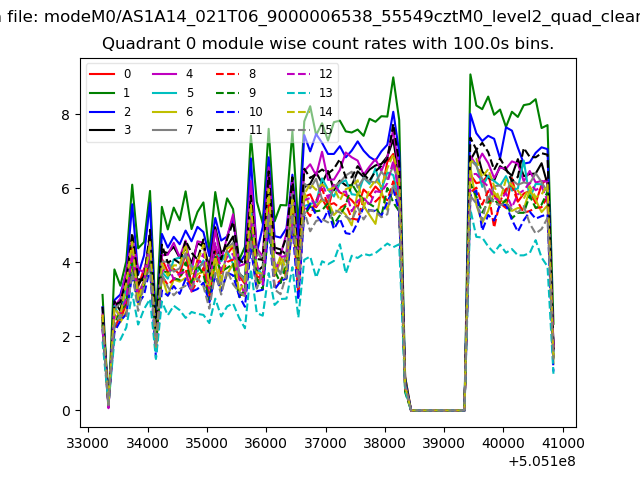 |
 |
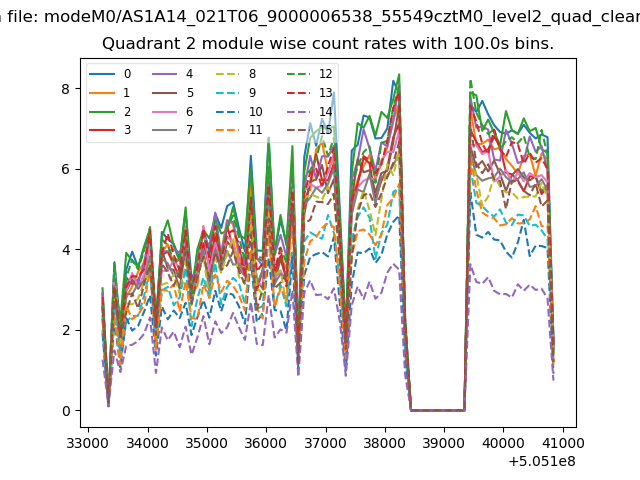
| Module-wise count rates for Quadrant B Data is divided into 100 sec bins |
 |
 |
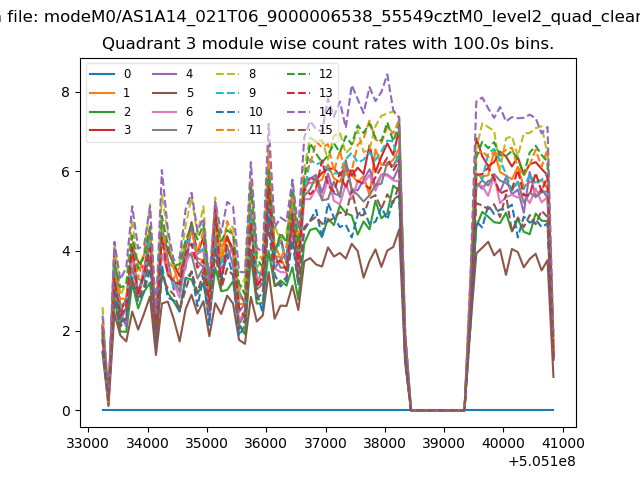
| Module-wise count rates for Quadrant C Data is divided into 100 sec bins |
 |
 |
| Module-wise count rates for Quadrant D Data is divided into 100 sec bins |
 |
 |
| Parameter | Plot |
|---|---|
| CZT HV Monitor | 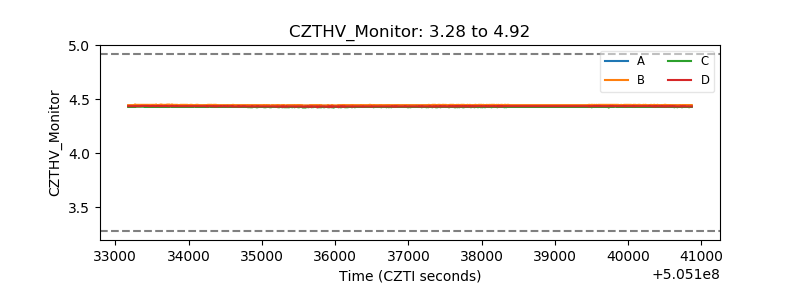 |
| D_VDD | 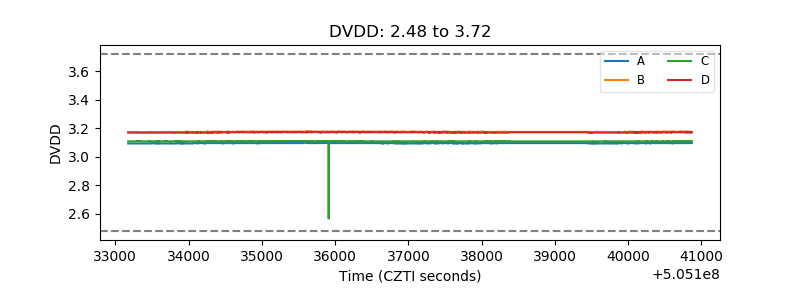 |
| Temperature 1 | 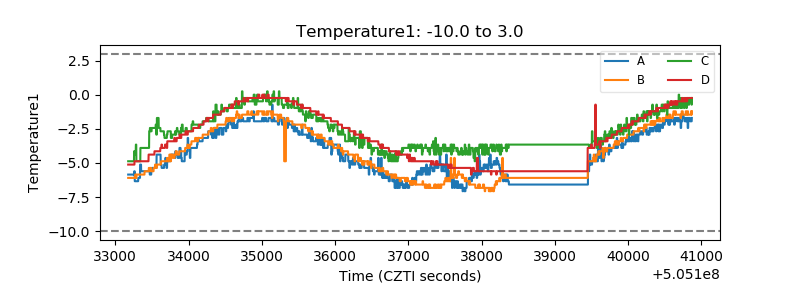 |
| Veto HV Monitor | 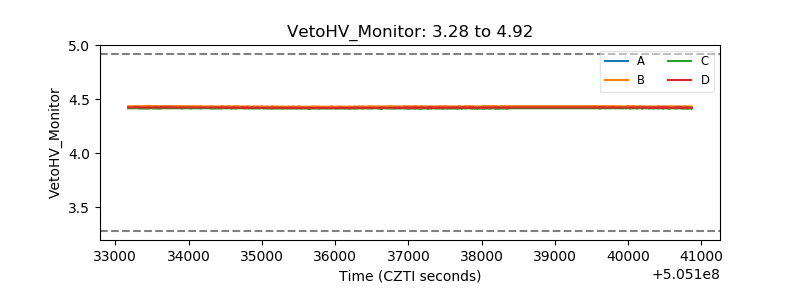 |
| Veto LLD | 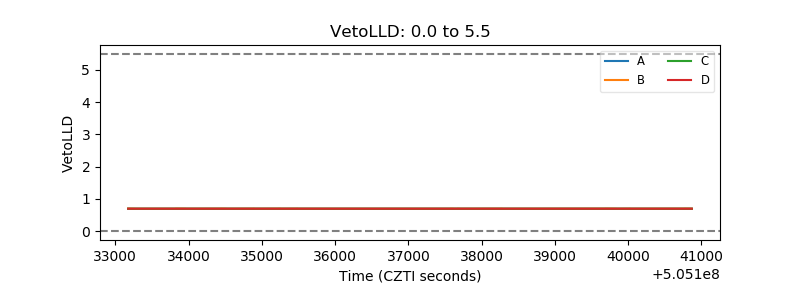 |
| Alpha Counter | 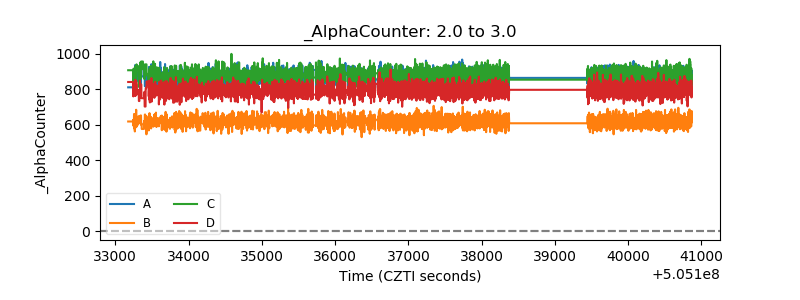 |
| _CPM_Rate |  |
| CZT Counter | 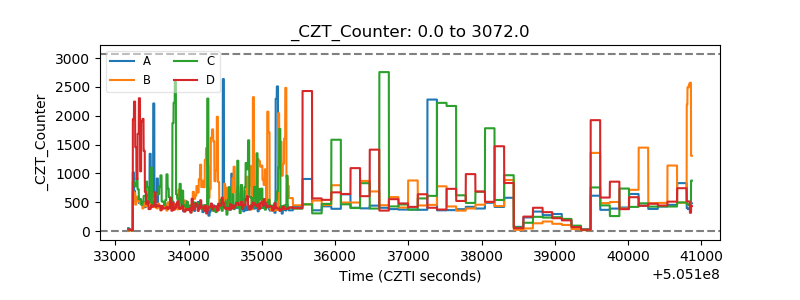 |
| +2.5 Volts monitor |  |
| +5 Volts monitor |  |
| _ROLL_ROT | 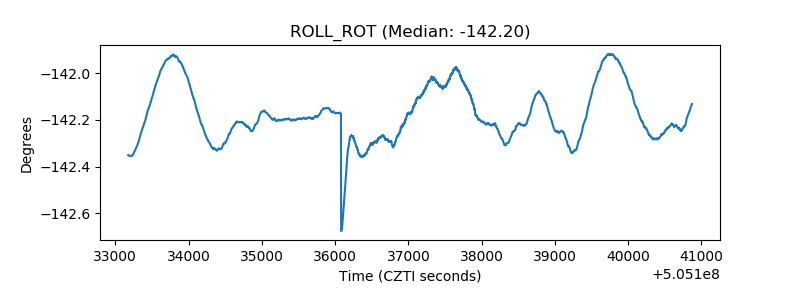 |
| _Roll_DEC | 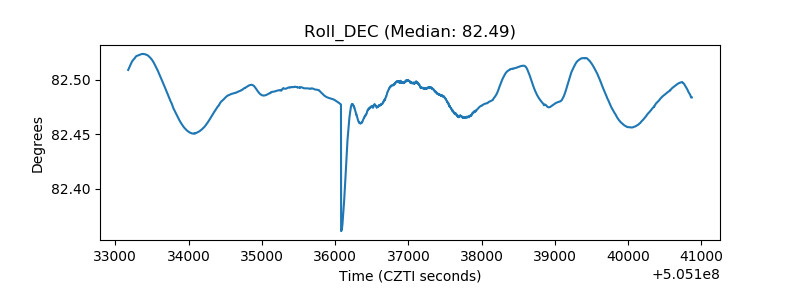 |
| _Roll_RA | 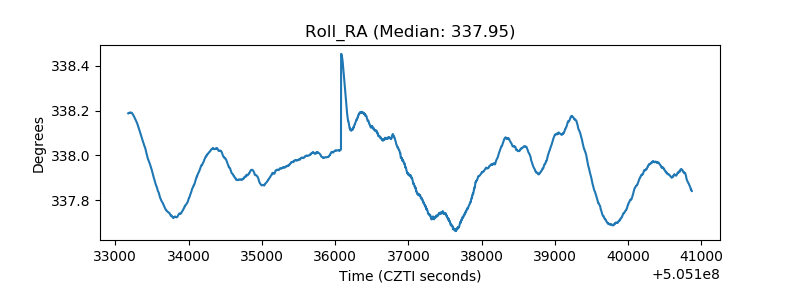 |
| Veto Counter | 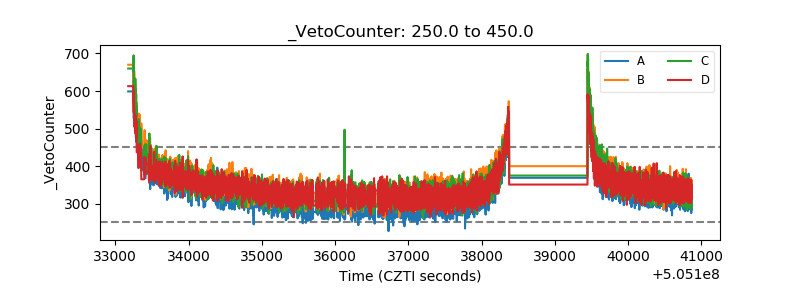 |