| Param | Original file | Final file |
|---|---|---|
| Filename | modeM0/AS1A14_021T06_9000006538_55551cztM0_level2.fits | modeM0/AS1A14_021T06_9000006538_55551cztM0_level2_quad_clean.evt |
| Size (bytes) | 510,433,920 | 98,343,360 |
| Size | 486.8 MB | 93.8 MB |
| Events in quadrant A | 4,507,515 | 638,126 |
| Events in quadrant B | 3,548,239 | 712,619 |
| Events in quadrant C | 5,538,754 | 553,462 |
| Events in quadrant D | 4,741,995 | 573,160 |
| Mode M9 | |||
|---|---|---|---|
| Quadrant | BADHDUFLAG | Total packets | Discarded packets |
| A | 0 | 3 | 0 |
| B | 0 | 3 | 0 |
| C | 0 | 3 | 0 |
| D | 0 | 3 | 0 |
| Mode M0 | |||
|---|---|---|---|
| Quadrant | BADHDUFLAG | Total packets | Discarded packets |
| A | 0 | 18666 | 1 |
| B | 0 | 15933 | 1 |
| C | 0 | 21629 | 5 |
| D | 0 | 19278 | 1 |
| Mode SS | |||
|---|---|---|---|
| Quadrant | BADHDUFLAG | Total packets | Discarded packets |
| A | 0 | 148 | 0 |
| B | 0 | 148 | 0 |
| C | 0 | 148 | 0 |
| D | 0 | 148 | 0 |
| Quadrant | Total seconds | Saturated seconds | Saturation percentage |
|---|---|---|---|
| A | 7177 | 469 | 6.534764% |
| B | 7177 | 165 | 2.299011% |
| C | 7177 | 973 | 13.557197% |
| D | 7177 | 403 | 5.615160% |
Noise dominated data is calculated using 1-second bins in cleaned event files. If a bin has >2000 counts, and if more than 50% of those come from <1% of pixels, then it is considered to be noise-dominated and hence unusable.
| Quadrant | # 1 sec bins | Bins with >0 counts | Bins with >2000 counts | High rate bins dominated by noise | Noise dominated (total time) | Noise dominated (detector-on time) | Marked lightcurve |
|---|---|---|---|---|---|---|---|
| A | 7527 | 7178 | 400 | 400 | 5.31% | 5.57% | 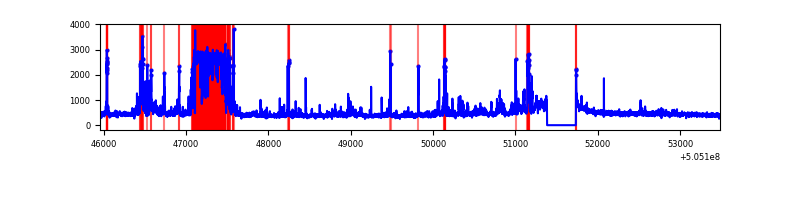 |
| B | 7527 | 7178 | 84 | 84 | 1.12% | 1.17% | 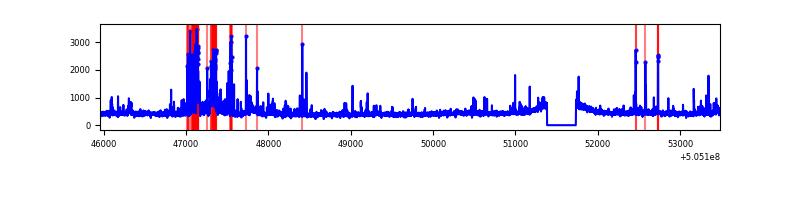 |
| C | 7526 | 7177 | 883 | 883 | 11.73% | 12.30% | 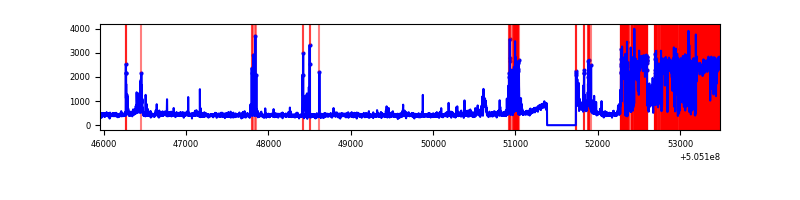 |
| D | 7527 | 7177 | 221 | 221 | 2.94% | 3.08% | 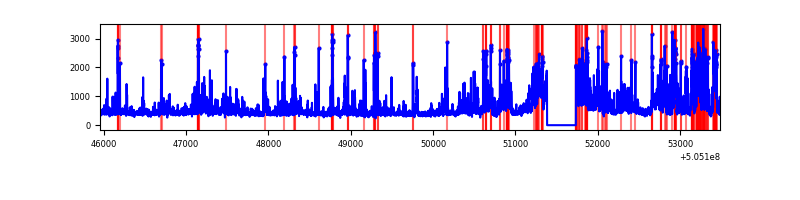 |
Top three noisy pixels from each quadrant. If the there are fewer than three noisy pixels in the level2.evt file, extra rows are filled as -1
| Pixel properties | Quadrant properties | ||||||
|---|---|---|---|---|---|---|---|
| Quadrant | DetID | PixID | Counts | Sigma | Mean | Median | Sigma |
| A | 12 | 115 | 1074517 | 5922.14 | 733 | 716 | 181.3 |
| A | 15 | 32 | 329480 | 1813.17 | 733 | 716 | 181.3 |
| A | 3 | 78 | 139676 | 766.38 | 733 | 716 | 181.3 |
| B | 4 | 206 | 356959 | 2272.96 | 734 | 707 | 156.7 |
| B | 5 | 236 | 99820 | 632.36 | 734 | 707 | 156.7 |
| B | 10 | 247 | 89698 | 567.78 | 734 | 707 | 156.7 |
| C | 9 | 38 | 2286371 | 12357.62 | 673 | 665 | 185.0 |
| C | 1 | 16 | 244123 | 1316.25 | 673 | 665 | 185.0 |
| C | 6 | 223 | 140558 | 756.33 | 673 | 665 | 185.0 |
| D | 11 | 129 | 715335 | 3558.58 | 715 | 682 | 200.8 |
| D | 2 | 249 | 499583 | 2484.25 | 715 | 682 | 200.8 |
| D | 10 | 102 | 179835 | 892.08 | 715 | 682 | 200.8 |
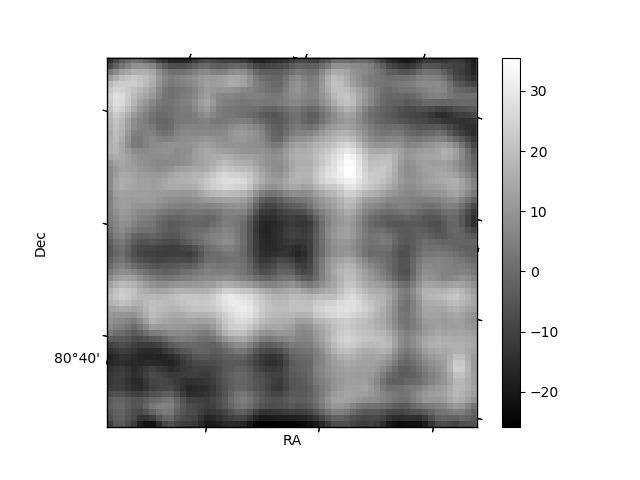
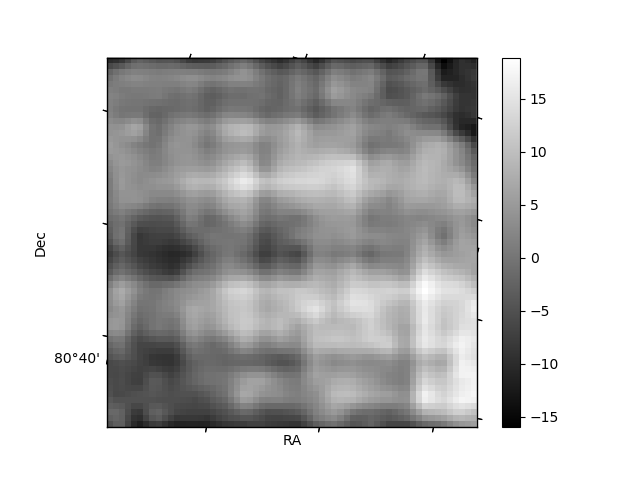
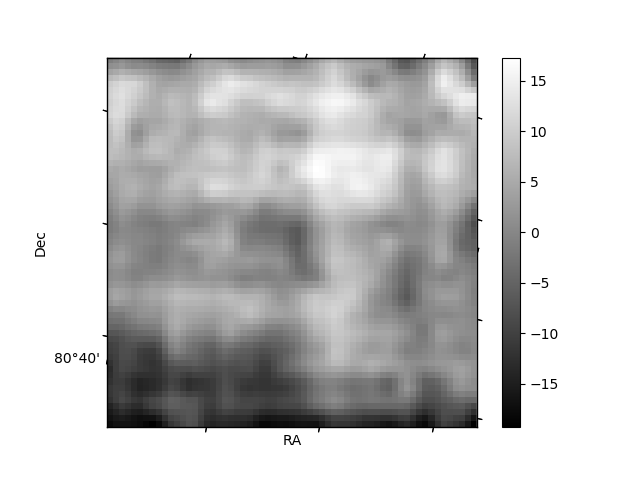
Histogram calculated using DETX and DETY for each event in the final _common_clean file
| Quadrant A | 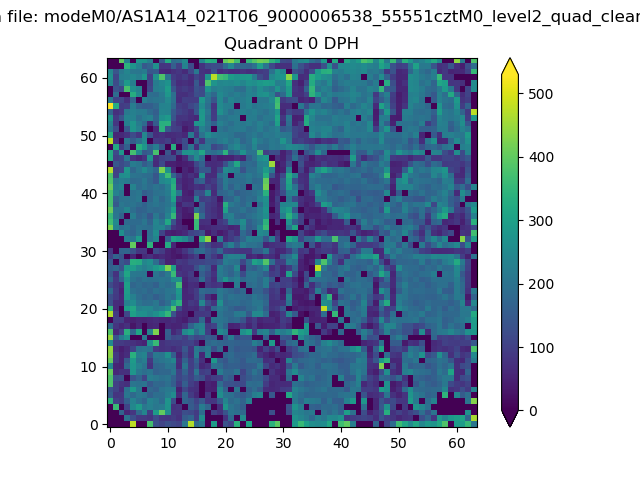 |
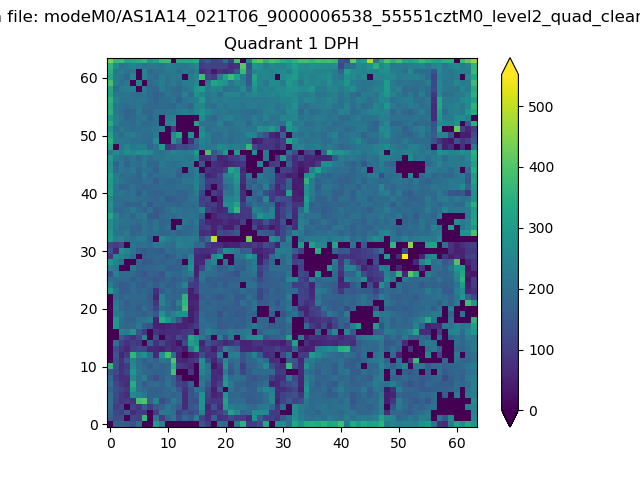 |
Quadrant B |
|---|---|---|---|
| Quadrant D | 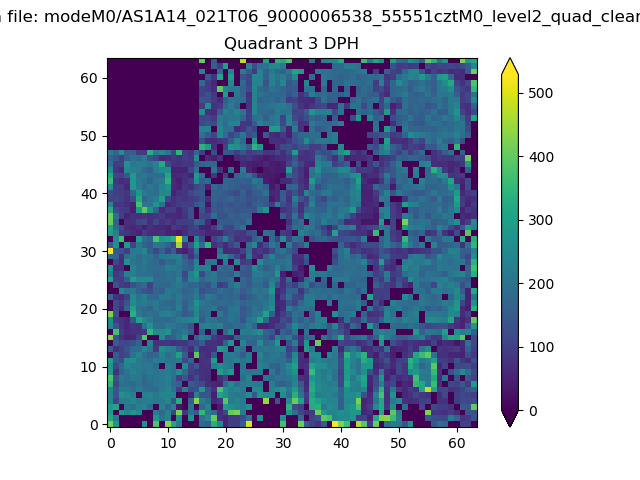 |
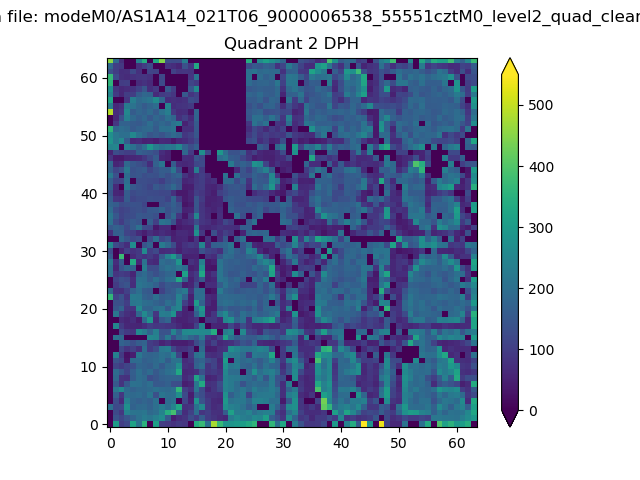 |
Quadrant C |
| Plot type | Count rate plots | Images |
|---|---|---|
| Comparison with Poisson distribution Blue bars denote a histogram of data divided into 1 sec bins. Red curve is a Poisson curve with rate = median count rate of data. |
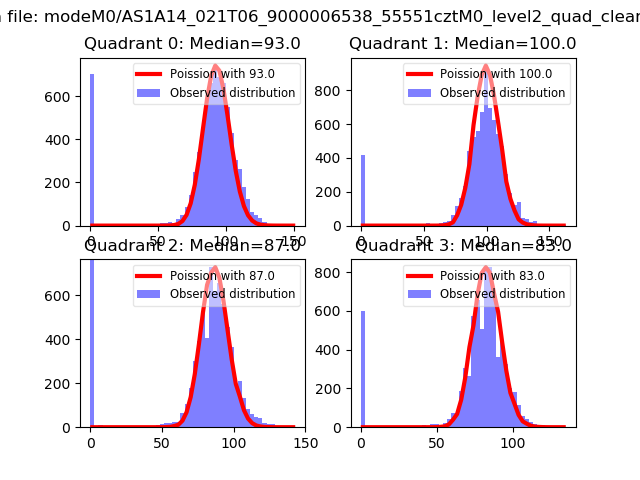 |
 |
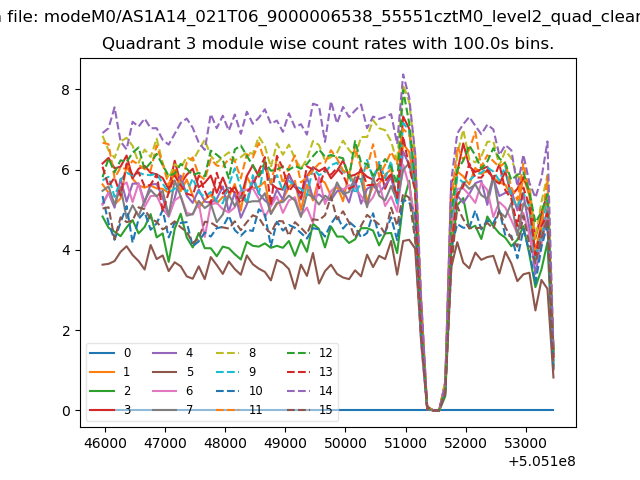
| Quadrant-wise count rates Data is divided into 100 sec bins |
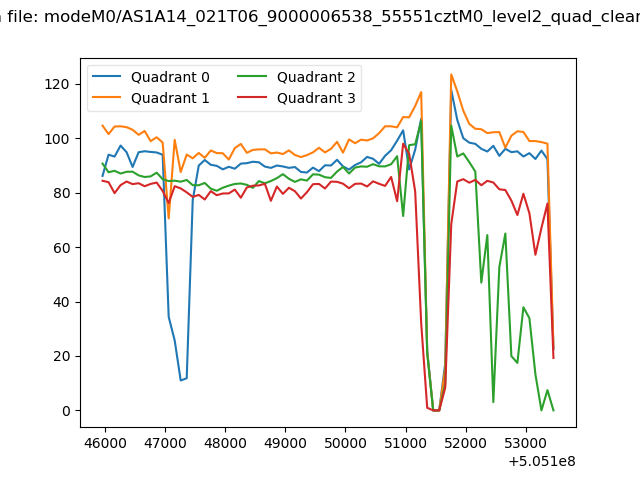 |
|
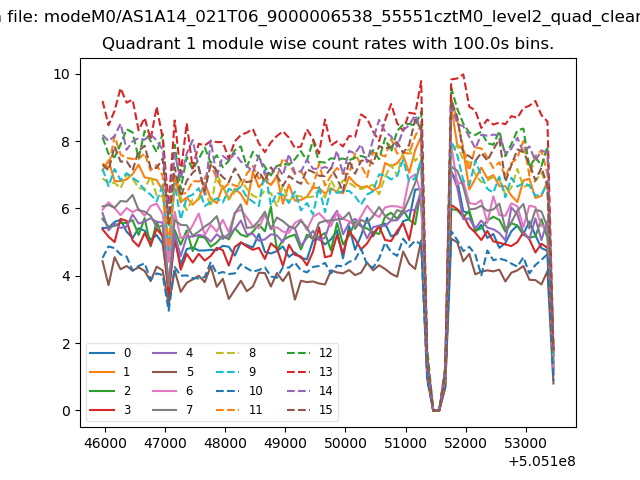
| Module-wise count rates for Quadrant A Data is divided into 100 sec bins |
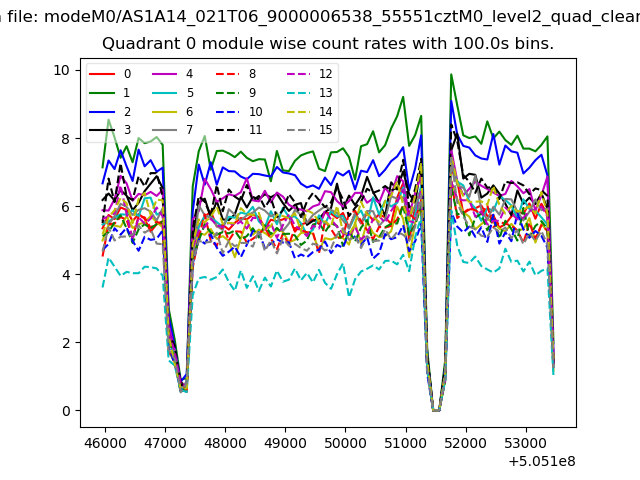 |
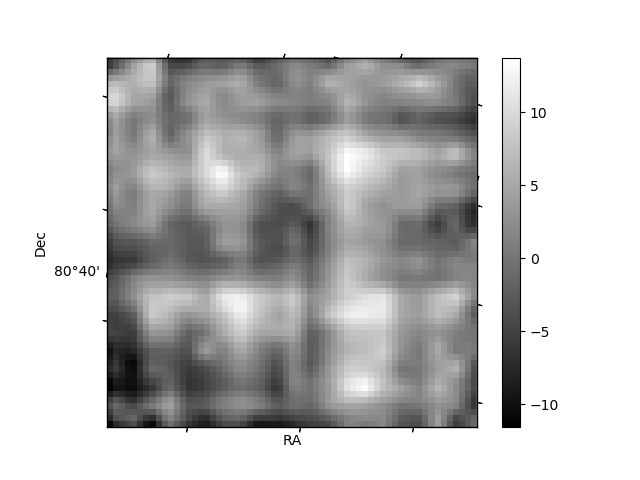 |
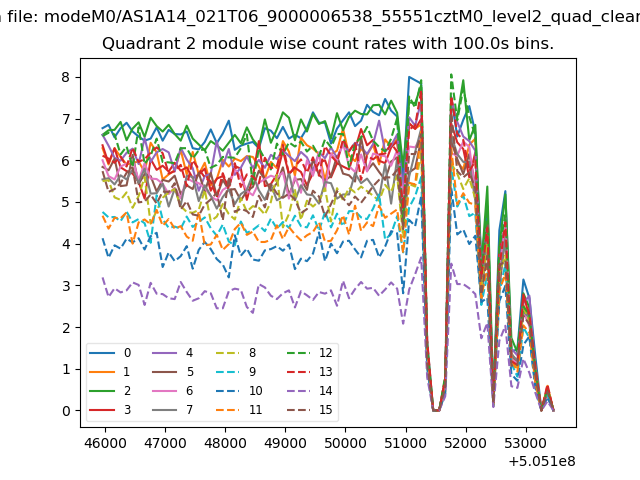
| Module-wise count rates for Quadrant B Data is divided into 100 sec bins |
 |
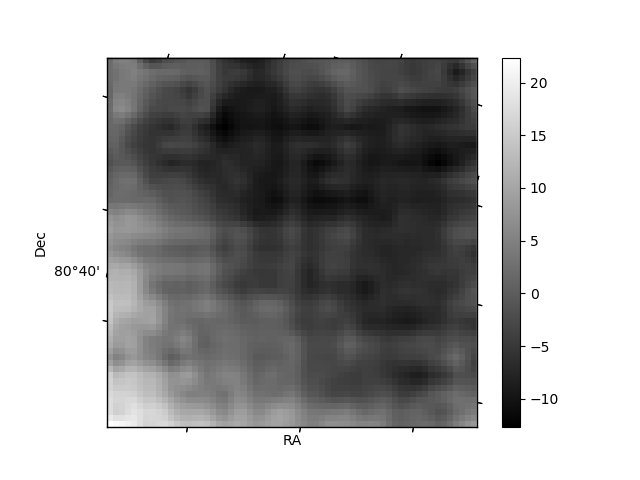 |
| Module-wise count rates for Quadrant C Data is divided into 100 sec bins |
 |
 |
| Module-wise count rates for Quadrant D Data is divided into 100 sec bins |
 |
 |
| Parameter | Plot |
|---|---|
| CZT HV Monitor | 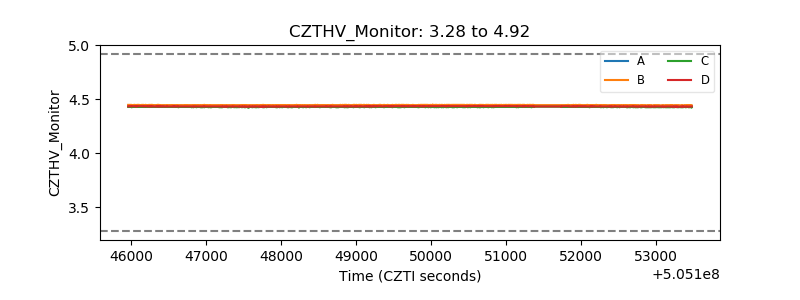 |
| D_VDD | 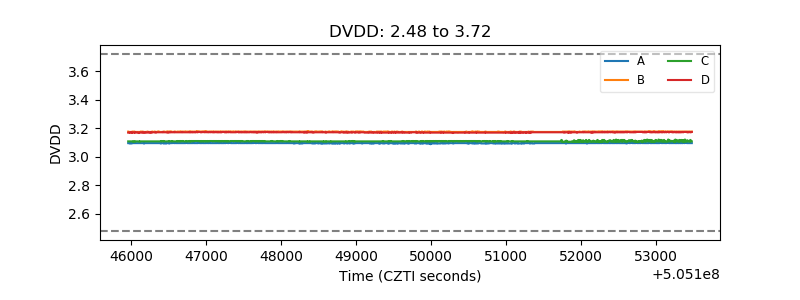 |
| Temperature 1 | 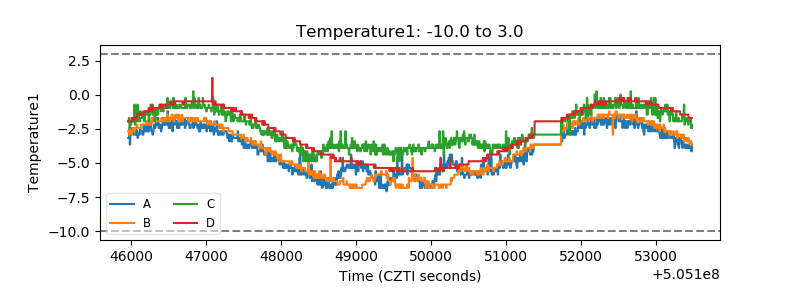 |
| Veto HV Monitor | 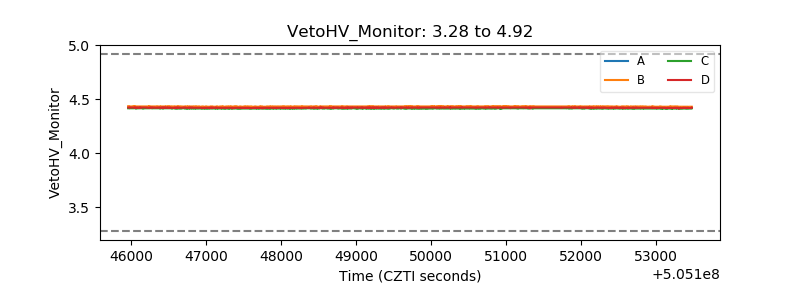 |
| Veto LLD | 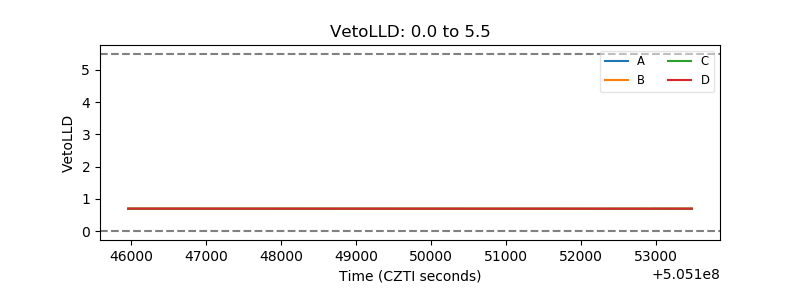 |
| Alpha Counter | 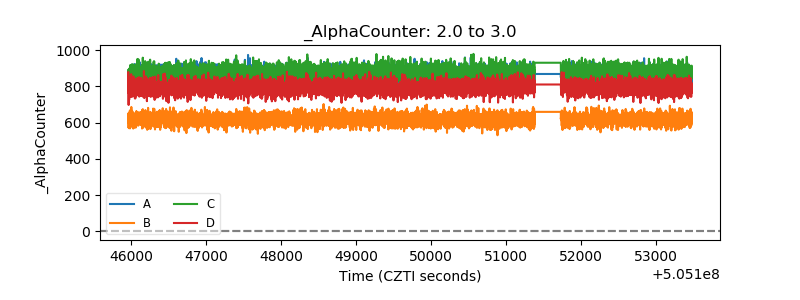 |
| _CPM_Rate | 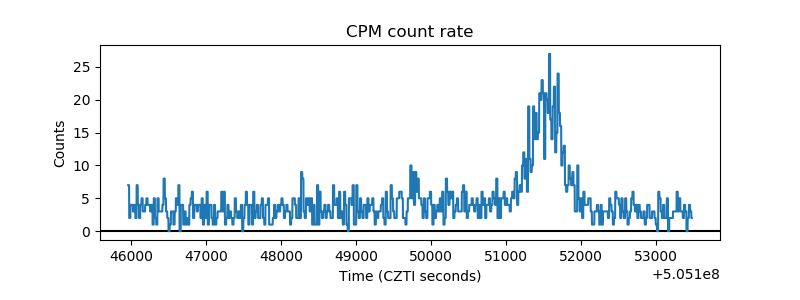 |
| CZT Counter | 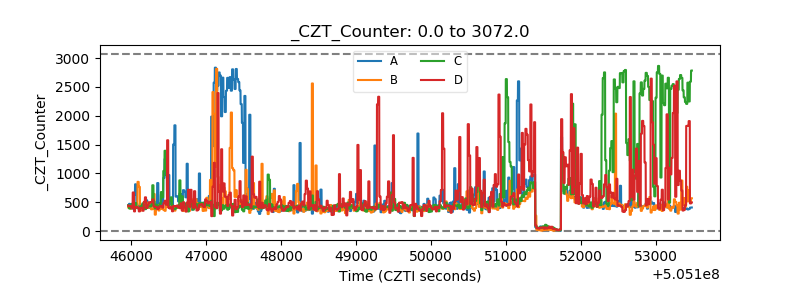 |
| +2.5 Volts monitor | 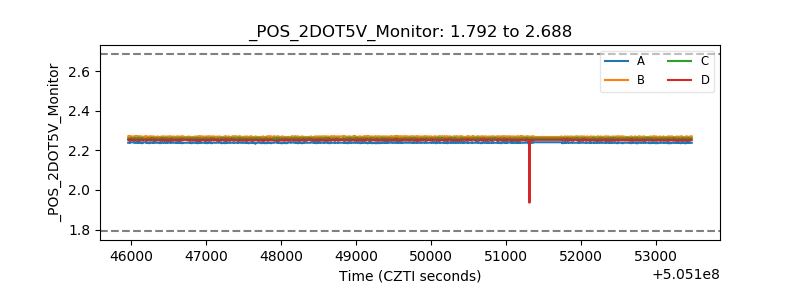 |
| +5 Volts monitor | 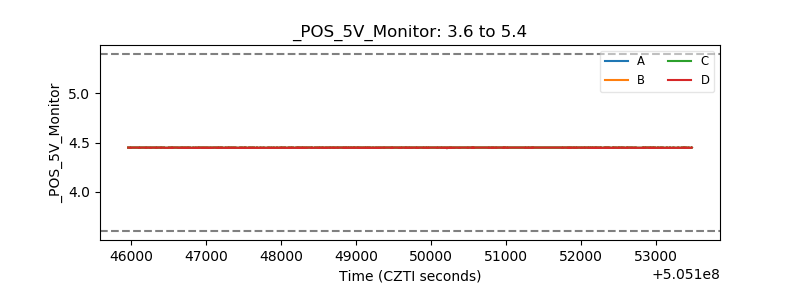 |
| _ROLL_ROT | 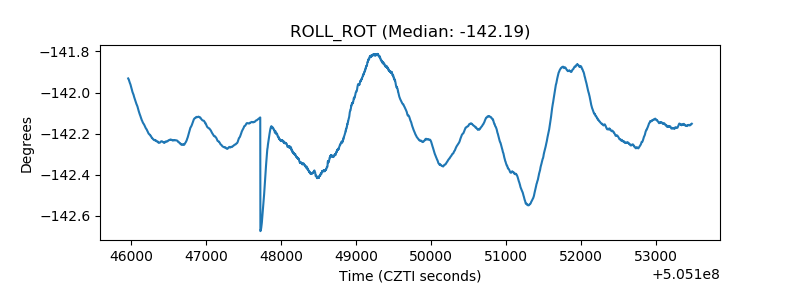 |
| _Roll_DEC | 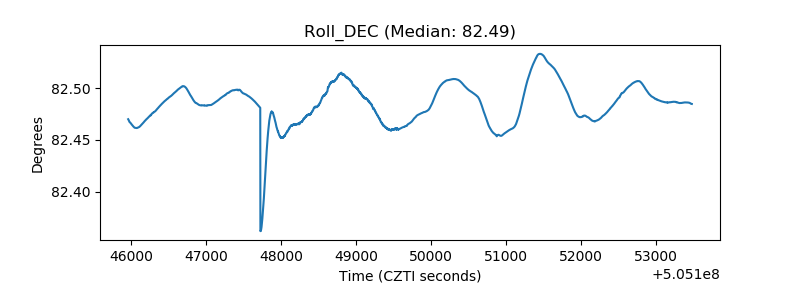 |
| _Roll_RA | 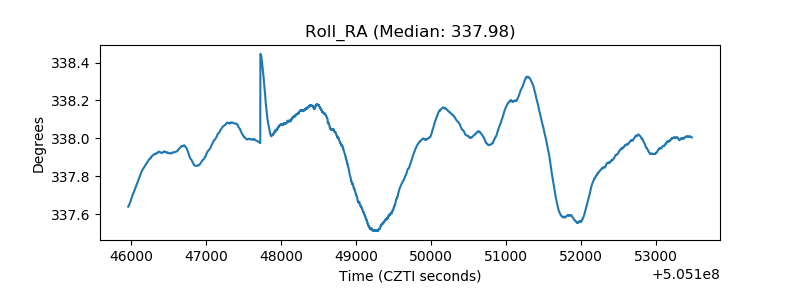 |
| Veto Counter | 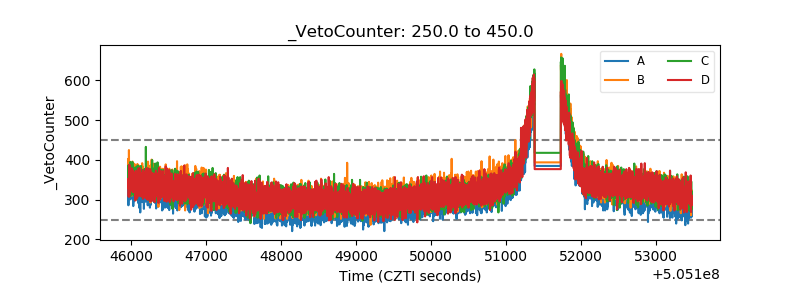 |