| Param | Original file | Final file |
|---|---|---|
| Filename | modeM0/AS1A14_021T06_9000006538_55552cztM0_level2.fits | modeM0/AS1A14_021T06_9000006538_55552cztM0_level2_quad_clean.evt |
| Size (bytes) | 621,060,480 | 96,321,600 |
| Size | 592.3 MB | 91.9 MB |
| Events in quadrant A | 3,282,607 | 687,541 |
| Events in quadrant B | 3,247,996 | 733,126 |
| Events in quadrant C | 11,418,854 | 382,643 |
| Events in quadrant D | 4,468,242 | 600,643 |
| Mode M0 | |||
|---|---|---|---|
| Quadrant | BADHDUFLAG | Total packets | Discarded packets |
| A | 0 | 15341 | 0 |
| B | 0 | 15327 | 0 |
| C | 0 | 38942 | 0 |
| D | 0 | 18578 | 0 |
| Mode SS | |||
|---|---|---|---|
| Quadrant | BADHDUFLAG | Total packets | Discarded packets |
| A | 0 | 148 | 0 |
| B | 0 | 148 | 0 |
| C | 0 | 148 | 0 |
| D | 0 | 148 | 0 |
| Quadrant | Total seconds | Saturated seconds | Saturation percentage |
|---|---|---|---|
| A | 7357 | 23 | 0.312627% |
| B | 7358 | 19 | 0.258222% |
| C | 7357 | 3274 | 44.501835% |
| D | 7357 | 215 | 2.922387% |
Noise dominated data is calculated using 1-second bins in cleaned event files. If a bin has >2000 counts, and if more than 50% of those come from <1% of pixels, then it is considered to be noise-dominated and hence unusable.
| Quadrant | # 1 sec bins | Bins with >0 counts | Bins with >2000 counts | High rate bins dominated by noise | Noise dominated (total time) | Noise dominated (detector-on time) | Marked lightcurve |
|---|---|---|---|---|---|---|---|
| A | 7357 | 7357 | 20 | 20 | 0.27% | 0.27% | 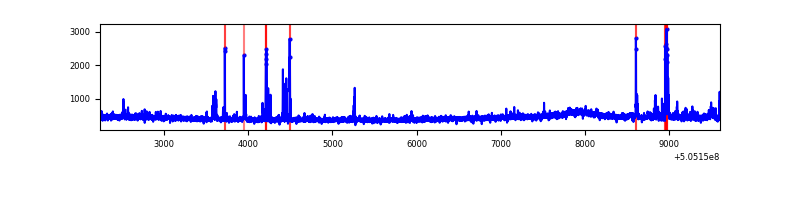 |
| B | 7358 | 7358 | 10 | 10 | 0.14% | 0.14% | 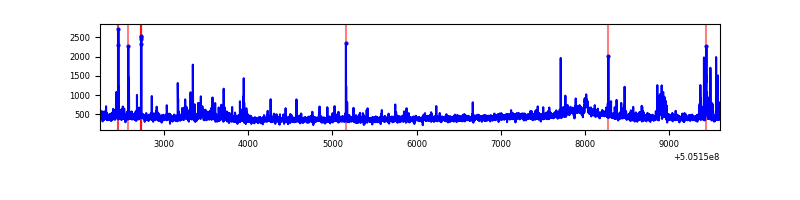 |
| C | 7357 | 7357 | 3208 | 3208 | 43.60% | 43.60% | 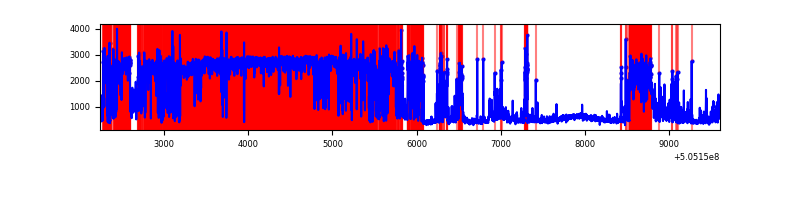 |
| D | 7357 | 7357 | 195 | 195 | 2.65% | 2.65% | 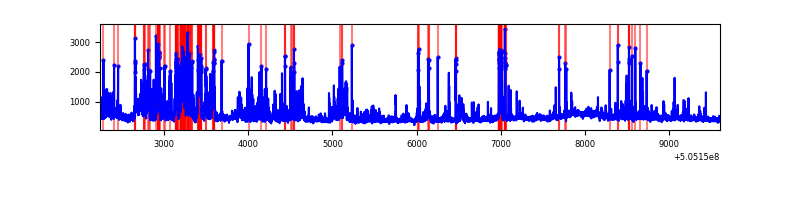 |
Top three noisy pixels from each quadrant. If the there are fewer than three noisy pixels in the level2.evt file, extra rows are filled as -1
| Pixel properties | Quadrant properties | ||||||
|---|---|---|---|---|---|---|---|
| Quadrant | DetID | PixID | Counts | Sigma | Mean | Median | Sigma |
| A | 0 | 8 | 157164 | 825.55 | 762 | 742 | 189.5 |
| A | 3 | 14 | 44636 | 231.66 | 762 | 742 | 189.5 |
| A | 4 | 159 | 41446 | 214.82 | 762 | 742 | 189.5 |
| B | 10 | 247 | 94208 | 582.78 | 751 | 726 | 160.4 |
| B | 4 | 169 | 63230 | 389.66 | 751 | 726 | 160.4 |
| B | 7 | 0 | 42862 | 262.68 | 751 | 726 | 160.4 |
| C | 9 | 38 | 8372292 | 56290.45 | 535 | 529 | 148.7 |
| C | 13 | 3 | 375137 | 2518.81 | 535 | 529 | 148.7 |
| C | 12 | 2 | 300591 | 2017.57 | 535 | 529 | 148.7 |
| D | 11 | 129 | 916694 | 4385.05 | 735 | 700 | 208.9 |
| D | 10 | 102 | 205083 | 978.42 | 735 | 700 | 208.9 |
| D | 2 | 31 | 81560 | 387.09 | 735 | 700 | 208.9 |
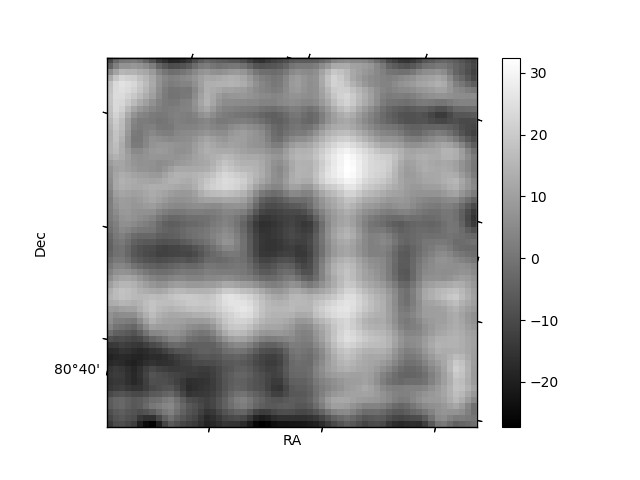
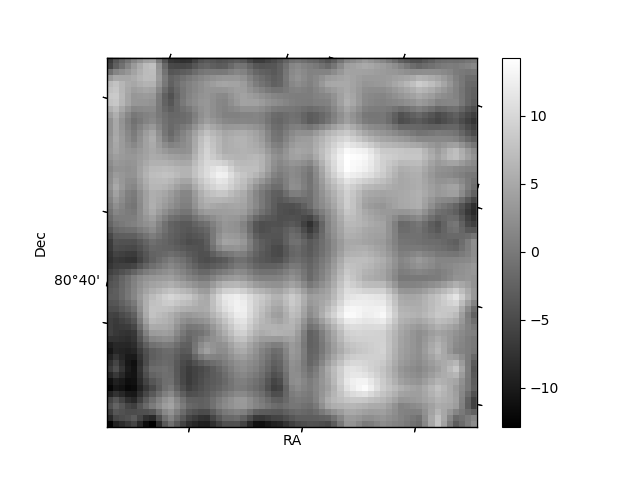
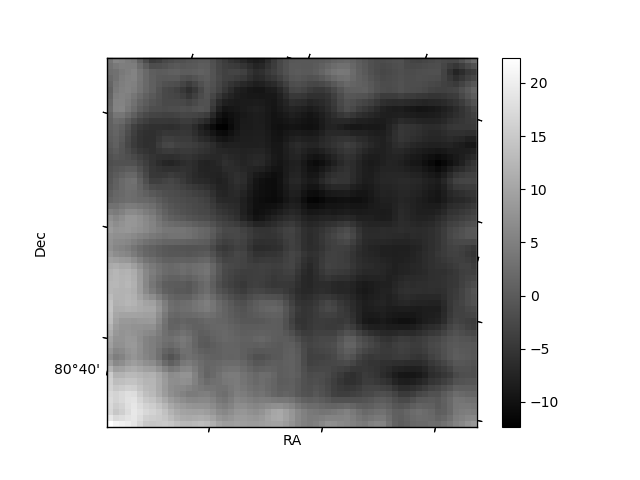
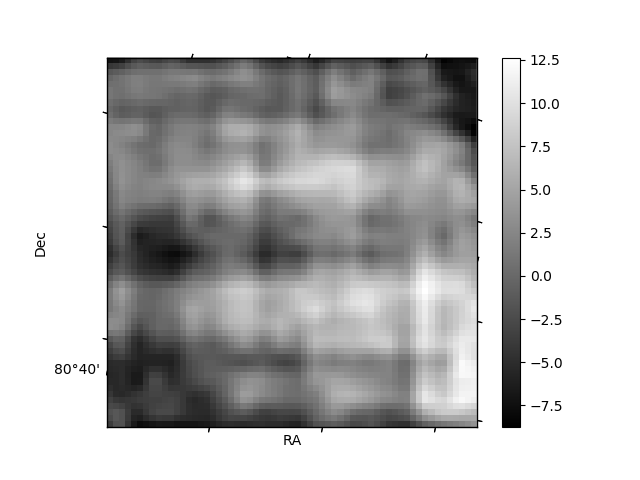
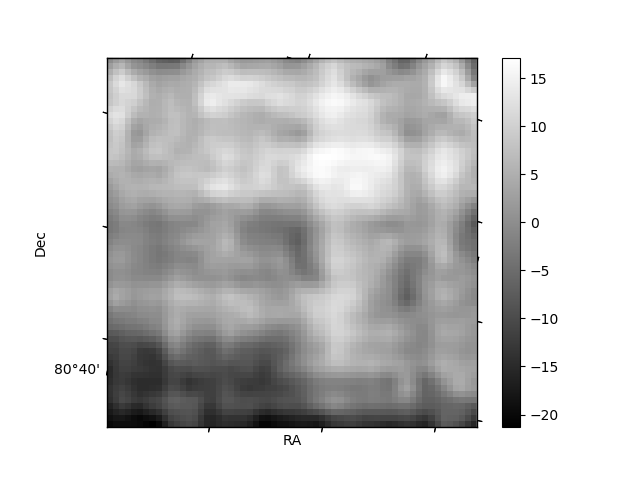
Histogram calculated using DETX and DETY for each event in the final _common_clean file
| Quadrant A | 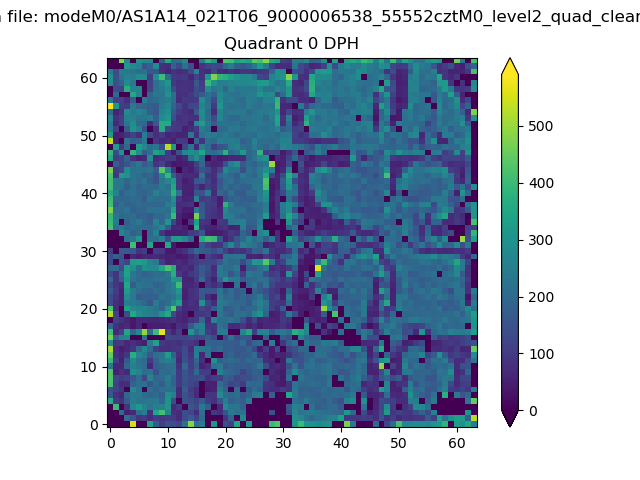 |
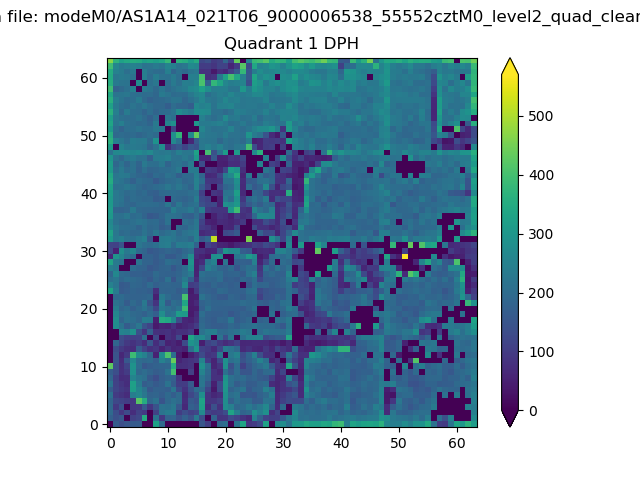 |
Quadrant B |
|---|---|---|---|
| Quadrant D | 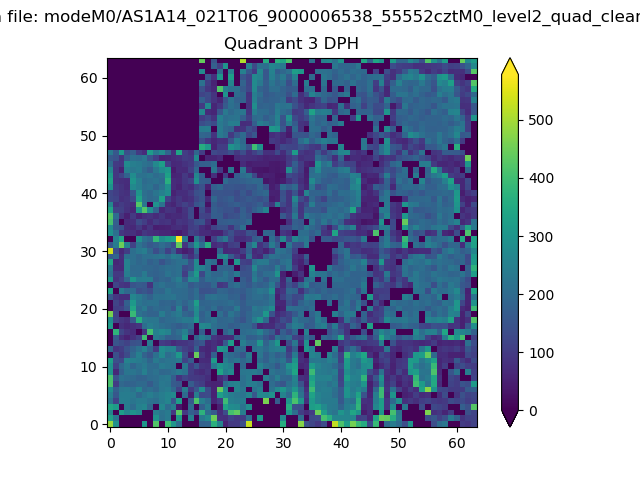 |
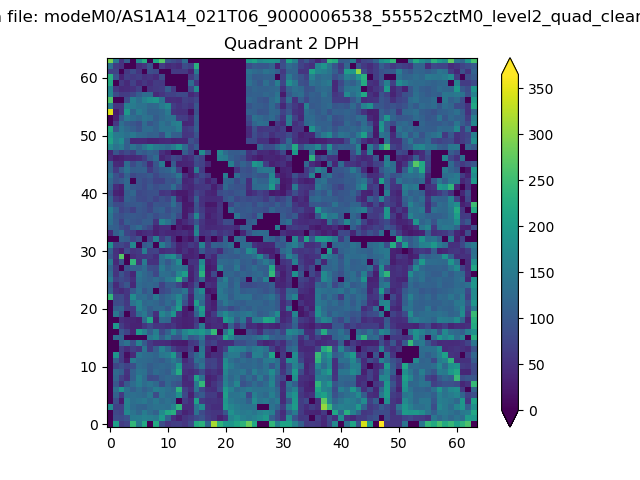 |
Quadrant C |
| Plot type | Count rate plots | Images |
|---|---|---|
| Comparison with Poisson distribution Blue bars denote a histogram of data divided into 1 sec bins. Red curve is a Poisson curve with rate = median count rate of data. |
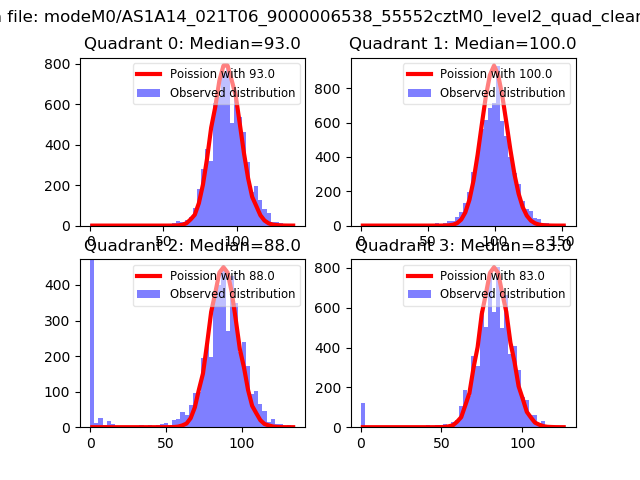 |
 |
| Quadrant-wise count rates Data is divided into 100 sec bins |
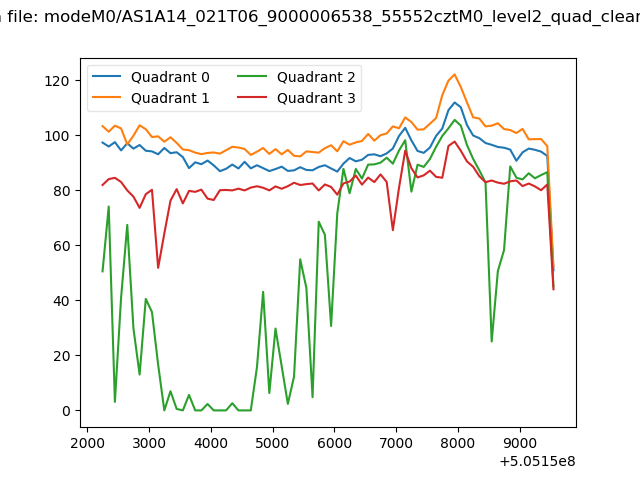 |
|
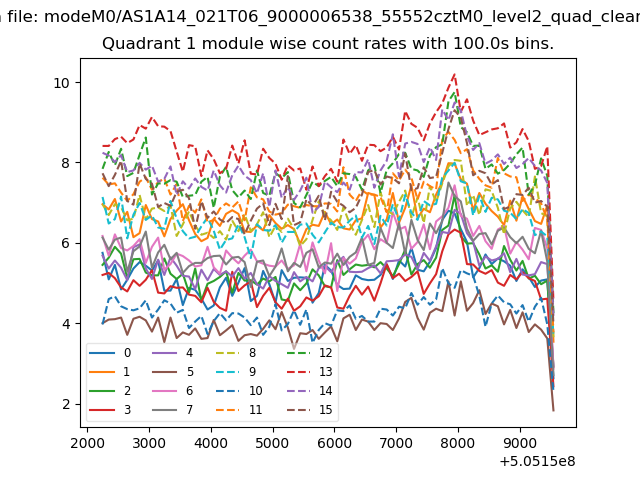
| Module-wise count rates for Quadrant A Data is divided into 100 sec bins |
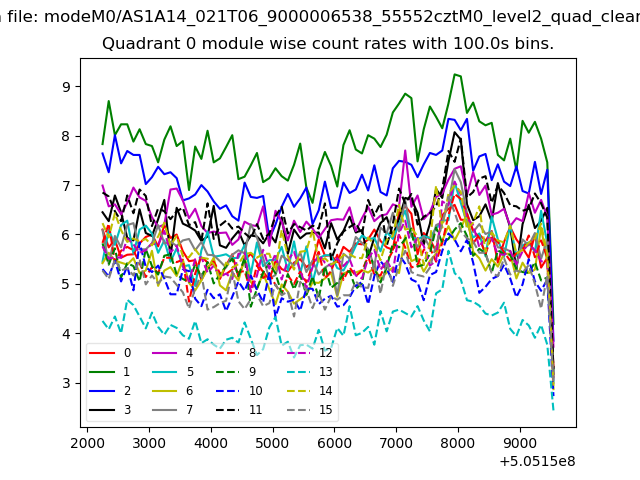 |
 |
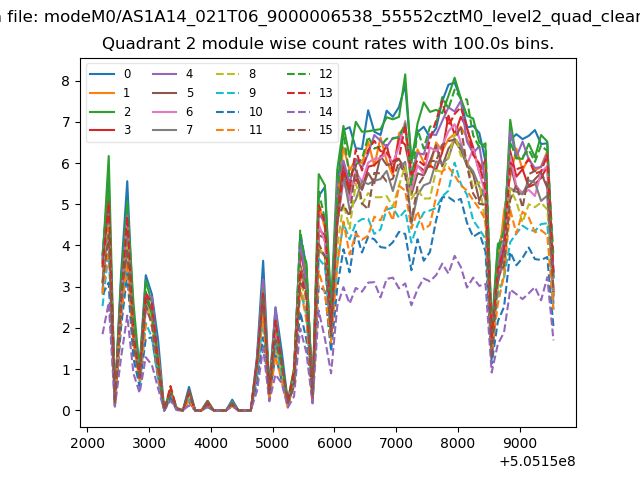
| Module-wise count rates for Quadrant B Data is divided into 100 sec bins |
 |
 |
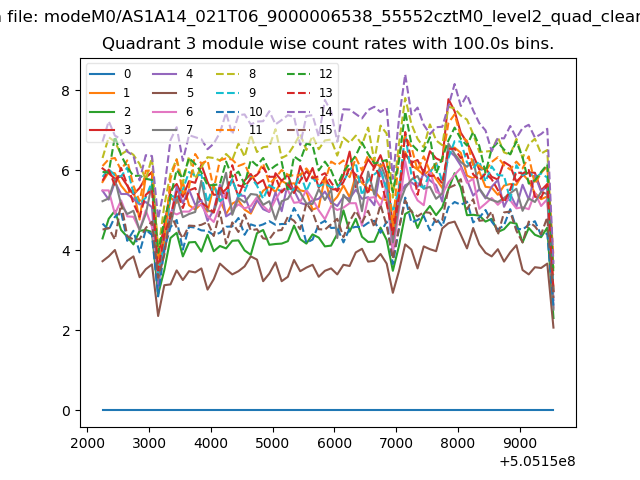
| Module-wise count rates for Quadrant C Data is divided into 100 sec bins |
 |
 |
| Module-wise count rates for Quadrant D Data is divided into 100 sec bins |
 |
 |
| Parameter | Plot |
|---|---|
| CZT HV Monitor | 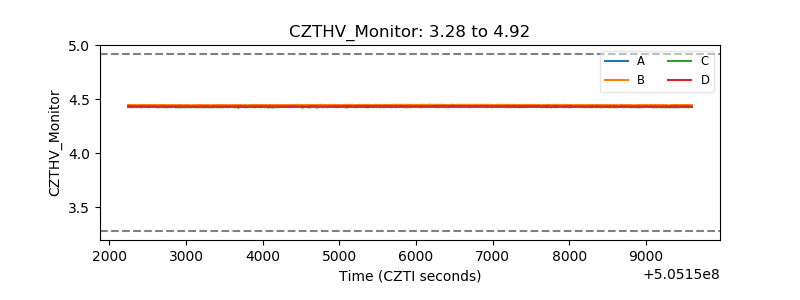 |
| D_VDD | 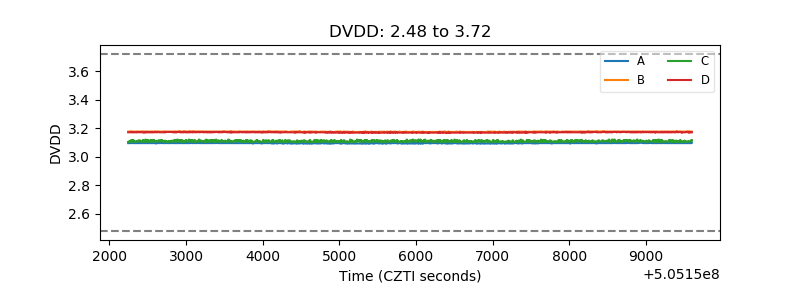 |
| Temperature 1 | 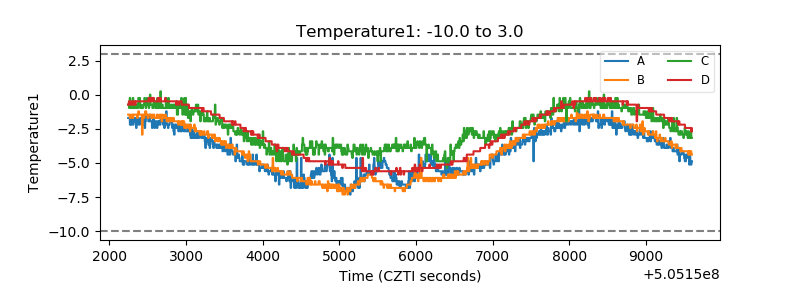 |
| Veto HV Monitor |  |
| Veto LLD | 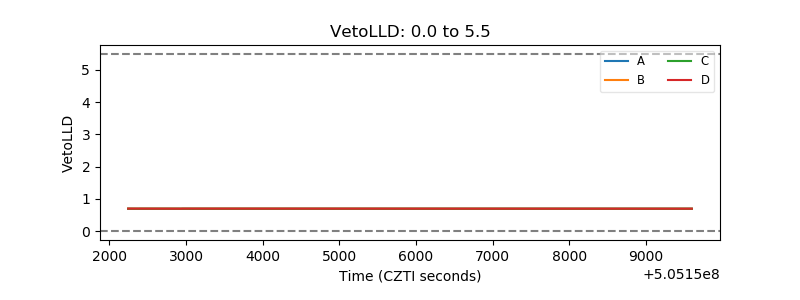 |
| Alpha Counter | 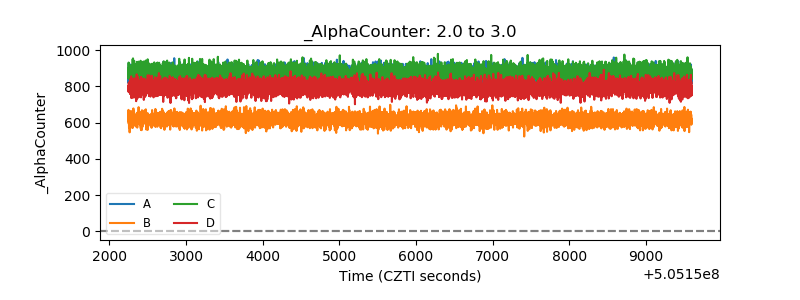 |
| _CPM_Rate | 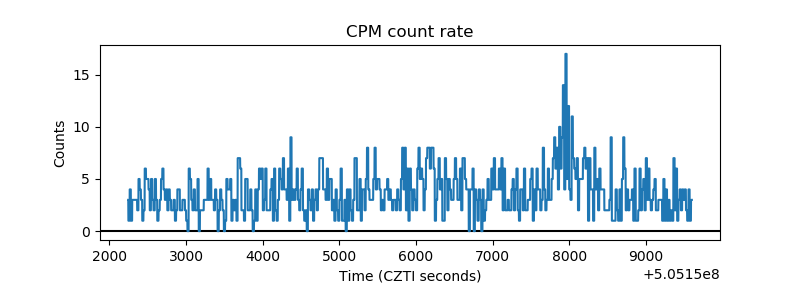 |
| CZT Counter | 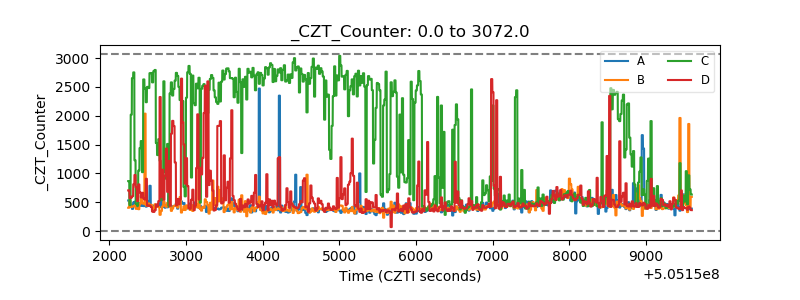 |
| +2.5 Volts monitor |  |
| +5 Volts monitor |  |
| _ROLL_ROT | 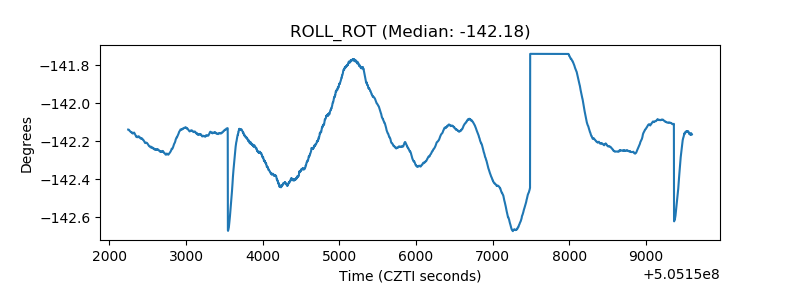 |
| _Roll_DEC | 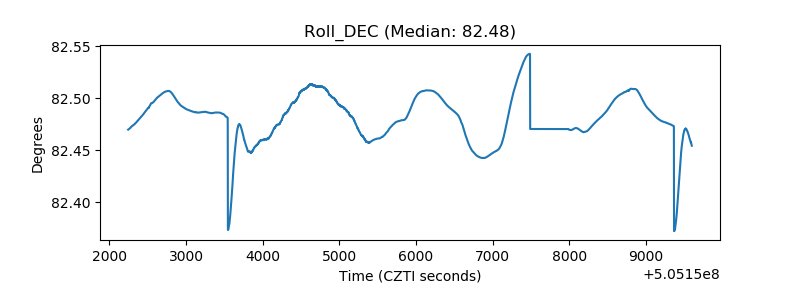 |
| _Roll_RA | 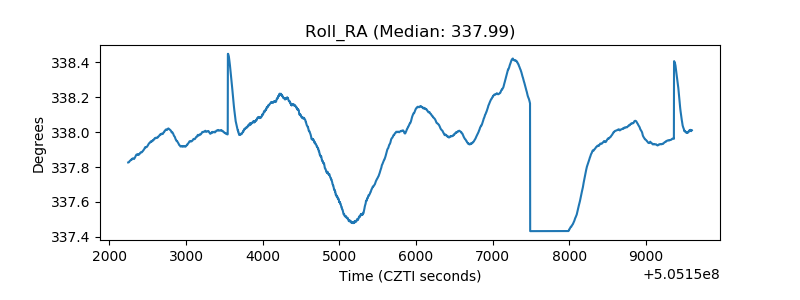 |
| Veto Counter | 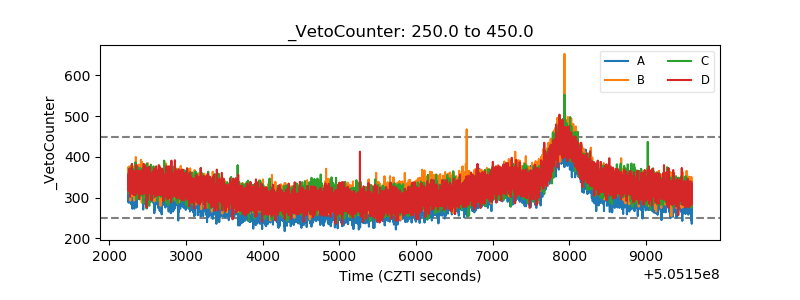 |