| Param | Original file | Final file |
|---|---|---|
| Filename | modeM0/AS1A14_021T06_9000006538_55553cztM0_level2.fits | modeM0/AS1A14_021T06_9000006538_55553cztM0_level2_quad_clean.evt |
| Size (bytes) | 474,232,320 | 112,201,920 |
| Size | 452.3 MB | 107.0 MB |
| Events in quadrant A | 3,492,477 | 739,242 |
| Events in quadrant B | 3,822,574 | 782,738 |
| Events in quadrant C | 5,590,861 | 668,045 |
| Events in quadrant D | 4,033,843 | 657,572 |
| Mode M0 | |||
|---|---|---|---|
| Quadrant | BADHDUFLAG | Total packets | Discarded packets |
| A | 0 | 16288 | 0 |
| B | 0 | 17301 | 9 |
| C | 0 | 22031 | 10 |
| D | 0 | 17827 | 4 |
| Mode SS | |||
|---|---|---|---|
| Quadrant | BADHDUFLAG | Total packets | Discarded packets |
| A | 0 | 158 | 0 |
| B | 0 | 158 | 0 |
| C | 0 | 158 | 0 |
| D | 0 | 158 | 0 |
| Quadrant | Total seconds | Saturated seconds | Saturation percentage |
|---|---|---|---|
| A | 7910 | 23 | 0.290771% |
| B | 7906 | 112 | 1.416646% |
| C | 7908 | 401 | 5.070814% |
| D | 7909 | 80 | 1.011506% |
Noise dominated data is calculated using 1-second bins in cleaned event files. If a bin has >2000 counts, and if more than 50% of those come from <1% of pixels, then it is considered to be noise-dominated and hence unusable.
| Quadrant | # 1 sec bins | Bins with >0 counts | Bins with >2000 counts | High rate bins dominated by noise | Noise dominated (total time) | Noise dominated (detector-on time) | Marked lightcurve |
|---|---|---|---|---|---|---|---|
| A | 7910 | 7910 | 14 | 14 | 0.18% | 0.18% | 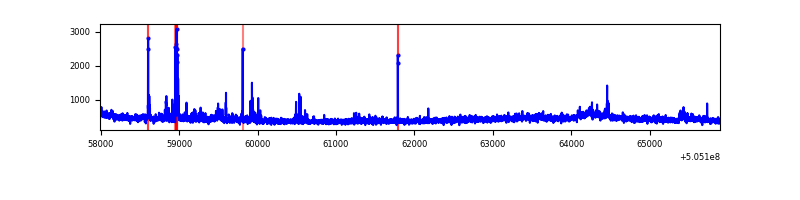 |
| B | 7910 | 7910 | 70 | 70 | 0.88% | 0.88% | 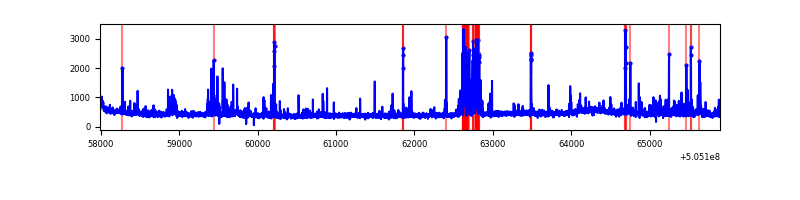 |
| C | 7911 | 7910 | 406 | 406 | 5.13% | 5.13% | 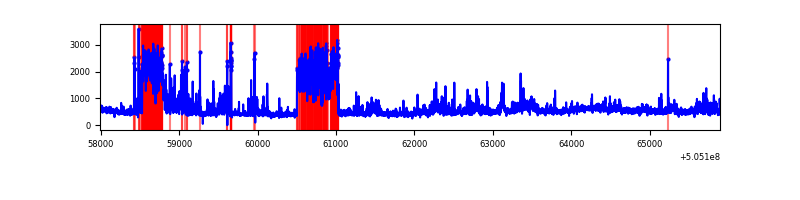 |
| D | 7911 | 7911 | 90 | 90 | 1.14% | 1.14% | 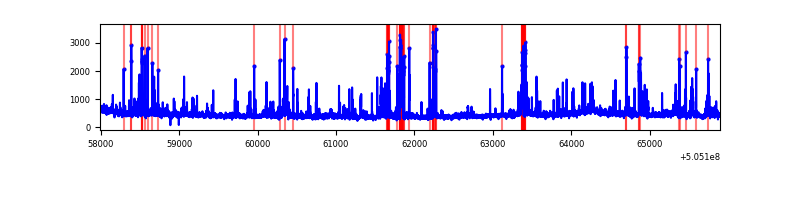 |
Top three noisy pixels from each quadrant. If the there are fewer than three noisy pixels in the level2.evt file, extra rows are filled as -1
| Pixel properties | Quadrant properties | ||||||
|---|---|---|---|---|---|---|---|
| Quadrant | DetID | PixID | Counts | Sigma | Mean | Median | Sigma |
| A | 4 | 159 | 103947 | 498.55 | 824 | 800 | 206.9 |
| A | 0 | 8 | 75255 | 359.87 | 824 | 800 | 206.9 |
| A | 15 | 32 | 29424 | 138.35 | 824 | 800 | 206.9 |
| B | 2 | 249 | 218893 | 1257.73 | 809 | 780 | 173.4 |
| B | 10 | 247 | 130606 | 748.63 | 809 | 780 | 173.4 |
| B | 4 | 169 | 120832 | 692.27 | 809 | 780 | 173.4 |
| C | 9 | 38 | 1567146 | 7157.82 | 791 | 782 | 218.8 |
| C | 1 | 16 | 400066 | 1824.61 | 791 | 782 | 218.8 |
| C | 12 | 2 | 303503 | 1383.34 | 791 | 782 | 218.8 |
| D | 8 | 245 | 236120 | 1050.91 | 799 | 763 | 224.0 |
| D | 10 | 181 | 161241 | 716.56 | 799 | 763 | 224.0 |
| D | 11 | 129 | 106440 | 471.87 | 799 | 763 | 224.0 |
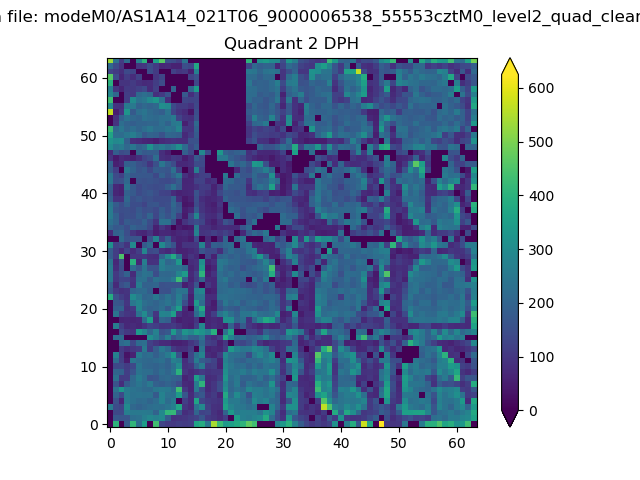
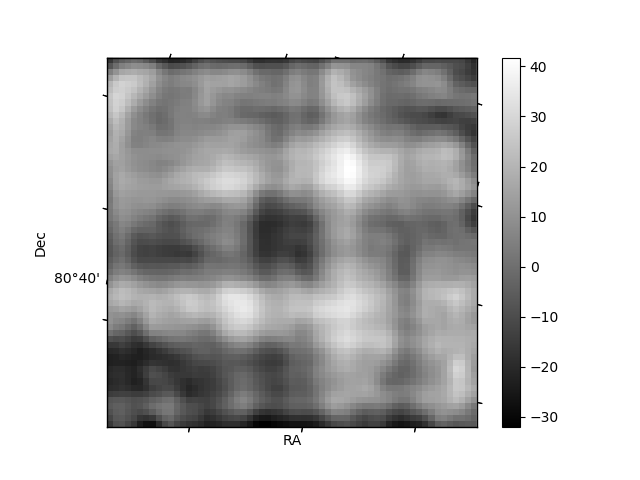
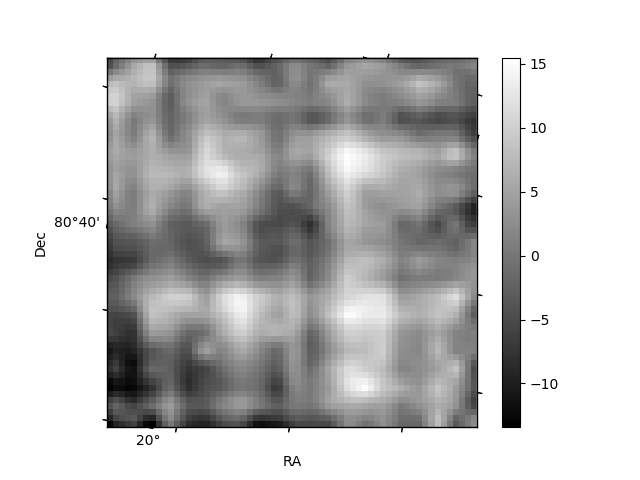
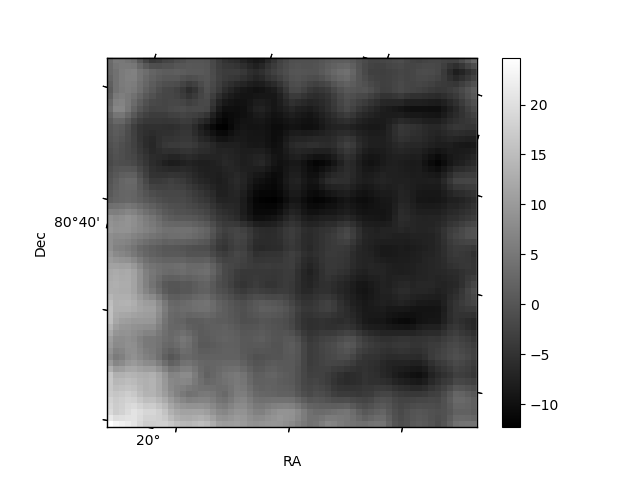
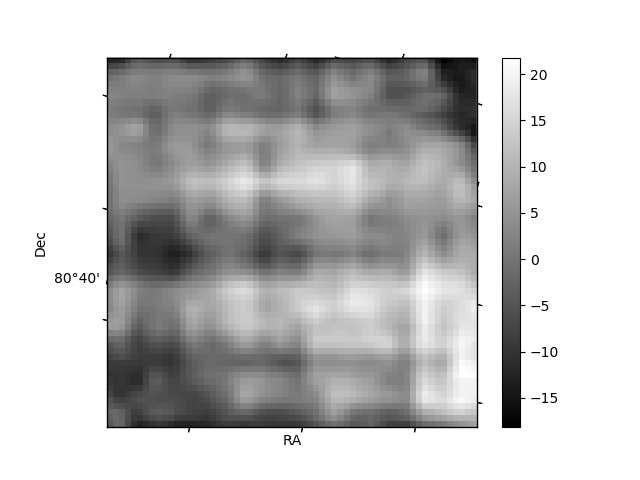
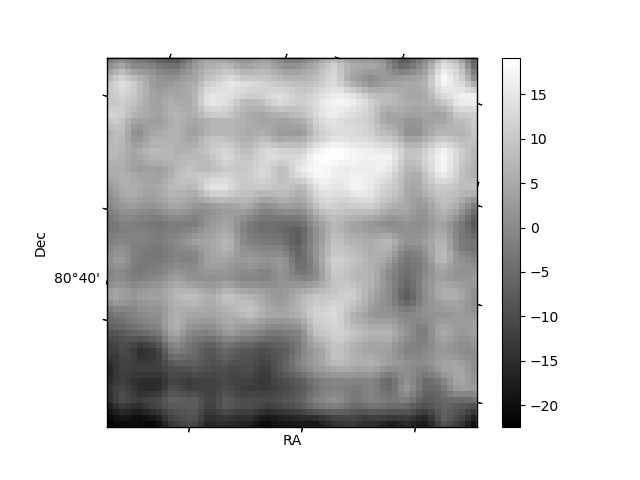
Histogram calculated using DETX and DETY for each event in the final _common_clean file
| Quadrant A | 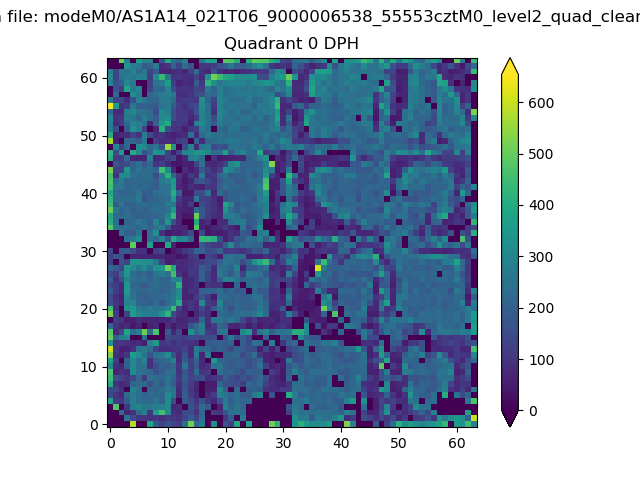 |
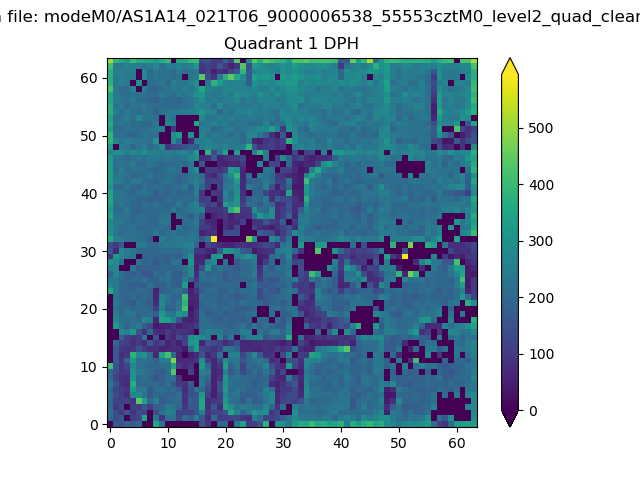 |
Quadrant B |
|---|---|---|---|
| Quadrant D | 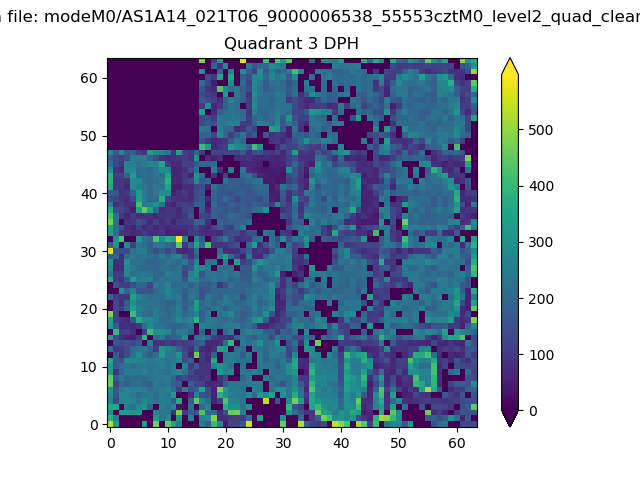 |
 |
Quadrant C |
| Plot type | Count rate plots | Images |
|---|---|---|
| Comparison with Poisson distribution Blue bars denote a histogram of data divided into 1 sec bins. Red curve is a Poisson curve with rate = median count rate of data. |
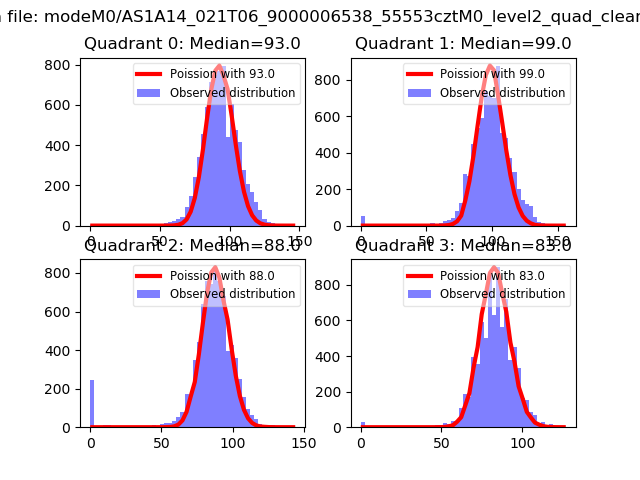 |
 |
| Quadrant-wise count rates Data is divided into 100 sec bins |
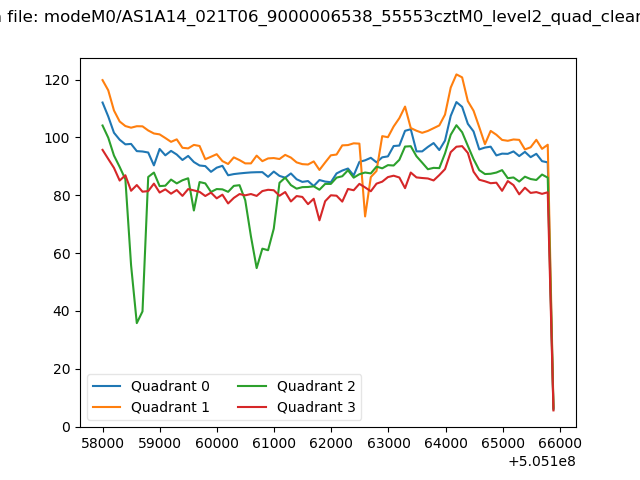 |
|
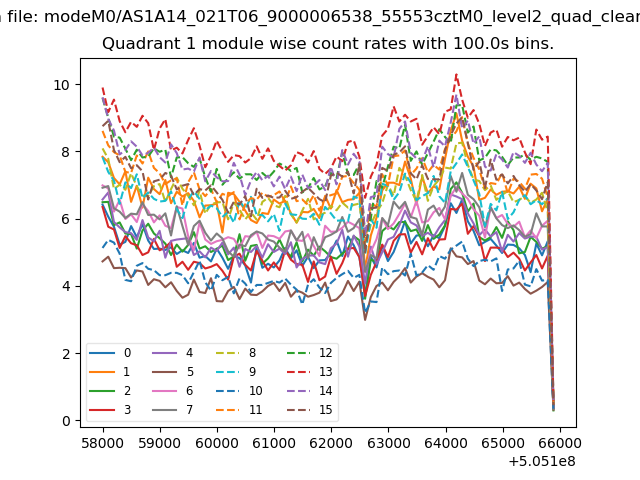
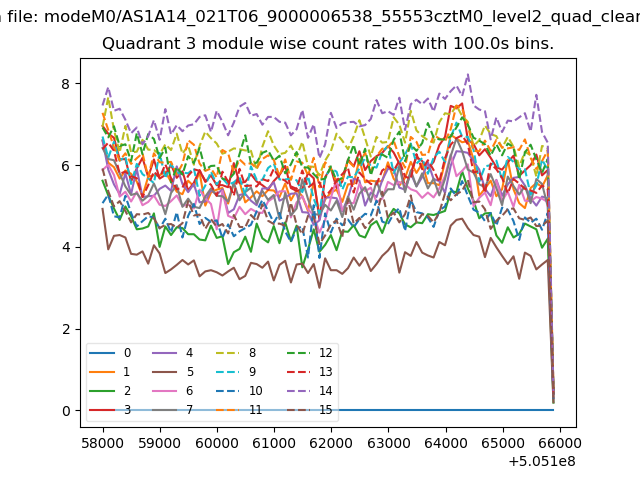
| Module-wise count rates for Quadrant A Data is divided into 100 sec bins |
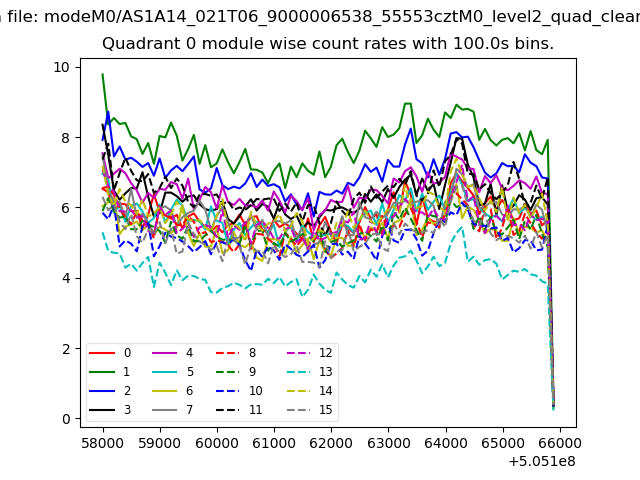 |
 |
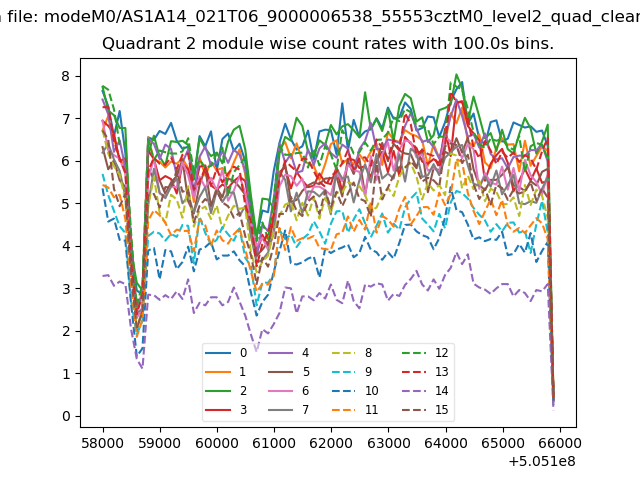
| Module-wise count rates for Quadrant B Data is divided into 100 sec bins |
 |
 |
| Module-wise count rates for Quadrant C Data is divided into 100 sec bins |
 |
 |
| Module-wise count rates for Quadrant D Data is divided into 100 sec bins |
 |
 |
| Parameter | Plot |
|---|---|
| CZT HV Monitor | 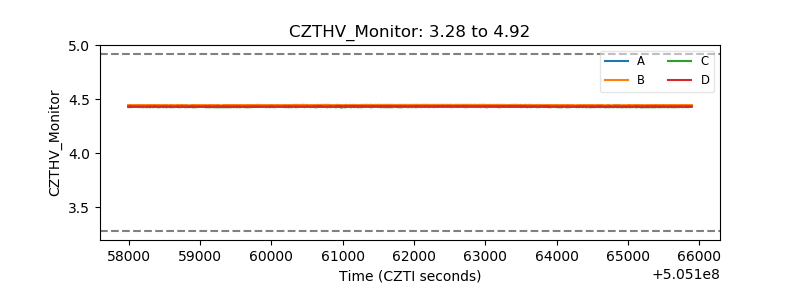 |
| D_VDD | 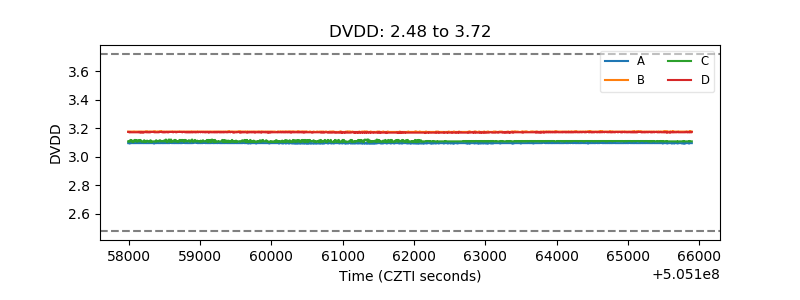 |
| Temperature 1 | 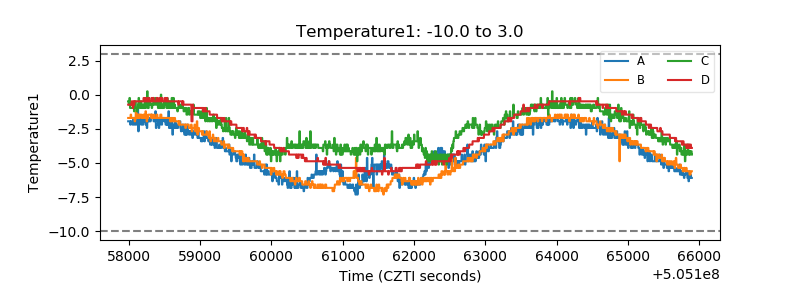 |
| Veto HV Monitor | 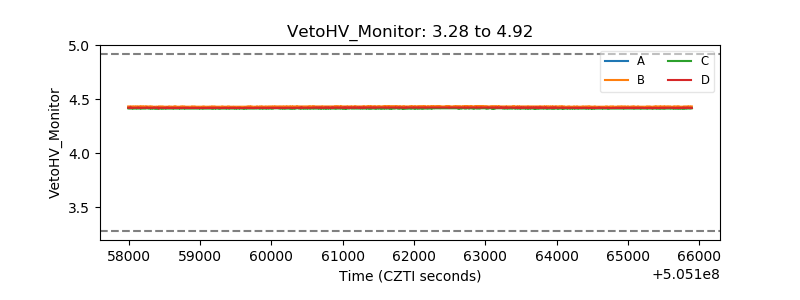 |
| Veto LLD | 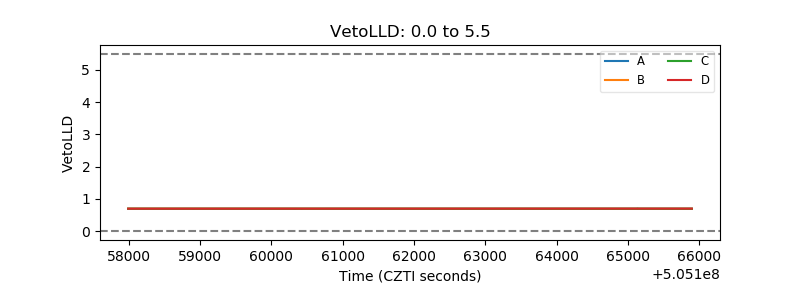 |
| Alpha Counter | 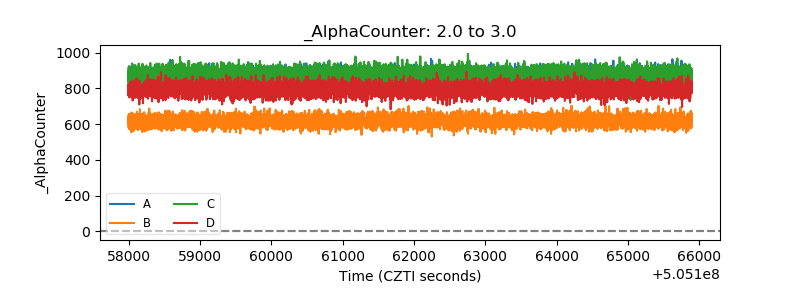 |
| _CPM_Rate | 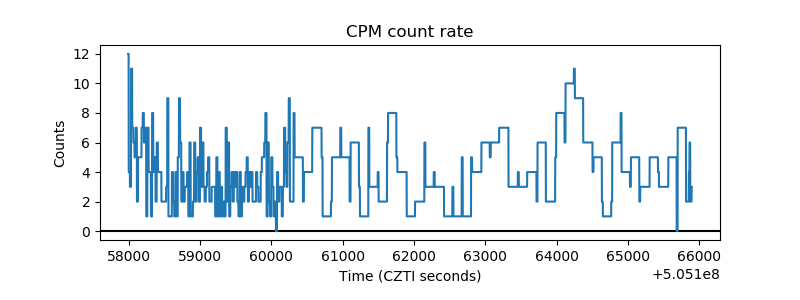 |
| CZT Counter | 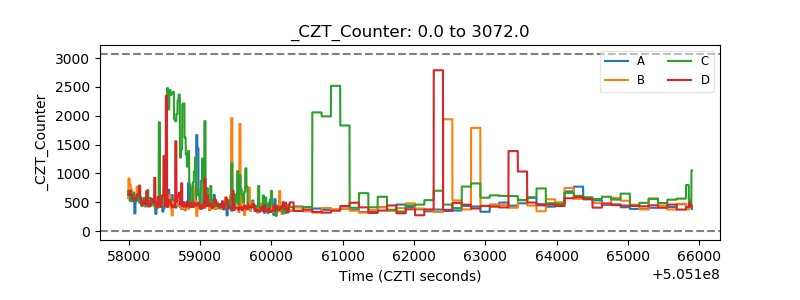 |
| +2.5 Volts monitor |  |
| +5 Volts monitor | 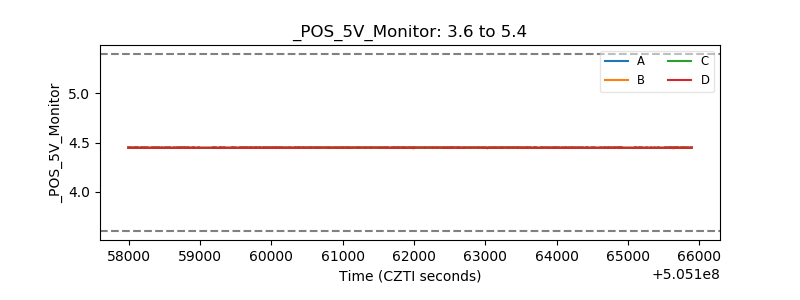 |
| _ROLL_ROT | 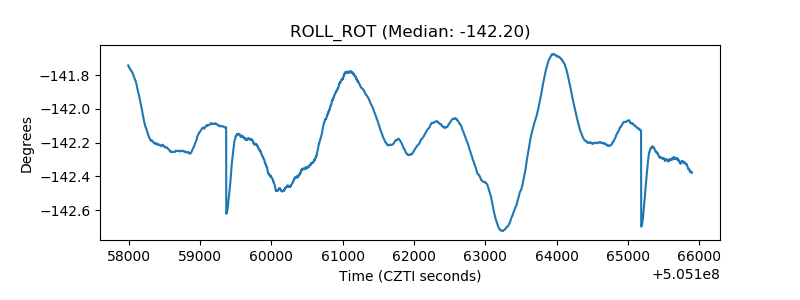 |
| _Roll_DEC | 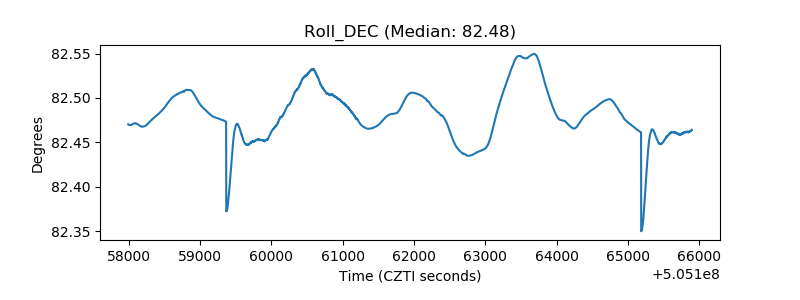 |
| _Roll_RA | 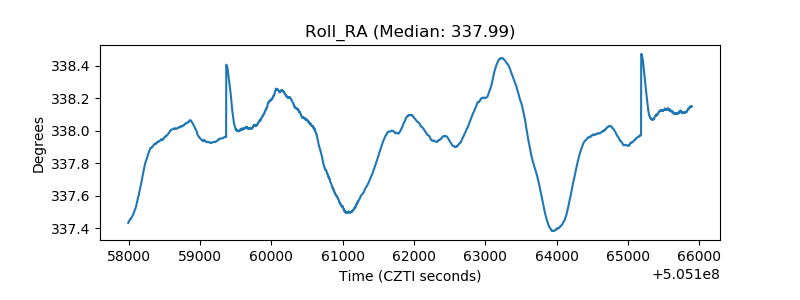 |
| Veto Counter | 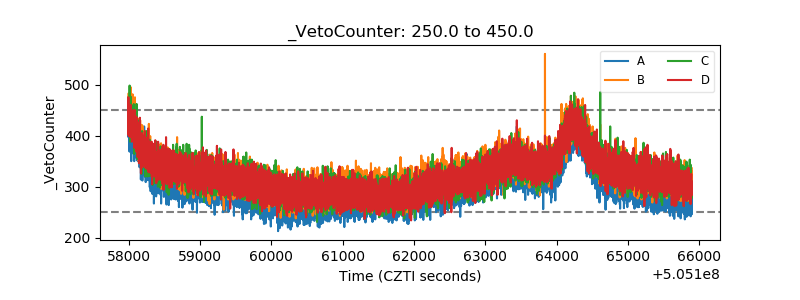 |