| Param | Original file | Final file |
|---|---|---|
| Filename | modeM0/AS1A14_021T06_9000006538_55557cztM0_level2.fits | modeM0/AS1A14_021T06_9000006538_55557cztM0_level2_quad_clean.evt |
| Size (bytes) | 600,390,720 | 149,872,320 |
| Size | 572.6 MB | 142.9 MB |
| Events in quadrant A | 5,169,822 | 959,636 |
| Events in quadrant B | 4,709,088 | 1,046,393 |
| Events in quadrant C | 6,447,989 | 910,797 |
| Events in quadrant D | 5,064,056 | 878,080 |
| Mode M9 | |||
|---|---|---|---|
| Quadrant | BADHDUFLAG | Total packets | Discarded packets |
| A | 0 | 14 | 0 |
| B | 0 | 14 | 0 |
| C | 0 | 14 | 0 |
| D | 0 | 14 | 0 |
| Mode M0 | |||
|---|---|---|---|
| Quadrant | BADHDUFLAG | Total packets | Discarded packets |
| A | 0 | 23735 | 2 |
| B | 0 | 22458 | 2 |
| C | 0 | 26590 | 3 |
| D | 0 | 23439 | 2 |
| Mode SS | |||
|---|---|---|---|
| Quadrant | BADHDUFLAG | Total packets | Discarded packets |
| A | 0 | 218 | 0 |
| B | 0 | 218 | 0 |
| C | 0 | 218 | 0 |
| D | 0 | 218 | 0 |
| Quadrant | Total seconds | Saturated seconds | Saturation percentage |
|---|---|---|---|
| A | 10731 | 145 | 1.351225% |
| B | 10731 | 70 | 0.652316% |
| C | 10731 | 300 | 2.795639% |
| D | 10731 | 93 | 0.866648% |
Noise dominated data is calculated using 1-second bins in cleaned event files. If a bin has >2000 counts, and if more than 50% of those come from <1% of pixels, then it is considered to be noise-dominated and hence unusable.
| Quadrant | # 1 sec bins | Bins with >0 counts | Bins with >2000 counts | High rate bins dominated by noise | Noise dominated (total time) | Noise dominated (detector-on time) | Marked lightcurve |
|---|---|---|---|---|---|---|---|
| A | 12116 | 10733 | 104 | 104 | 0.86% | 0.97% | 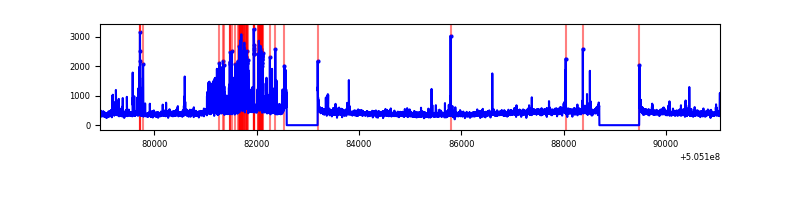 |
| B | 12116 | 10733 | 40 | 40 | 0.33% | 0.37% | 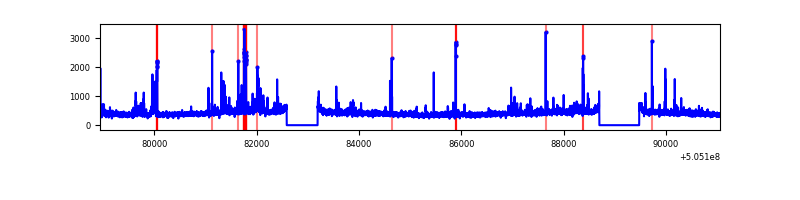 |
| C | 12116 | 10732 | 280 | 280 | 2.31% | 2.61% | 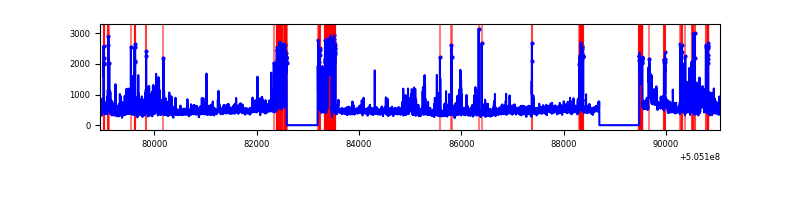 |
| D | 12116 | 10733 | 100 | 100 | 0.83% | 0.93% | 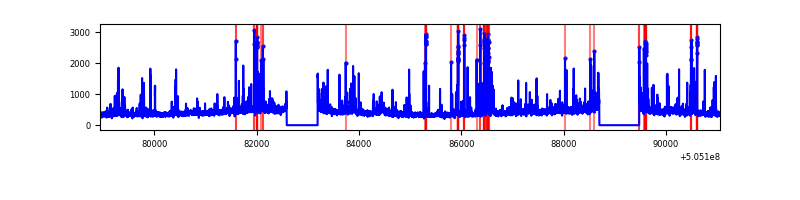 |
Top three noisy pixels from each quadrant. If the there are fewer than three noisy pixels in the level2.evt file, extra rows are filled as -1
| Pixel properties | Quadrant properties | ||||||
|---|---|---|---|---|---|---|---|
| Quadrant | DetID | PixID | Counts | Sigma | Mean | Median | Sigma |
| A | 4 | 159 | 699641 | 2594.35 | 1085 | 1058 | 269.3 |
| A | 0 | 8 | 120299 | 442.83 | 1085 | 1058 | 269.3 |
| A | 8 | 6 | 40361 | 145.96 | 1085 | 1058 | 269.3 |
| B | 4 | 169 | 180244 | 781.79 | 1077 | 1038 | 229.2 |
| B | 10 | 245 | 68102 | 292.57 | 1077 | 1038 | 229.2 |
| B | 10 | 247 | 50602 | 216.22 | 1077 | 1038 | 229.2 |
| C | 13 | 3 | 888133 | 3097.64 | 1045 | 1036 | 286.4 |
| C | 9 | 38 | 717060 | 2500.27 | 1045 | 1036 | 286.4 |
| C | 1 | 16 | 264273 | 919.19 | 1045 | 1036 | 286.4 |
| D | 8 | 245 | 240006 | 802.95 | 1050 | 1002 | 297.7 |
| D | 11 | 129 | 199428 | 666.62 | 1050 | 1002 | 297.7 |
| D | 2 | 172 | 131020 | 436.8 | 1050 | 1002 | 297.7 |
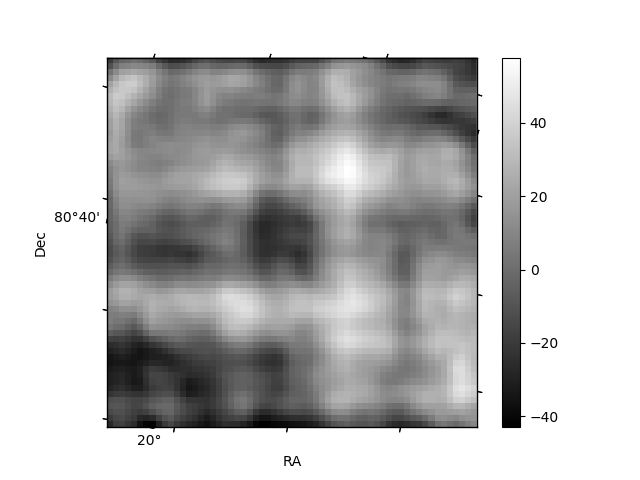
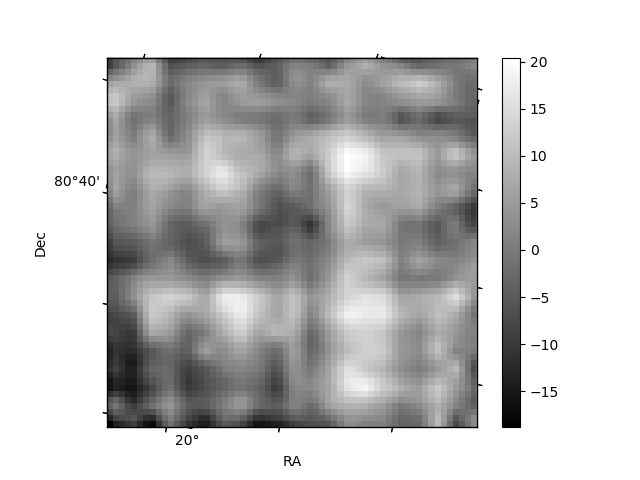
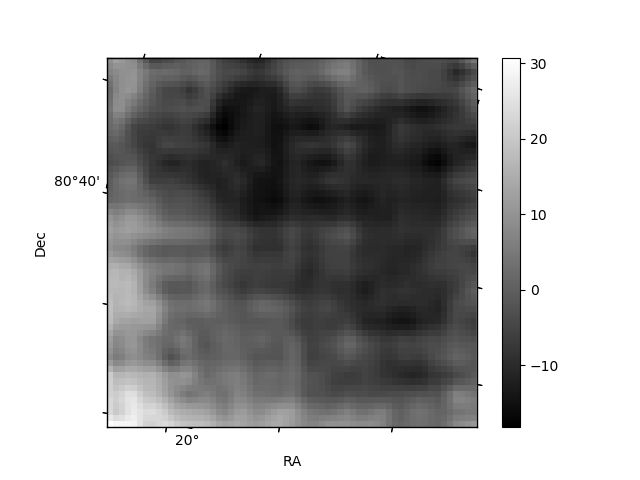
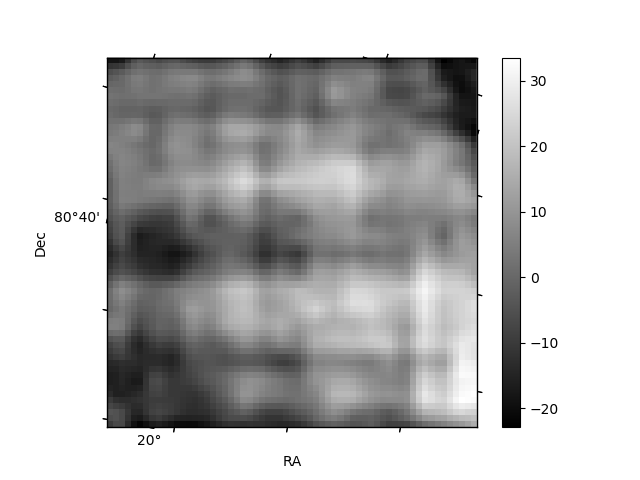
Histogram calculated using DETX and DETY for each event in the final _common_clean file
| Quadrant A | 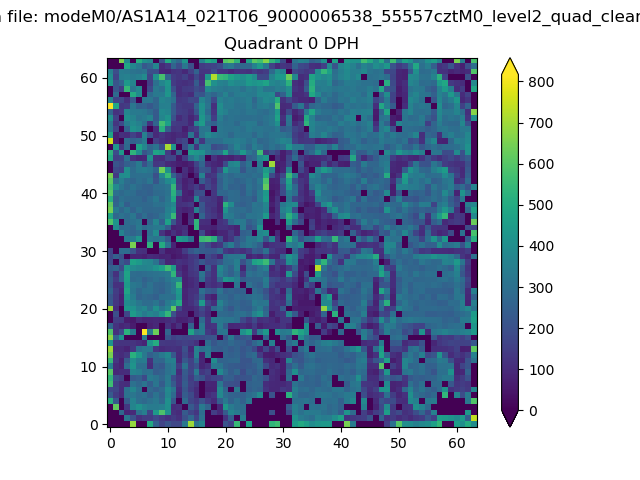 |
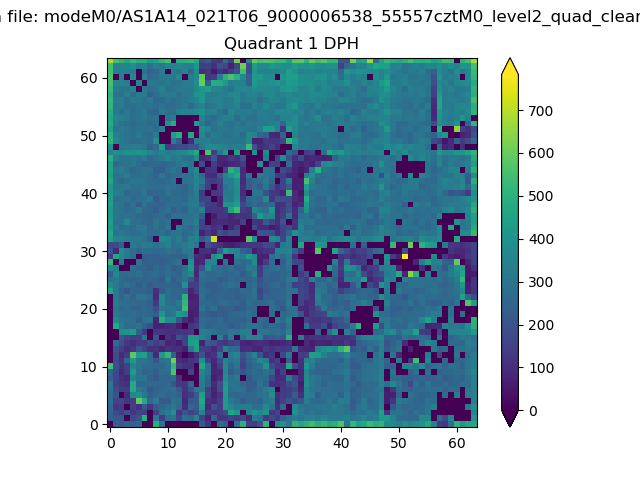 |
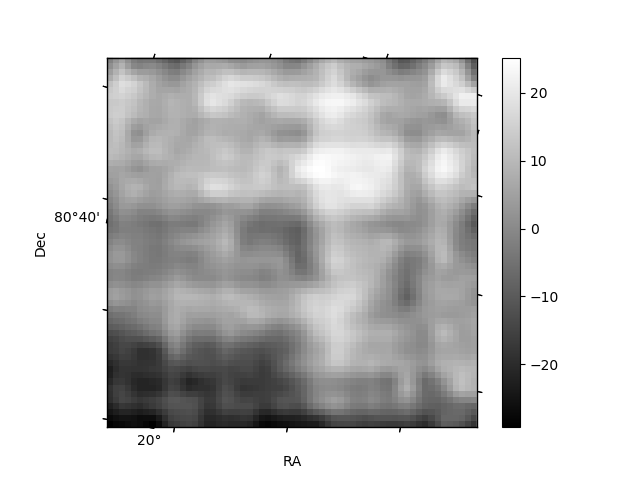
Quadrant B |
|---|---|---|---|
| Quadrant D | 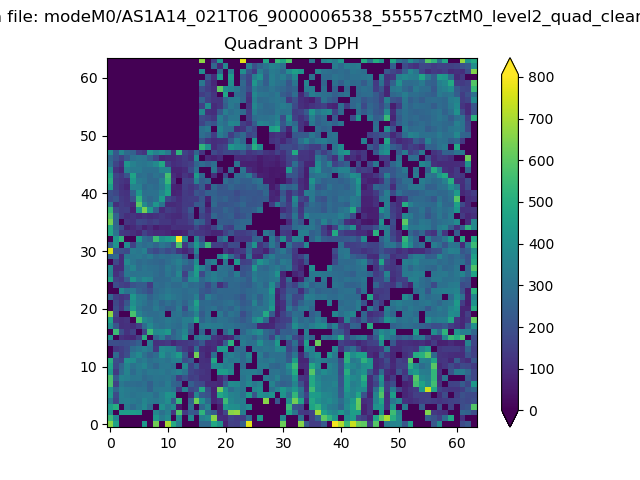 |
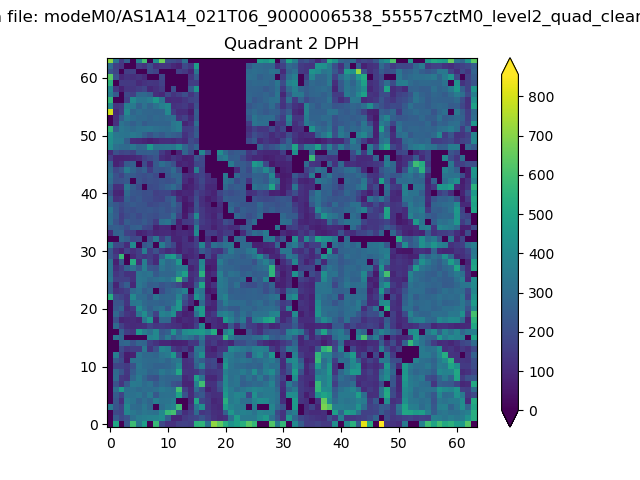 |
Quadrant C |
| Plot type | Count rate plots | Images |
|---|---|---|
| Comparison with Poisson distribution Blue bars denote a histogram of data divided into 1 sec bins. Red curve is a Poisson curve with rate = median count rate of data. |
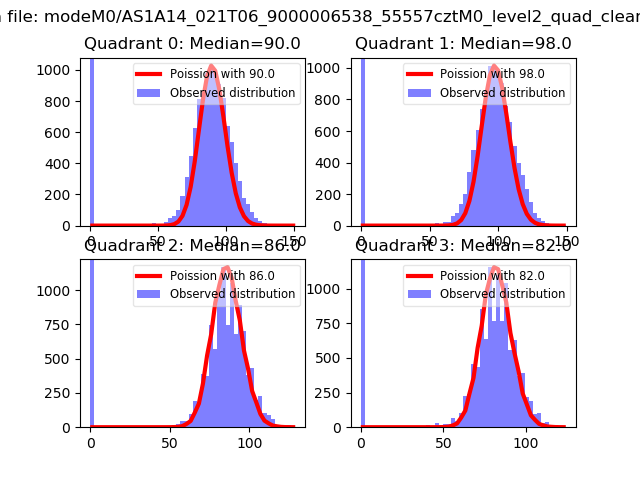 |
 |
| Quadrant-wise count rates Data is divided into 100 sec bins |
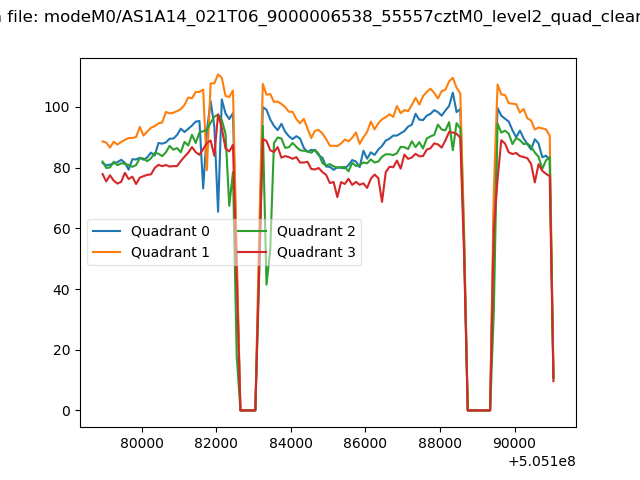 |
|
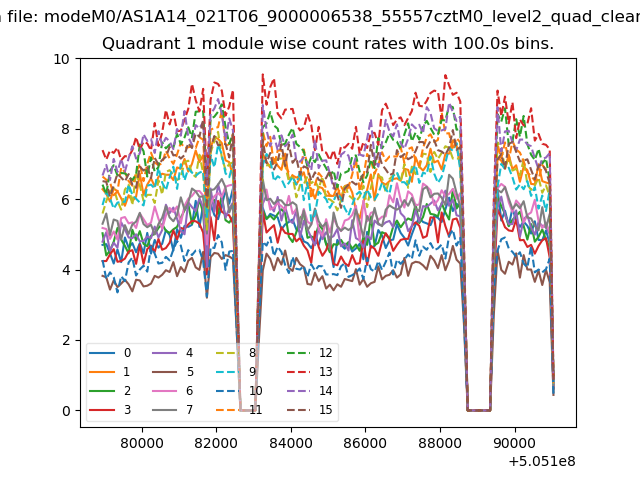
| Module-wise count rates for Quadrant A Data is divided into 100 sec bins |
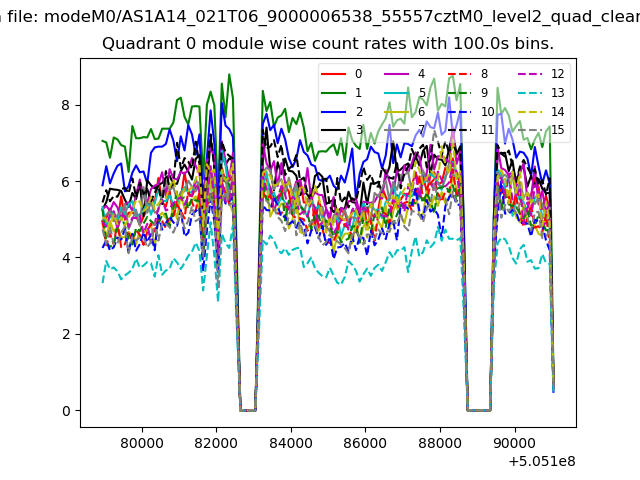 |
 |
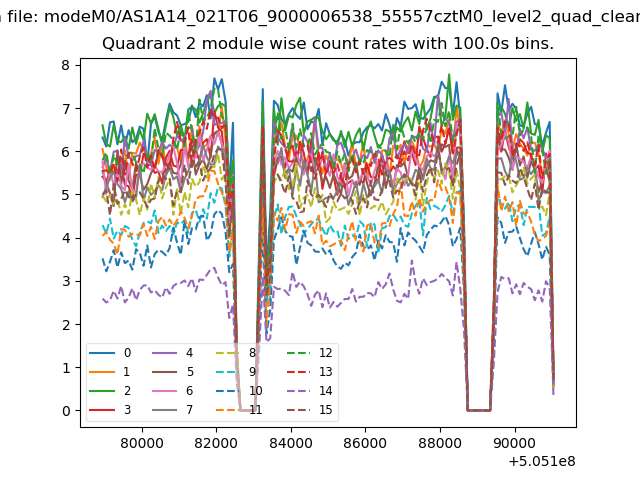
| Module-wise count rates for Quadrant B Data is divided into 100 sec bins |
 |
 |
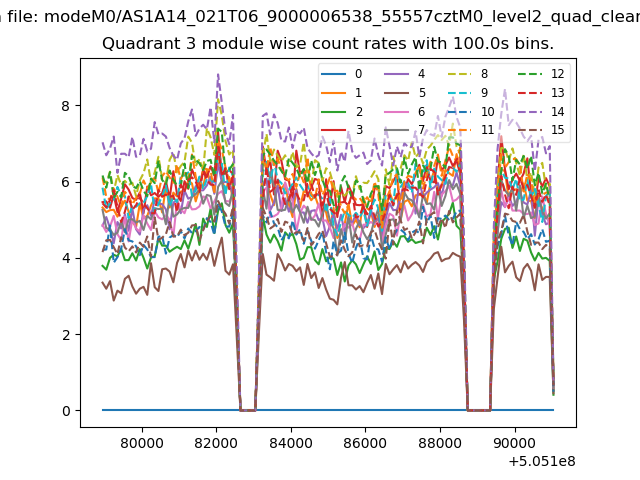
| Module-wise count rates for Quadrant C Data is divided into 100 sec bins |
 |
 |
| Module-wise count rates for Quadrant D Data is divided into 100 sec bins |
 |
 |
| Parameter | Plot |
|---|---|
| CZT HV Monitor | 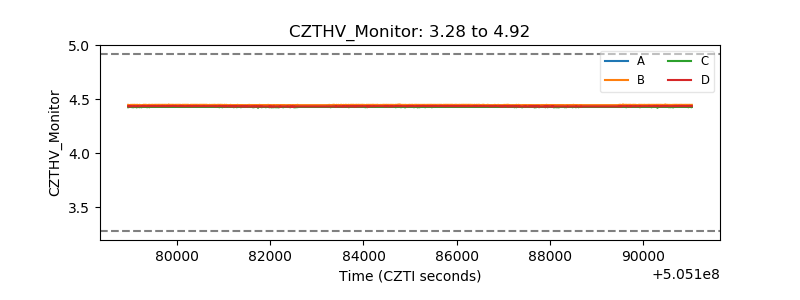 |
| D_VDD | 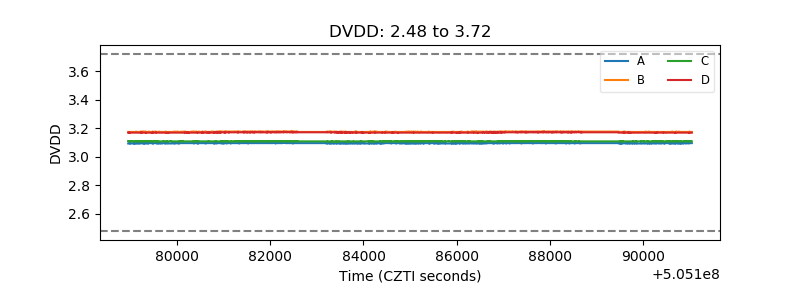 |
| Temperature 1 | 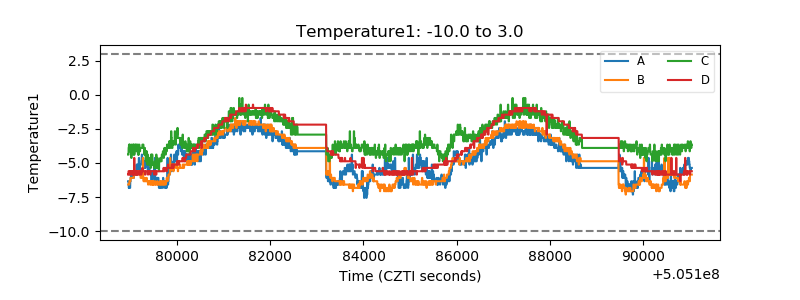 |
| Veto HV Monitor | 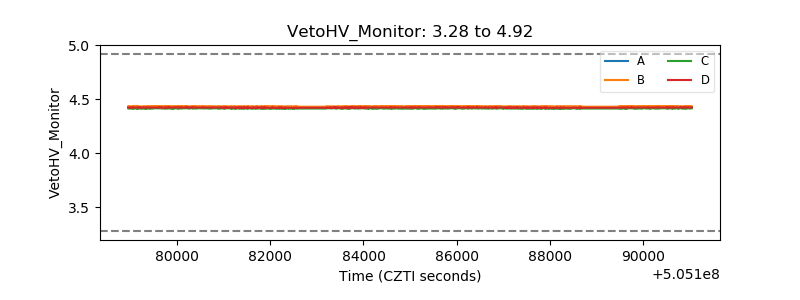 |
| Veto LLD | 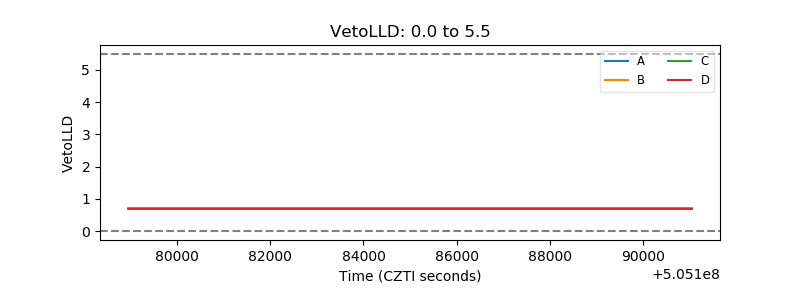 |
| Alpha Counter | 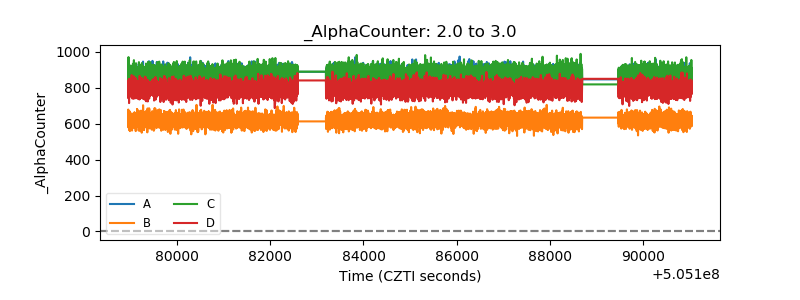 |
| _CPM_Rate | 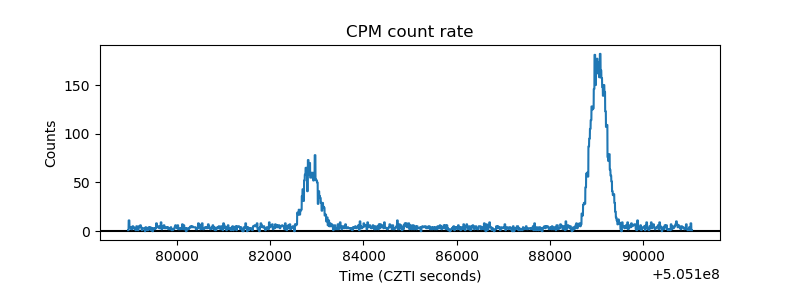 |
| CZT Counter | 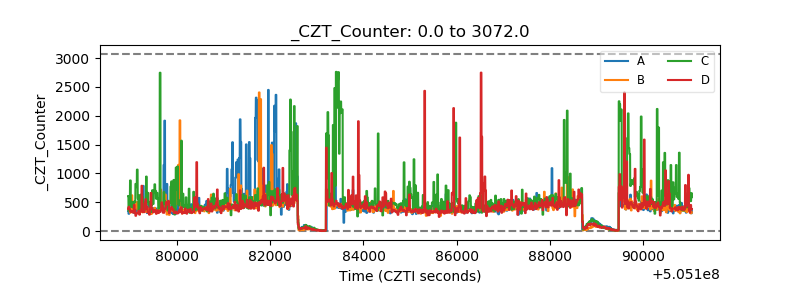 |
| +2.5 Volts monitor | 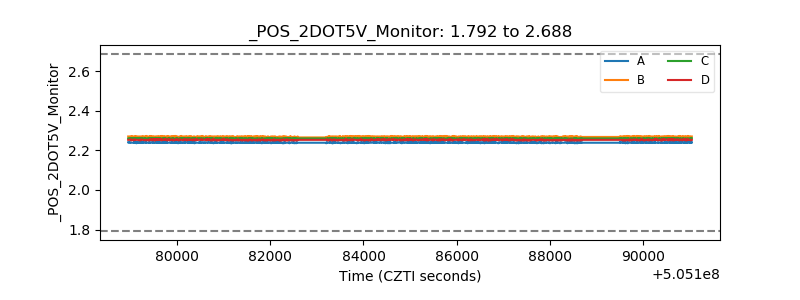 |
| +5 Volts monitor | 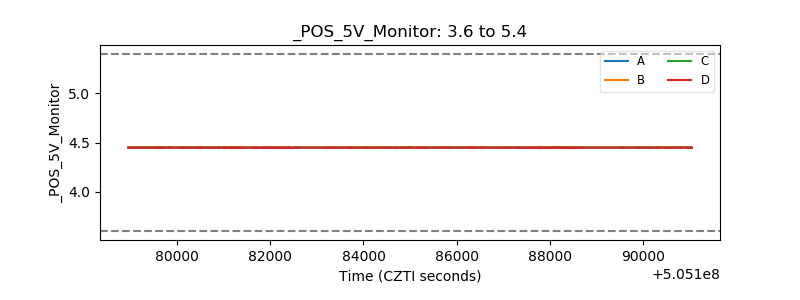 |
| _ROLL_ROT | 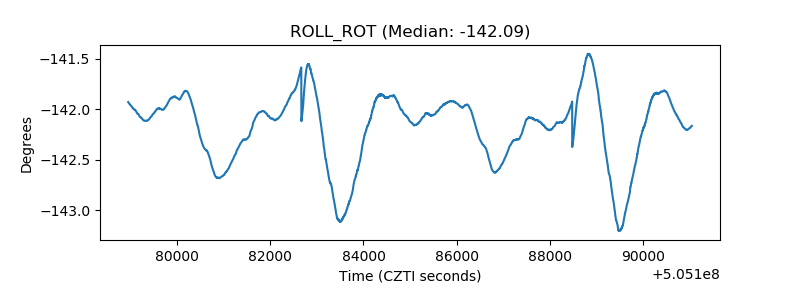 |
| _Roll_DEC | 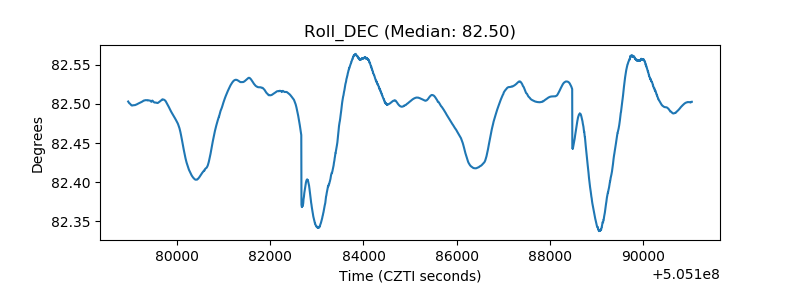 |
| _Roll_RA | 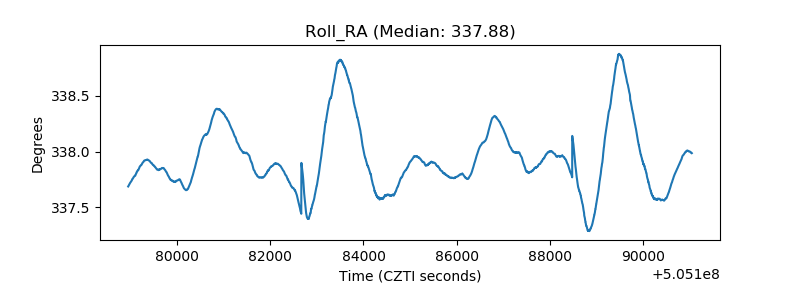 |
| Veto Counter | 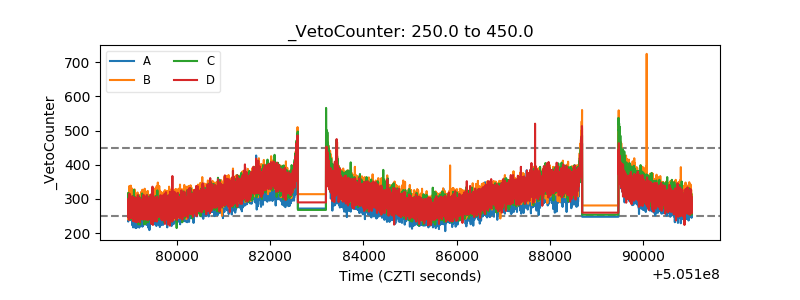 |