| Param | Original file | Final file |
|---|---|---|
| Filename | modeM0/AS1A14_021T06_9000006538_55560cztM0_level2.fits | modeM0/AS1A14_021T06_9000006538_55560cztM0_level2_quad_clean.evt |
| Size (bytes) | 397,215,360 | 95,987,520 |
| Size | 378.8 MB | 91.5 MB |
| Events in quadrant A | 2,891,805 | 622,041 |
| Events in quadrant B | 2,783,889 | 673,518 |
| Events in quadrant C | 4,462,060 | 590,226 |
| Events in quadrant D | 4,045,780 | 555,039 |
| Mode M9 | |||
|---|---|---|---|
| Quadrant | BADHDUFLAG | Total packets | Discarded packets |
| A | 0 | 15 | 0 |
| B | 0 | 15 | 0 |
| C | 0 | 16 | 0 |
| D | 0 | 16 | 0 |
| Mode M0 | |||
|---|---|---|---|
| Quadrant | BADHDUFLAG | Total packets | Discarded packets |
| A | 0 | 13706 | 2 |
| B | 0 | 13653 | 2 |
| C | 0 | 18102 | 2 |
| D | 0 | 16951 | 2 |
| Mode SS | |||
|---|---|---|---|
| Quadrant | BADHDUFLAG | Total packets | Discarded packets |
| A | 0 | 134 | 0 |
| B | 0 | 134 | 0 |
| C | 0 | 134 | 0 |
| D | 0 | 134 | 0 |
| Quadrant | Total seconds | Saturated seconds | Saturation percentage |
|---|---|---|---|
| A | 6684 | 48 | 0.718133% |
| B | 6684 | 59 | 0.882705% |
| C | 6684 | 123 | 1.840215% |
| D | 6684 | 166 | 2.483543% |
Noise dominated data is calculated using 1-second bins in cleaned event files. If a bin has >2000 counts, and if more than 50% of those come from <1% of pixels, then it is considered to be noise-dominated and hence unusable.
| Quadrant | # 1 sec bins | Bins with >0 counts | Bins with >2000 counts | High rate bins dominated by noise | Noise dominated (total time) | Noise dominated (detector-on time) | Marked lightcurve |
|---|---|---|---|---|---|---|---|
| A | 7739 | 6684 | 8 | 8 | 0.10% | 0.12% | 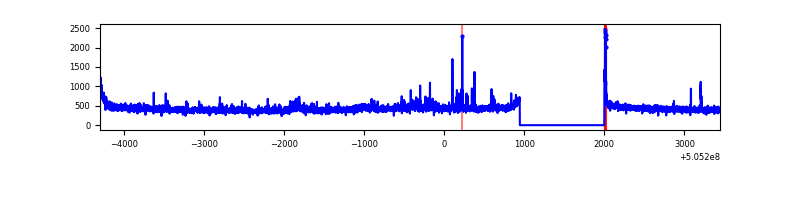 |
| B | 7739 | 6684 | 1 | 1 | 0.01% | 0.01% | 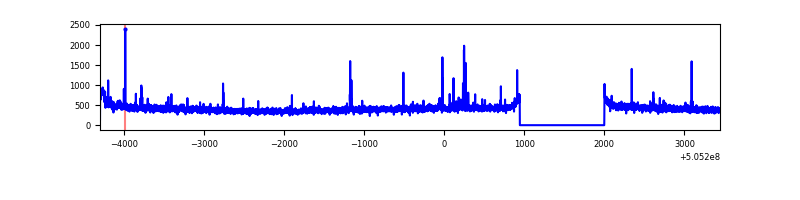 |
| C | 7739 | 6684 | 90 | 90 | 1.16% | 1.35% | 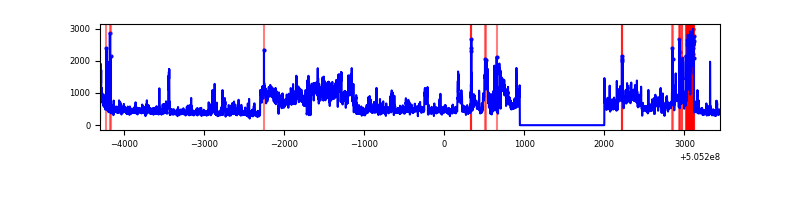 |
| D | 7739 | 6685 | 173 | 173 | 2.24% | 2.59% | 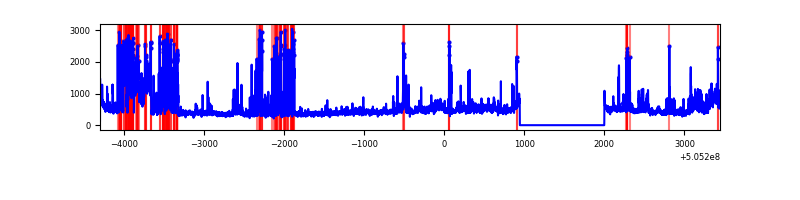 |
Top three noisy pixels from each quadrant. If the there are fewer than three noisy pixels in the level2.evt file, extra rows are filled as -1
| Pixel properties | Quadrant properties | ||||||
|---|---|---|---|---|---|---|---|
| Quadrant | DetID | PixID | Counts | Sigma | Mean | Median | Sigma |
| A | 4 | 159 | 64104 | 374.55 | 688 | 670 | 169.4 |
| A | 8 | 6 | 46286 | 269.34 | 688 | 670 | 169.4 |
| A | 3 | 14 | 40538 | 235.4 | 688 | 670 | 169.4 |
| B | 12 | 111 | 18061 | 120.0 | 681 | 657 | 145.0 |
| B | 7 | 252 | 16643 | 110.23 | 681 | 657 | 145.0 |
| B | 11 | 111 | 16393 | 108.5 | 681 | 657 | 145.0 |
| C | 13 | 3 | 1440743 | 7923.15 | 661 | 654 | 181.8 |
| C | 9 | 38 | 369171 | 2027.53 | 661 | 654 | 181.8 |
| C | 15 | 178 | 23460 | 125.48 | 661 | 654 | 181.8 |
| D | 11 | 129 | 464212 | 2483.38 | 657 | 626 | 186.7 |
| D | 8 | 245 | 433530 | 2319.02 | 657 | 626 | 186.7 |
| D | 2 | 172 | 315287 | 1685.6 | 657 | 626 | 186.7 |
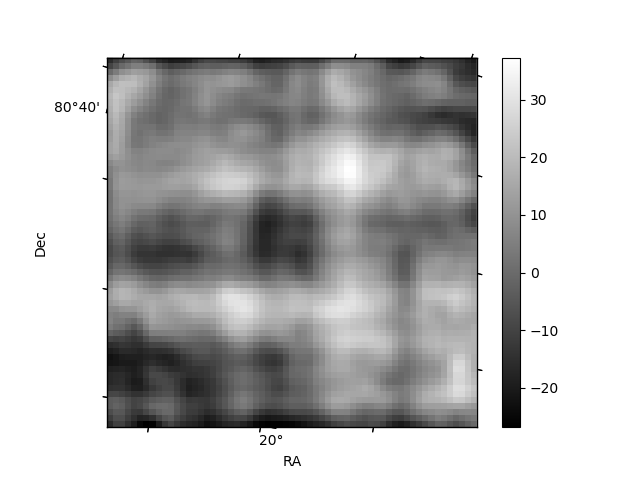
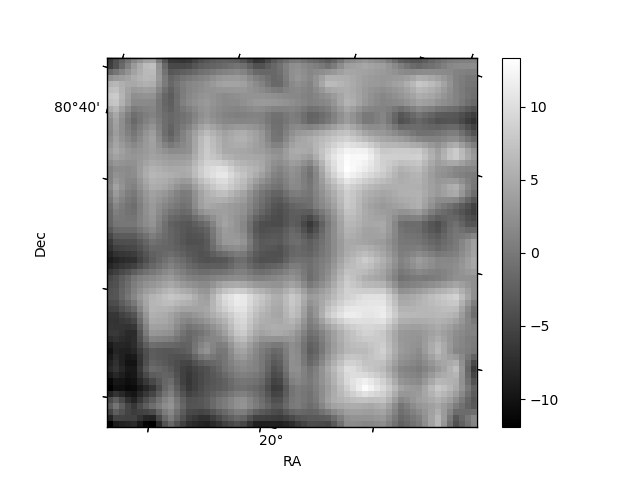
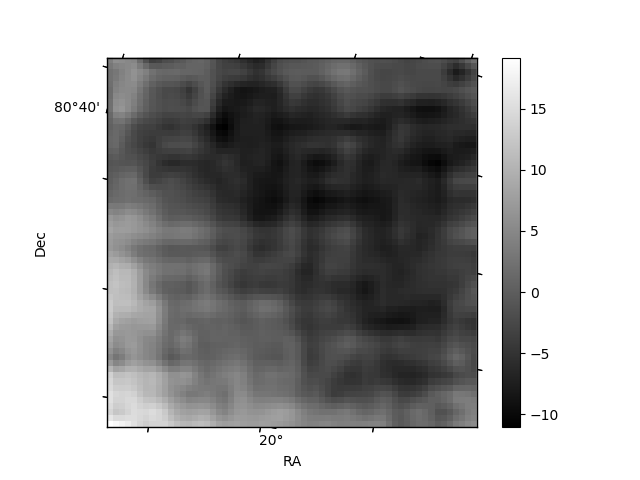
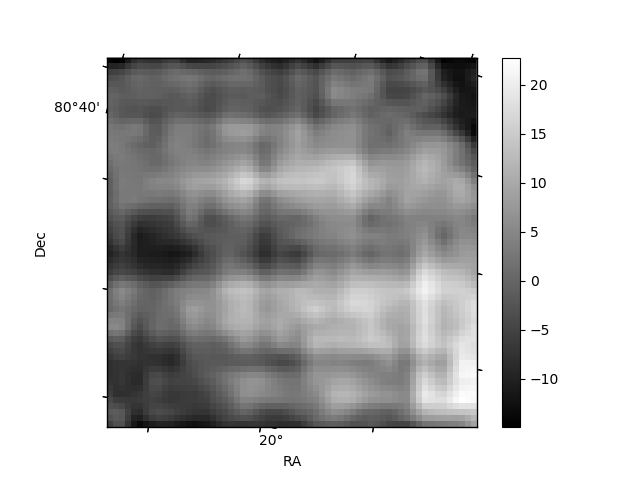
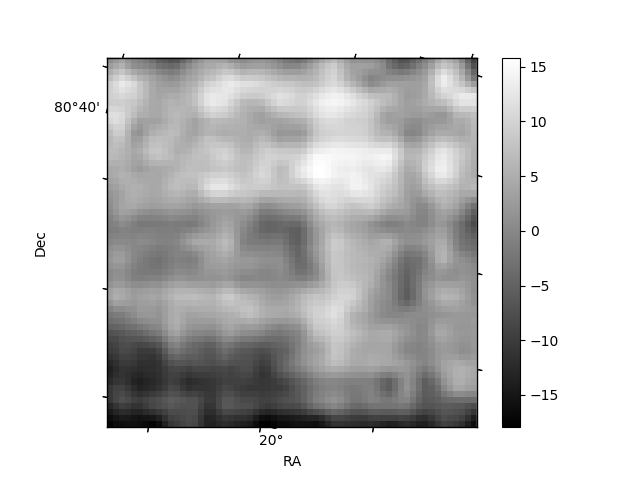
Histogram calculated using DETX and DETY for each event in the final _common_clean file
| Quadrant A | 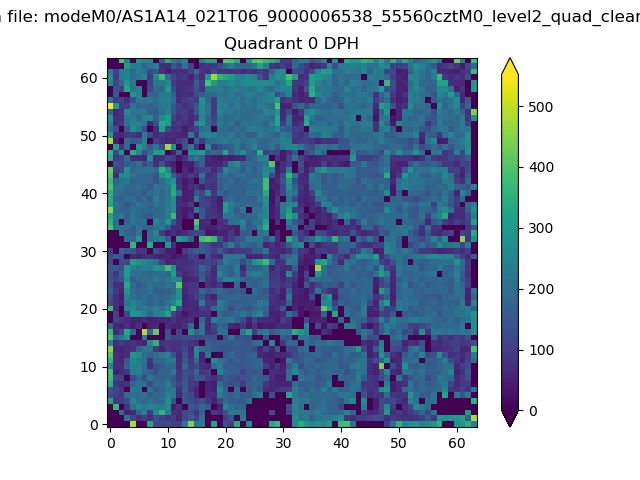 |
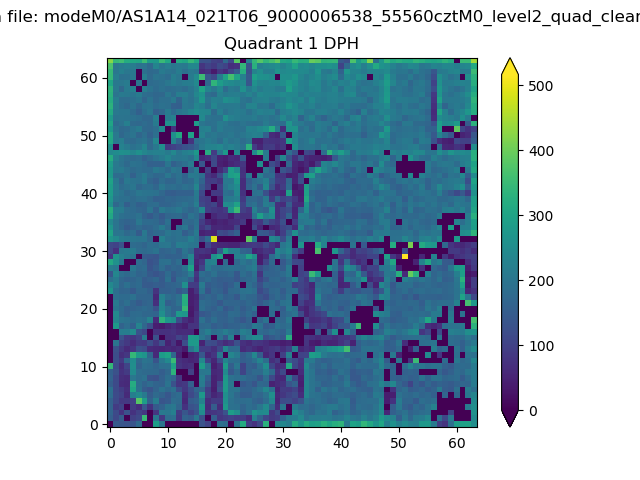 |
Quadrant B |
|---|---|---|---|
| Quadrant D | 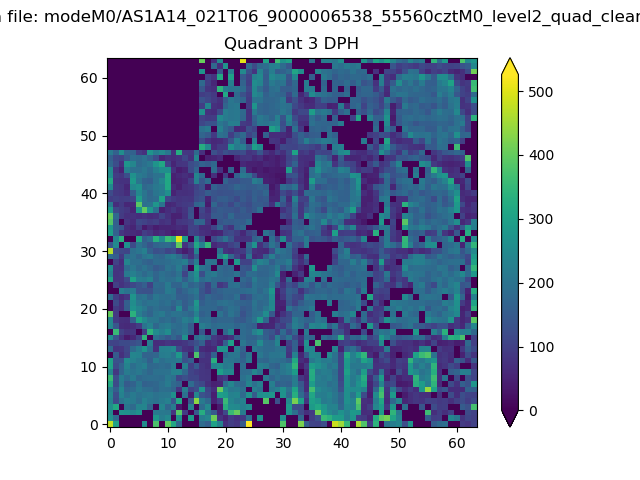 |
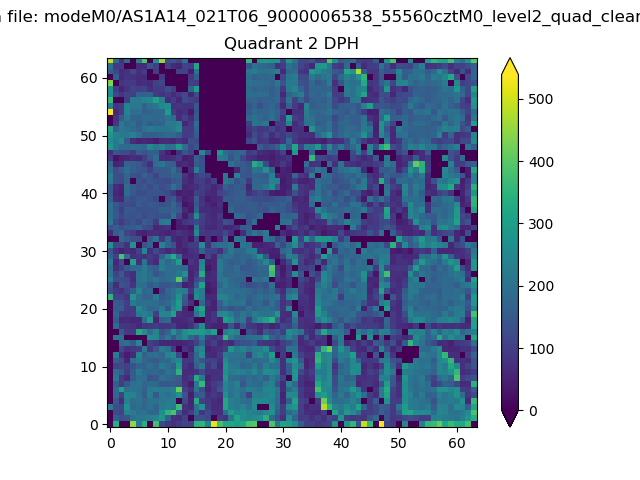 |
Quadrant C |
| Plot type | Count rate plots | Images |
|---|---|---|
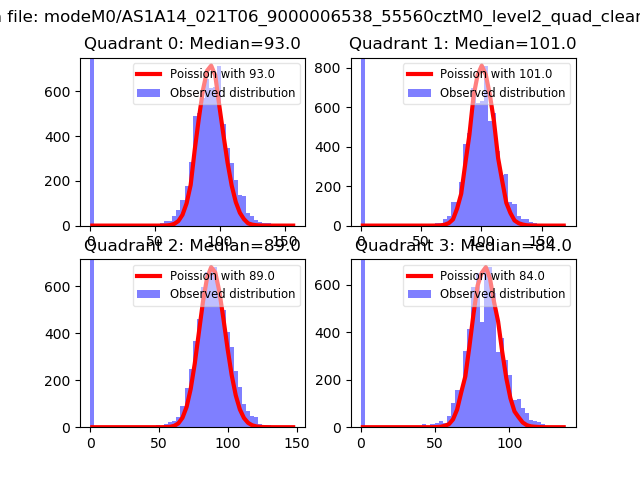
| Comparison with Poisson distribution Blue bars denote a histogram of data divided into 1 sec bins. Red curve is a Poisson curve with rate = median count rate of data. |
 |
 |
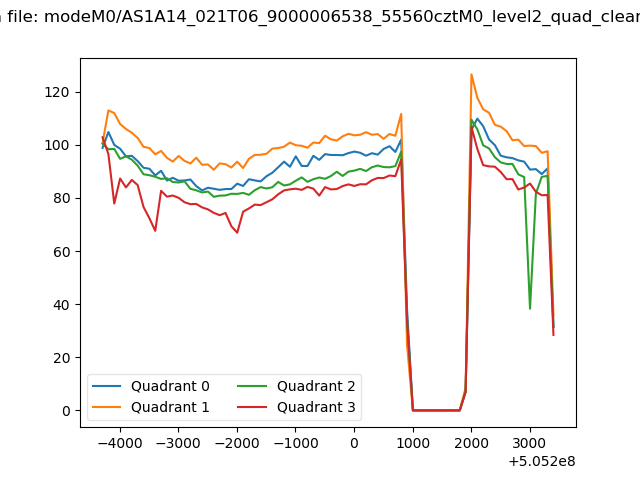
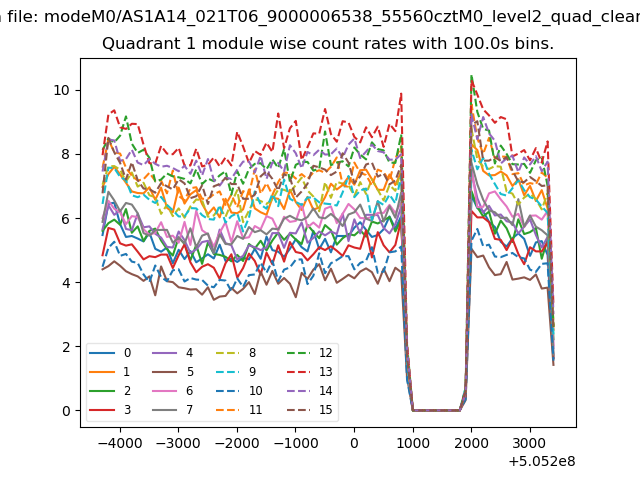
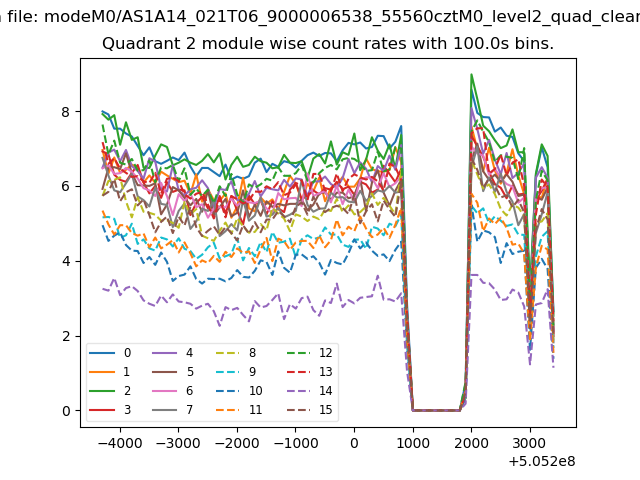
| Quadrant-wise count rates Data is divided into 100 sec bins |
 |
|
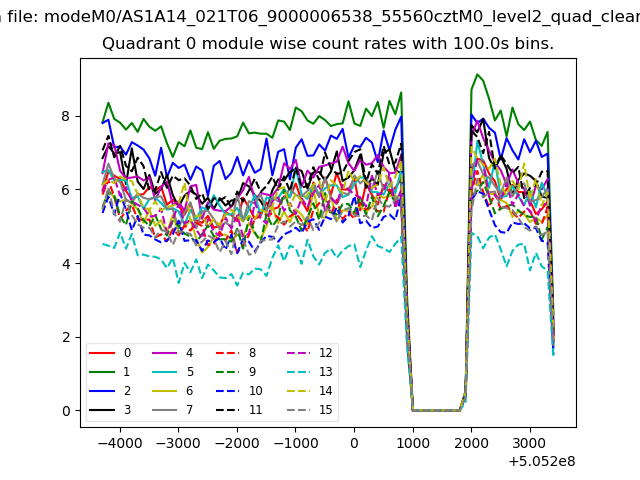
| Module-wise count rates for Quadrant A Data is divided into 100 sec bins |
 |
 |
| Module-wise count rates for Quadrant B Data is divided into 100 sec bins |
 |
 |
| Module-wise count rates for Quadrant C Data is divided into 100 sec bins |
 |
 |
| Module-wise count rates for Quadrant D Data is divided into 100 sec bins |
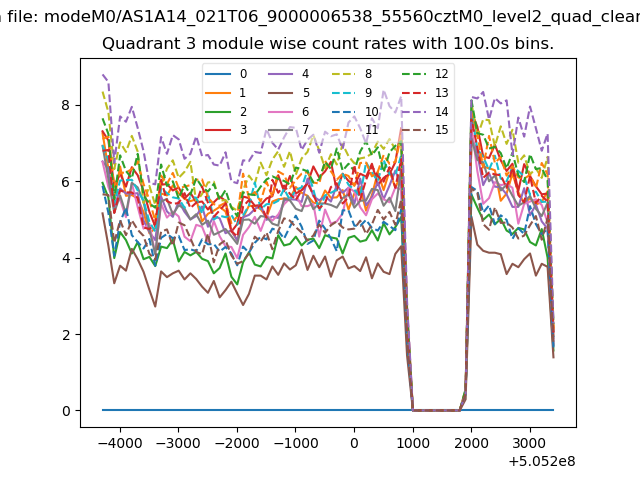 |
 |
| Parameter | Plot |
|---|---|
| CZT HV Monitor | 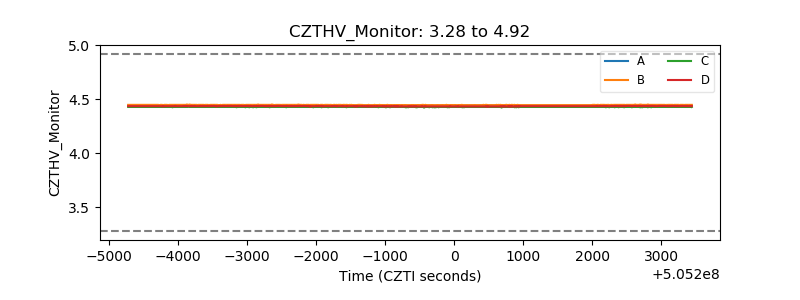 |
| D_VDD | 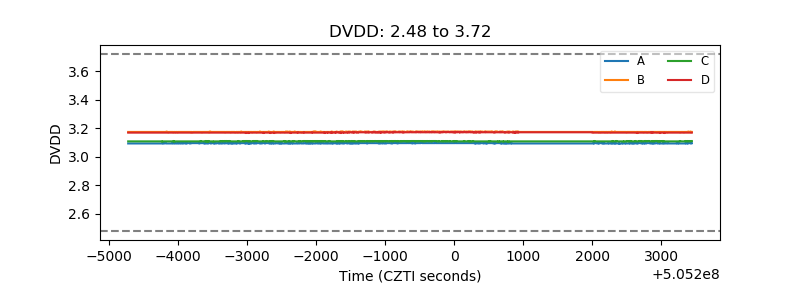 |
| Temperature 1 | 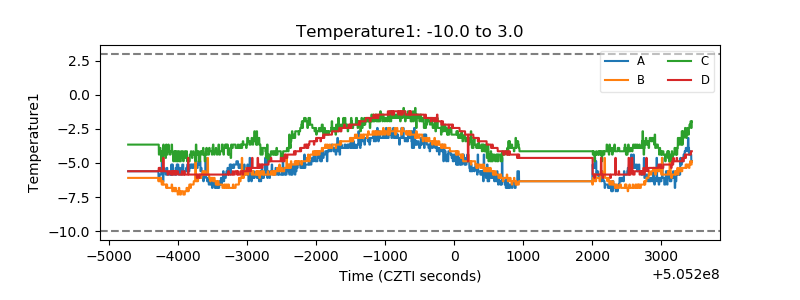 |
| Veto HV Monitor | 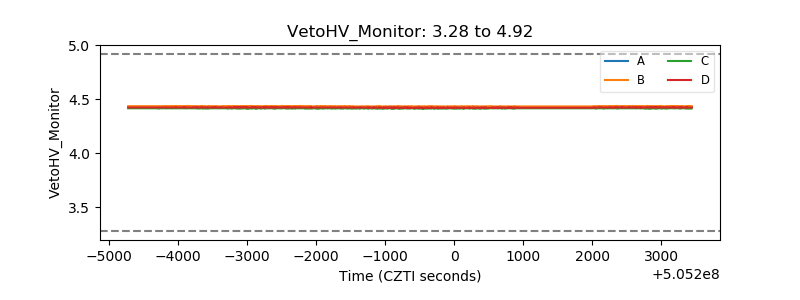 |
| Veto LLD | 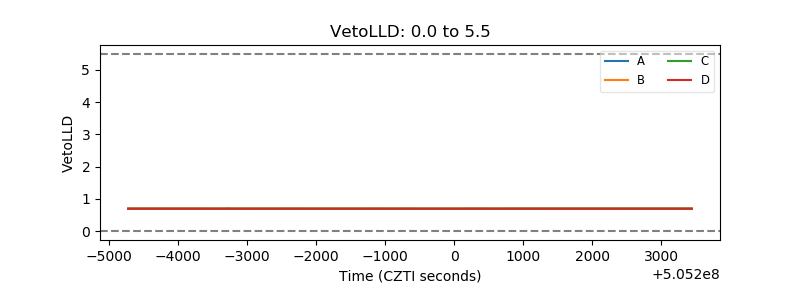 |
| Alpha Counter | 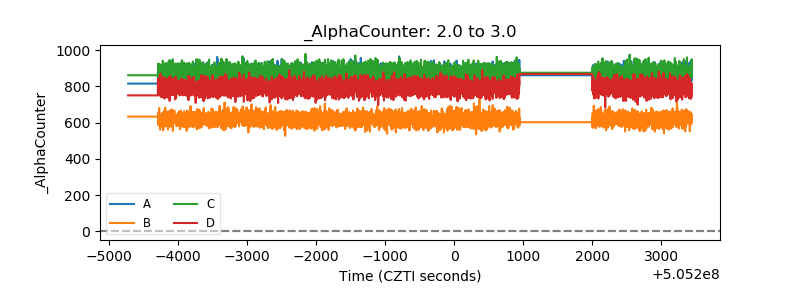 |
| _CPM_Rate | 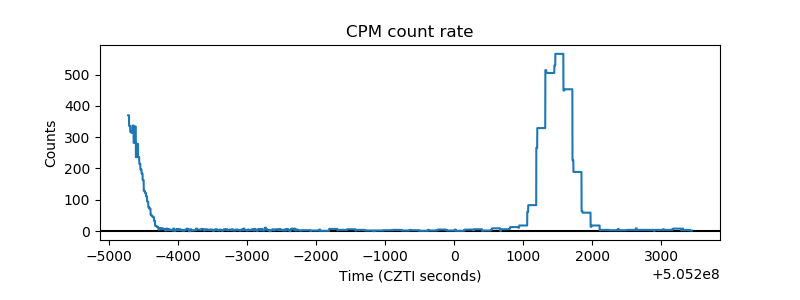 |
| CZT Counter | 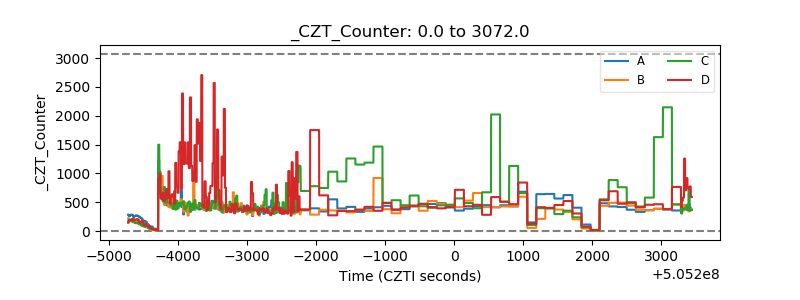 |
| +2.5 Volts monitor |  |
| +5 Volts monitor |  |
| _ROLL_ROT | 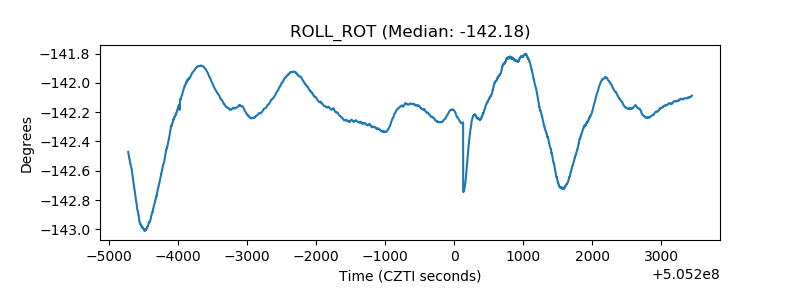 |
| _Roll_DEC | 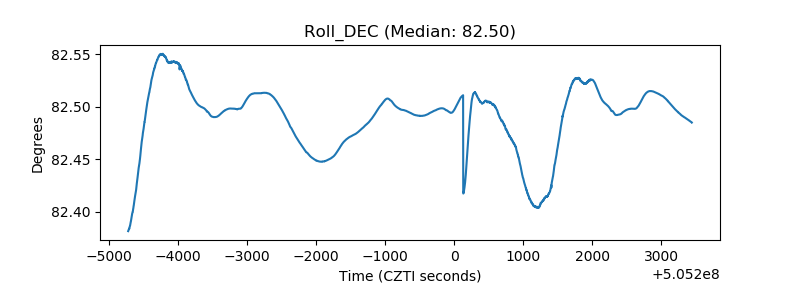 |
| _Roll_RA | 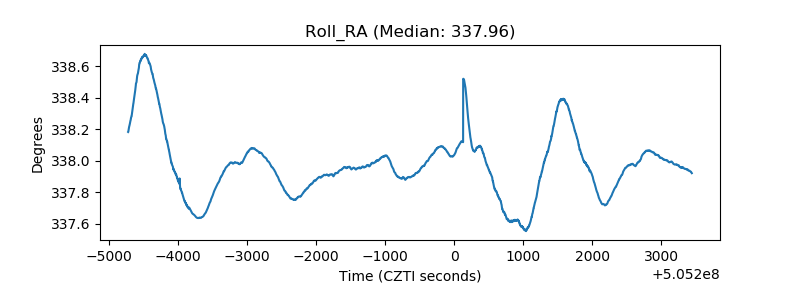 |
| Veto Counter | 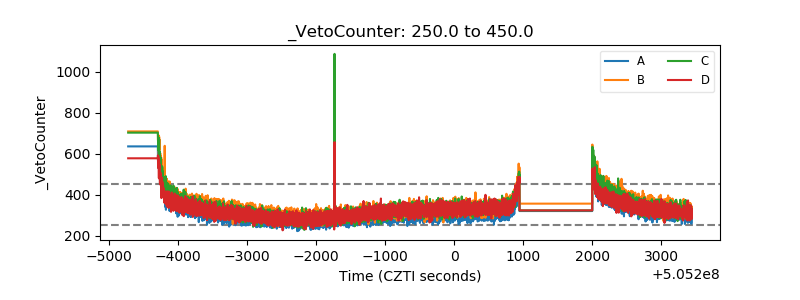 |