| Param | Original file | Final file |
|---|---|---|
| Filename | modeM0/AS1A14_021T06_9000006538_55563cztM0_level2.fits | modeM0/AS1A14_021T06_9000006538_55563cztM0_level2_quad_clean.evt |
| Size (bytes) | 320,725,440 | 85,864,320 |
| Size | 305.9 MB | 81.9 MB |
| Events in quadrant A | 2,713,549 | 559,571 |
| Events in quadrant B | 2,633,601 | 603,351 |
| Events in quadrant C | 2,816,105 | 535,217 |
| Events in quadrant D | 3,255,038 | 494,415 |
| Mode M9 | |||
|---|---|---|---|
| Quadrant | BADHDUFLAG | Total packets | Discarded packets |
| A | 0 | 12 | 0 |
| B | 0 | 12 | 0 |
| C | 0 | 12 | 0 |
| D | 0 | 13 | 0 |
| Mode M0 | |||
|---|---|---|---|
| Quadrant | BADHDUFLAG | Total packets | Discarded packets |
| A | 0 | 12751 | 302 |
| B | 0 | 12604 | 270 |
| C | 0 | 12876 | 253 |
| D | 0 | 14245 | 368 |
| Mode SS | |||
|---|---|---|---|
| Quadrant | BADHDUFLAG | Total packets | Discarded packets |
| A | 0 | 124 | 2 |
| B | 0 | 124 | 2 |
| C | 0 | 124 | 0 |
| D | 0 | 124 | 0 |
| Quadrant | Total seconds | Saturated seconds | Saturation percentage |
|---|---|---|---|
| A | 5810 | 119 | 2.048193% |
| B | 5816 | 122 | 2.097662% |
| C | 5830 | 42 | 0.720412% |
| D | 5802 | 175 | 3.016201% |
Noise dominated data is calculated using 1-second bins in cleaned event files. If a bin has >2000 counts, and if more than 50% of those come from <1% of pixels, then it is considered to be noise-dominated and hence unusable.
| Quadrant | # 1 sec bins | Bins with >0 counts | Bins with >2000 counts | High rate bins dominated by noise | Noise dominated (total time) | Noise dominated (detector-on time) | Marked lightcurve |
|---|---|---|---|---|---|---|---|
| A | 7707 | 5936 | 30 | 30 | 0.39% | 0.51% | 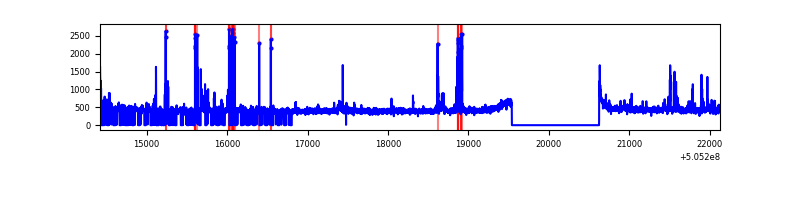 |
| B | 7708 | 5943 | 13 | 13 | 0.17% | 0.22% | 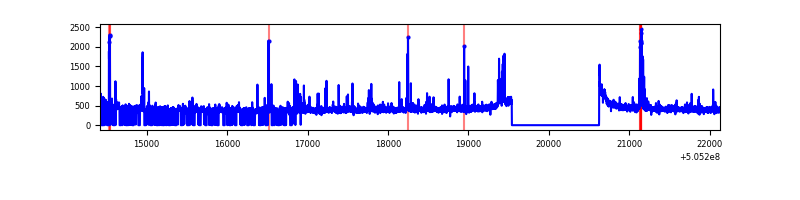 |
| C | 7707 | 5940 | 10 | 10 | 0.13% | 0.17% | 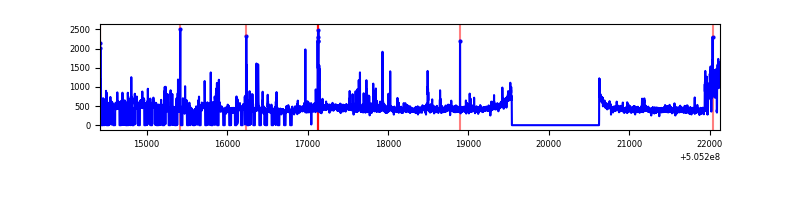 |
| D | 7707 | 5924 | 136 | 136 | 1.76% | 2.30% | 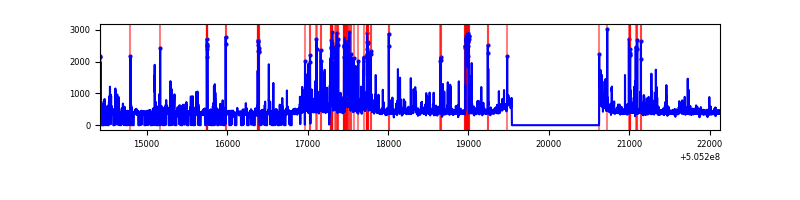 |
Top three noisy pixels from each quadrant. If the there are fewer than three noisy pixels in the level2.evt file, extra rows are filled as -1
| Pixel properties | Quadrant properties | ||||||
|---|---|---|---|---|---|---|---|
| Quadrant | DetID | PixID | Counts | Sigma | Mean | Median | Sigma |
| A | 0 | 8 | 215281 | 1414.92 | 615 | 599 | 151.7 |
| A | 3 | 14 | 31577 | 204.17 | 615 | 599 | 151.7 |
| A | 14 | 254 | 19484 | 124.47 | 615 | 599 | 151.7 |
| B | 1 | 238 | 64521 | 497.24 | 603 | 579 | 128.6 |
| B | 10 | 247 | 60160 | 463.33 | 603 | 579 | 128.6 |
| B | 9 | 254 | 30790 | 234.93 | 603 | 579 | 128.6 |
| C | 9 | 38 | 241386 | 1486.6 | 592 | 587 | 162.0 |
| C | 13 | 3 | 164558 | 1012.29 | 592 | 587 | 162.0 |
| C | 15 | 178 | 78182 | 479.04 | 592 | 587 | 162.0 |
| D | 11 | 129 | 294827 | 1765.91 | 588 | 561 | 166.6 |
| D | 2 | 31 | 167655 | 1002.74 | 588 | 561 | 166.6 |
| D | 8 | 128 | 101334 | 604.74 | 588 | 561 | 166.6 |
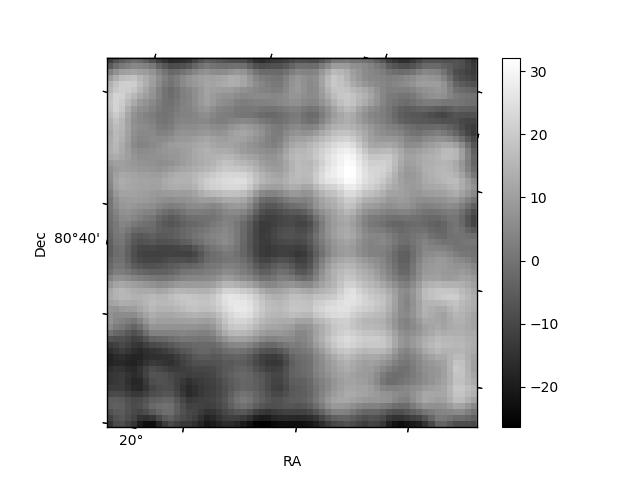
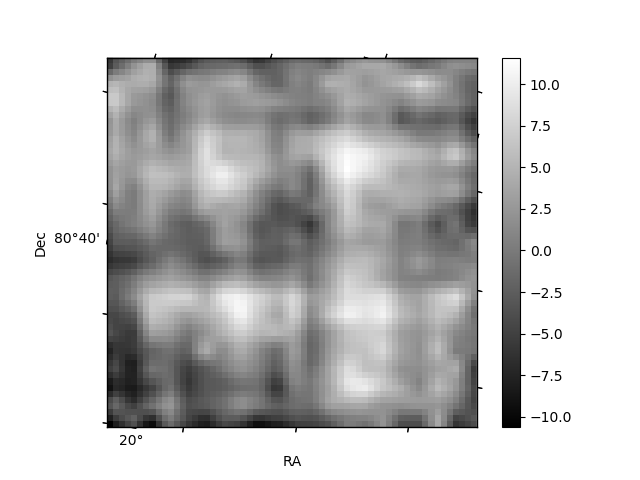
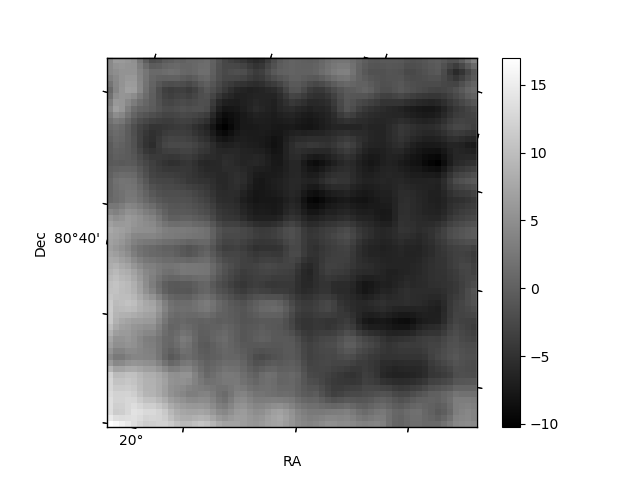
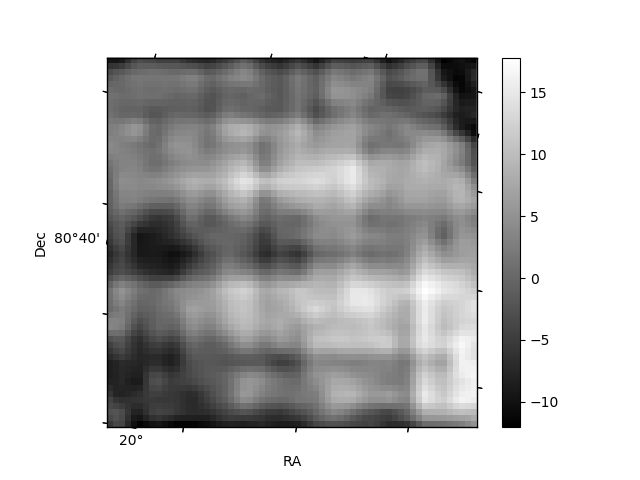
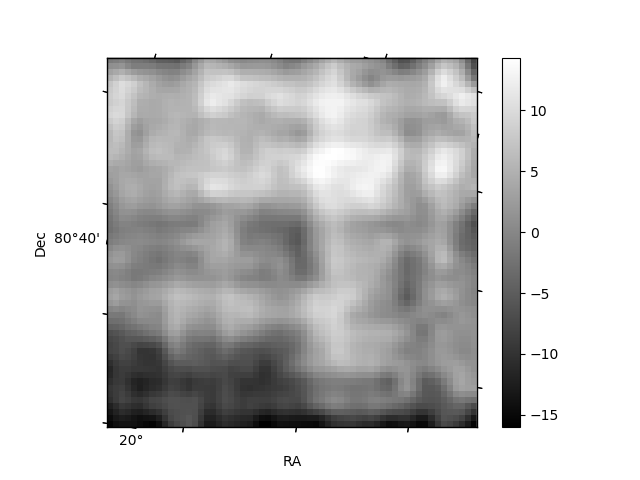
Histogram calculated using DETX and DETY for each event in the final _common_clean file
| Quadrant A | 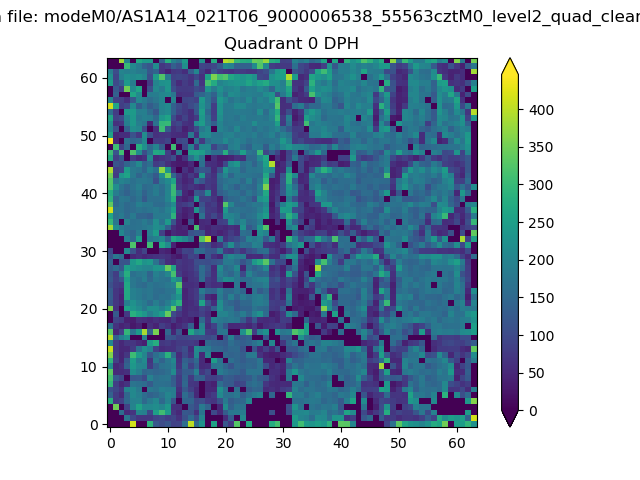 |
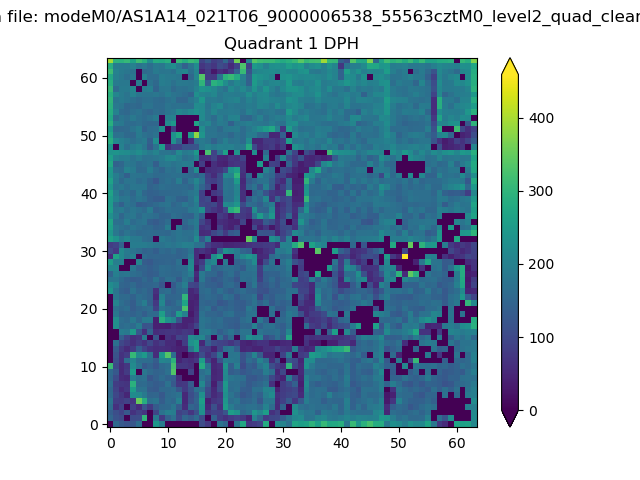 |
Quadrant B |
|---|---|---|---|
| Quadrant D | 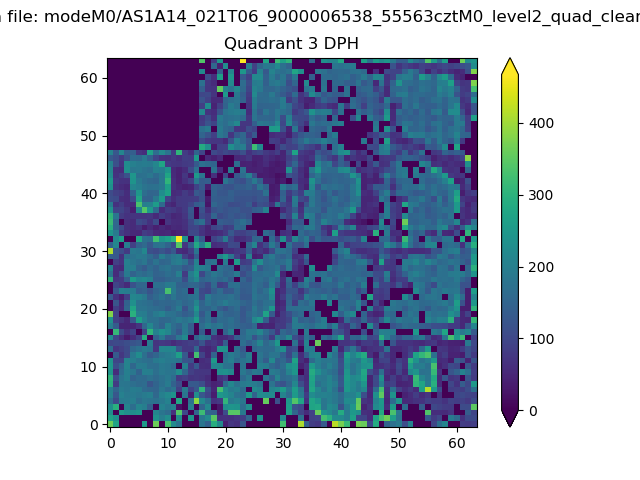 |
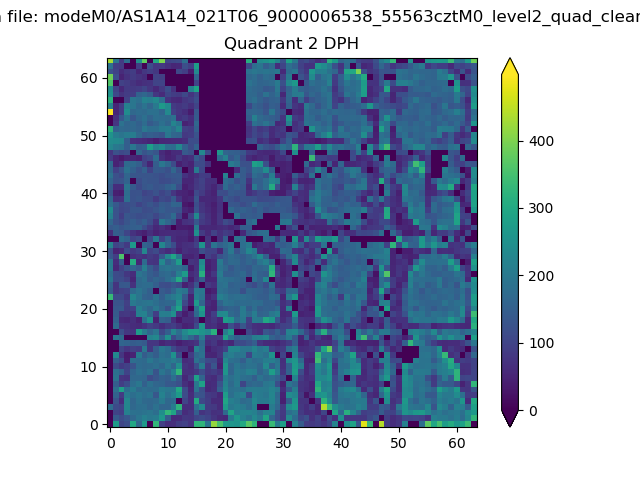 |
Quadrant C |
| Plot type | Count rate plots | Images |
|---|---|---|
| Comparison with Poisson distribution Blue bars denote a histogram of data divided into 1 sec bins. Red curve is a Poisson curve with rate = median count rate of data. |
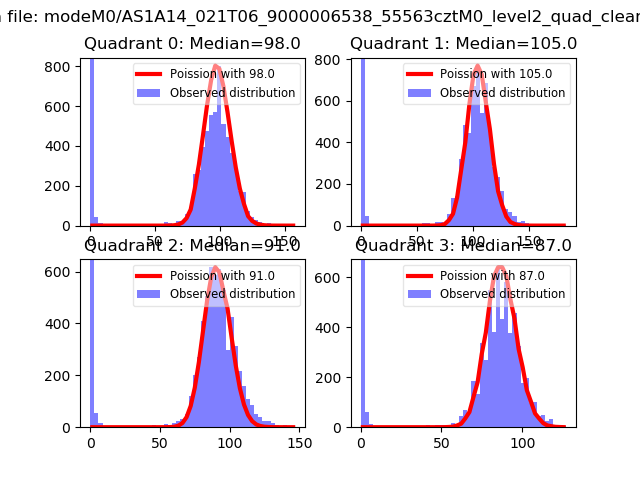 |
 |
| Quadrant-wise count rates Data is divided into 100 sec bins |
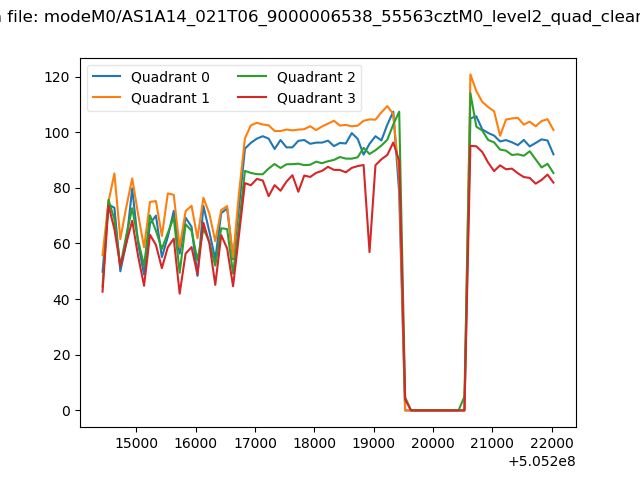 |
|
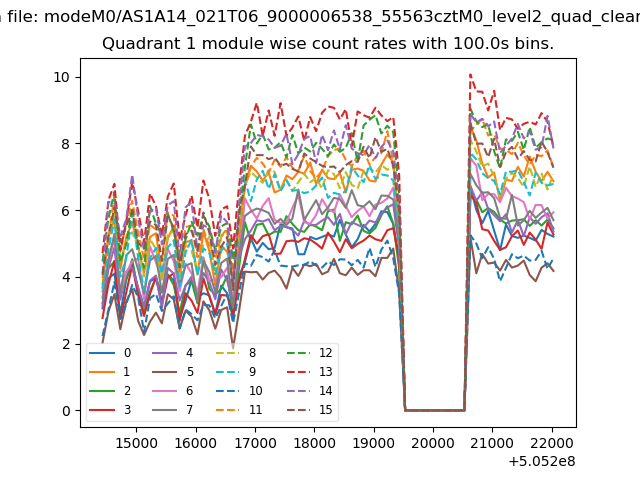
| Module-wise count rates for Quadrant A Data is divided into 100 sec bins |
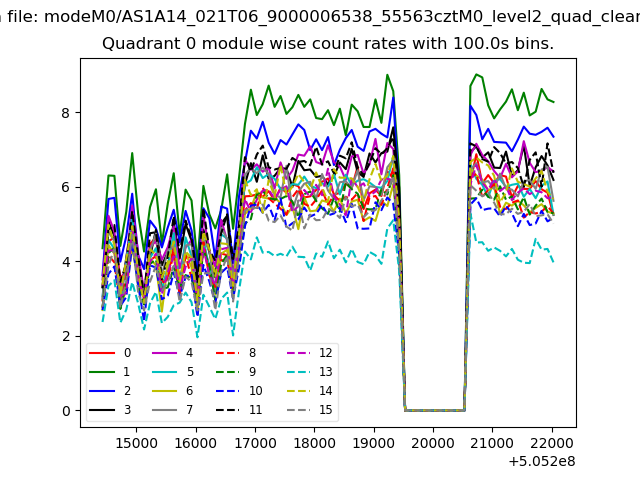 |
 |
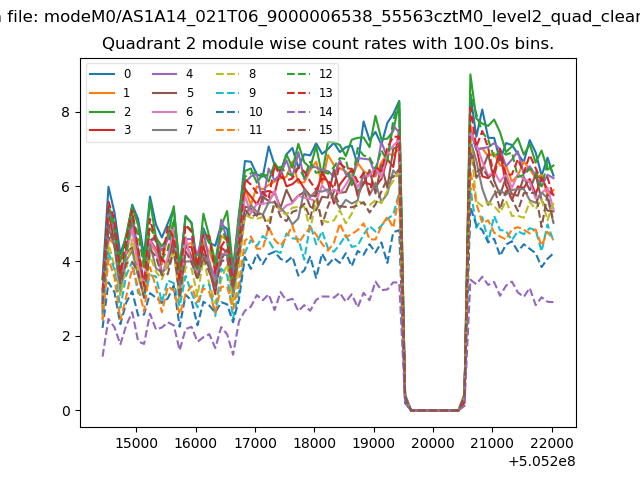
| Module-wise count rates for Quadrant B Data is divided into 100 sec bins |
 |
 |
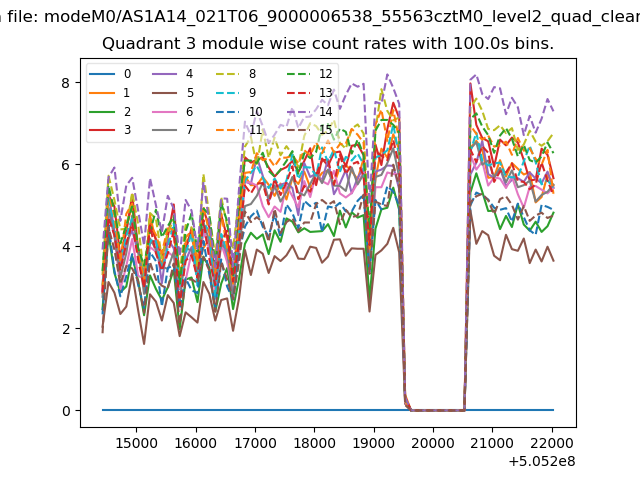
| Module-wise count rates for Quadrant C Data is divided into 100 sec bins |
 |
 |
| Module-wise count rates for Quadrant D Data is divided into 100 sec bins |
 |
 |
| Parameter | Plot |
|---|---|
| CZT HV Monitor | 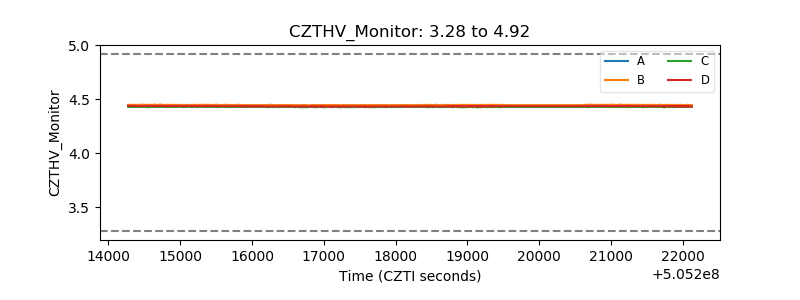 |
| D_VDD | 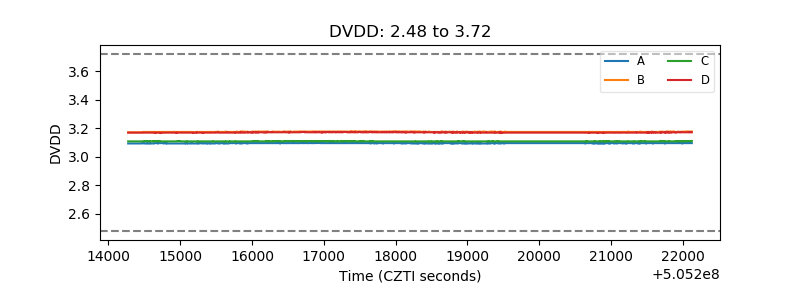 |
| Temperature 1 | 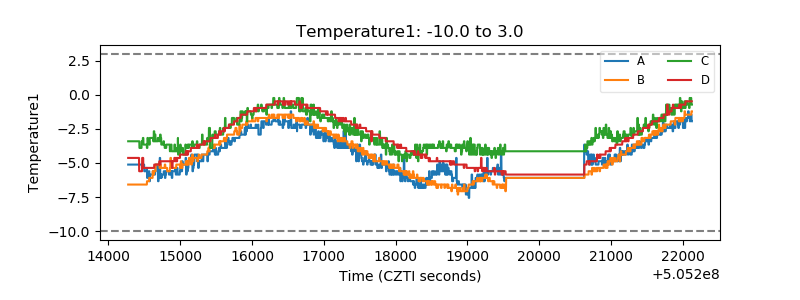 |
| Veto HV Monitor | 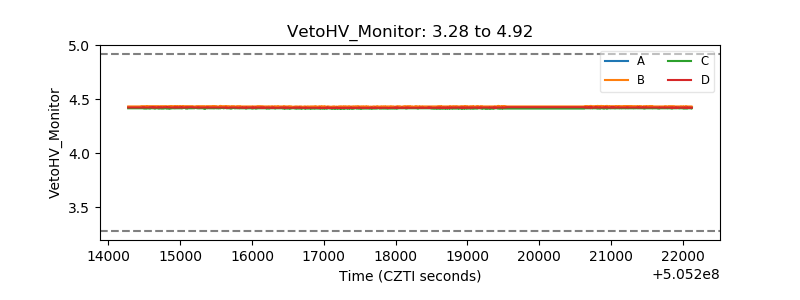 |
| Veto LLD | 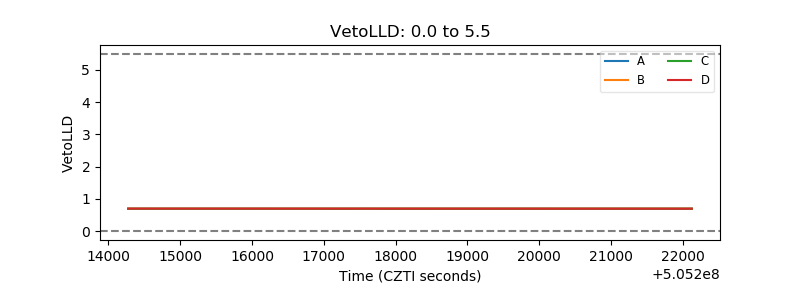 |
| Alpha Counter | 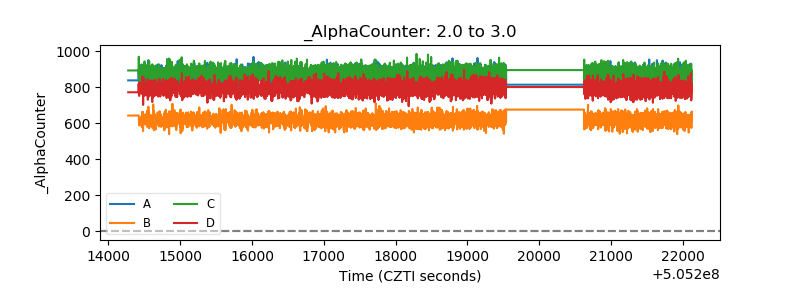 |
| _CPM_Rate | 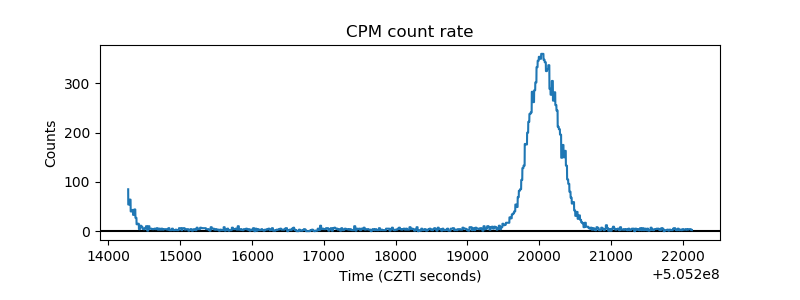 |
| CZT Counter | 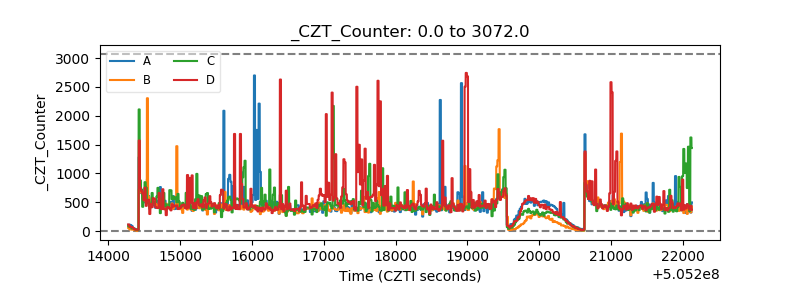 |
| +2.5 Volts monitor |  |
| +5 Volts monitor |  |
| _ROLL_ROT | 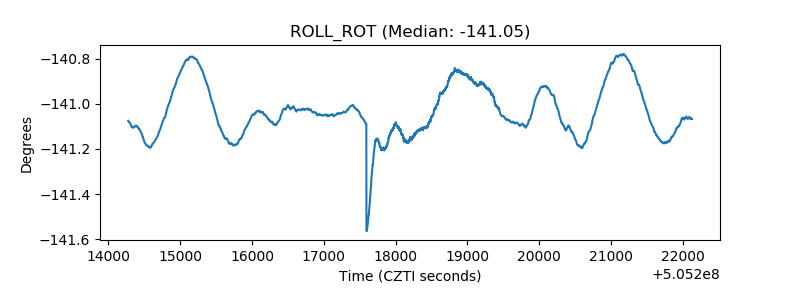 |
| _Roll_DEC | 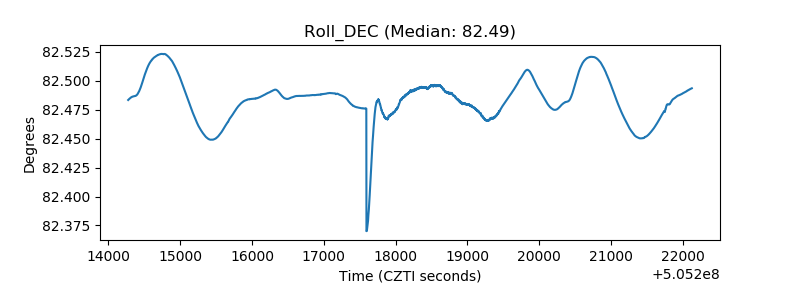 |
| _Roll_RA | 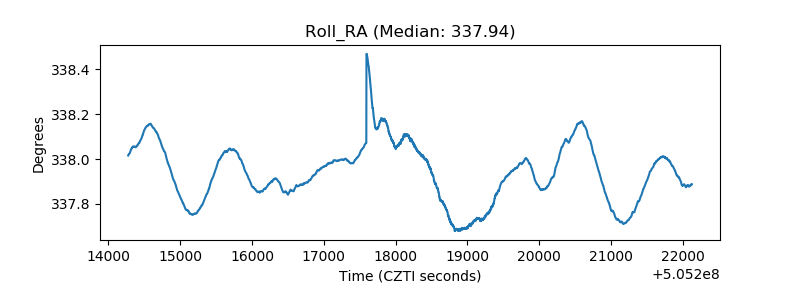 |
| Veto Counter | 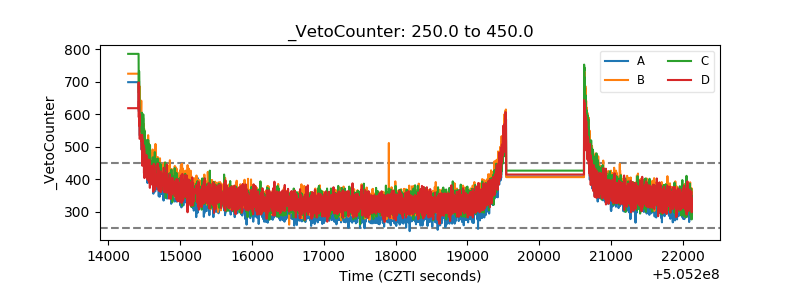 |