| Param | Original file | Final file |
|---|---|---|
| Filename | modeM0/AS1A14_021T06_9000006538_55565cztM0_level2.fits | modeM0/AS1A14_021T06_9000006538_55565cztM0_level2_quad_clean.evt |
| Size (bytes) | 572,912,640 | 97,758,720 |
| Size | 546.4 MB | 93.2 MB |
| Events in quadrant A | 3,380,764 | 655,374 |
| Events in quadrant B | 3,228,255 | 700,188 |
| Events in quadrant C | 9,057,783 | 544,287 |
| Events in quadrant D | 4,995,779 | 570,380 |
| Mode M9 | |||
|---|---|---|---|
| Quadrant | BADHDUFLAG | Total packets | Discarded packets |
| A | 0 | 7 | 0 |
| B | 0 | 7 | 0 |
| C | 0 | 7 | 0 |
| D | 0 | 7 | 0 |
| Mode M0 | |||
|---|---|---|---|
| Quadrant | BADHDUFLAG | Total packets | Discarded packets |
| A | 0 | 15221 | 1 |
| B | 0 | 14956 | 1 |
| C | 0 | 31893 | 1 |
| D | 0 | 19803 | 1 |
| Mode SS | |||
|---|---|---|---|
| Quadrant | BADHDUFLAG | Total packets | Discarded packets |
| A | 0 | 142 | 0 |
| B | 0 | 142 | 0 |
| C | 0 | 142 | 0 |
| D | 0 | 142 | 0 |
| Quadrant | Total seconds | Saturated seconds | Saturation percentage |
|---|---|---|---|
| A | 7033 | 103 | 1.464524% |
| B | 7033 | 92 | 1.308119% |
| C | 7033 | 963 | 13.692592% |
| D | 7034 | 267 | 3.795849% |
Noise dominated data is calculated using 1-second bins in cleaned event files. If a bin has >2000 counts, and if more than 50% of those come from <1% of pixels, then it is considered to be noise-dominated and hence unusable.
| Quadrant | # 1 sec bins | Bins with >0 counts | Bins with >2000 counts | High rate bins dominated by noise | Noise dominated (total time) | Noise dominated (detector-on time) | Marked lightcurve |
|---|---|---|---|---|---|---|---|
| A | 7687 | 7032 | 15 | 15 | 0.20% | 0.21% | 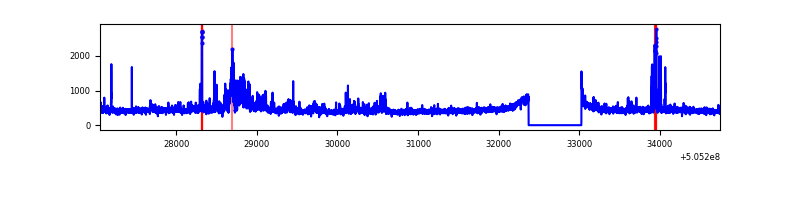 |
| B | 7687 | 7032 | 16 | 16 | 0.21% | 0.23% | 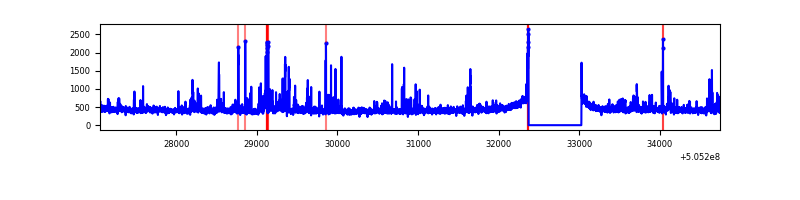 |
| C | 7687 | 7032 | 836 | 836 | 10.88% | 11.89% | 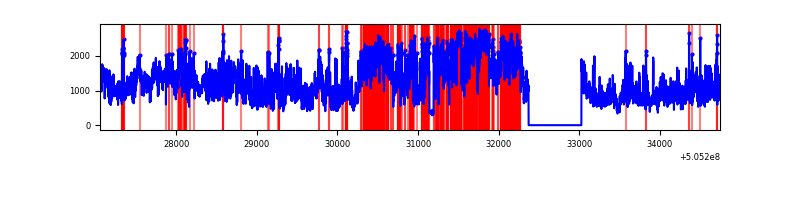 |
| D | 7688 | 7033 | 159 | 159 | 2.07% | 2.26% | 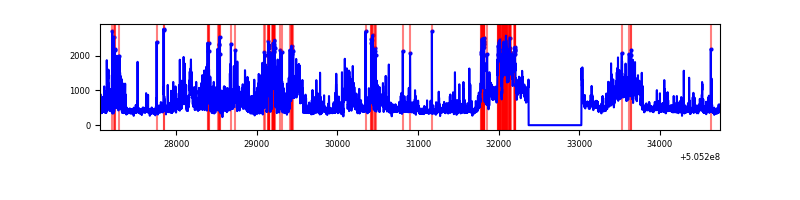 |
Top three noisy pixels from each quadrant. If the there are fewer than three noisy pixels in the level2.evt file, extra rows are filled as -1
| Pixel properties | Quadrant properties | ||||||
|---|---|---|---|---|---|---|---|
| Quadrant | DetID | PixID | Counts | Sigma | Mean | Median | Sigma |
| A | 4 | 159 | 301109 | 1676.42 | 727 | 708 | 179.2 |
| A | 0 | 8 | 108401 | 600.99 | 727 | 708 | 179.2 |
| A | 4 | 3 | 56510 | 311.41 | 727 | 708 | 179.2 |
| B | 5 | 172 | 198785 | 1294.03 | 712 | 684 | 153.1 |
| B | 10 | 247 | 87617 | 567.86 | 712 | 684 | 153.1 |
| B | 4 | 169 | 47108 | 303.25 | 712 | 684 | 153.1 |
| C | 9 | 38 | 6255188 | 33858.04 | 672 | 665 | 184.7 |
| C | 6 | 223 | 53345 | 285.18 | 672 | 665 | 184.7 |
| C | 12 | 2 | 43205 | 230.28 | 672 | 665 | 184.7 |
| D | 11 | 129 | 1190857 | 6004.34 | 701 | 670 | 198.2 |
| D | 8 | 128 | 515418 | 2596.84 | 701 | 670 | 198.2 |
| D | 8 | 245 | 136176 | 683.61 | 701 | 670 | 198.2 |
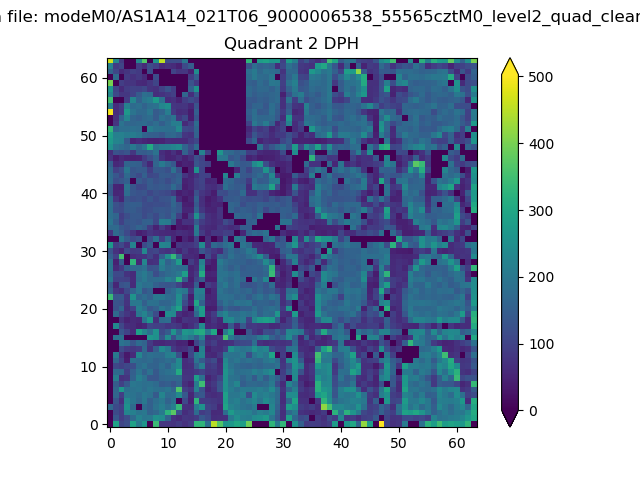
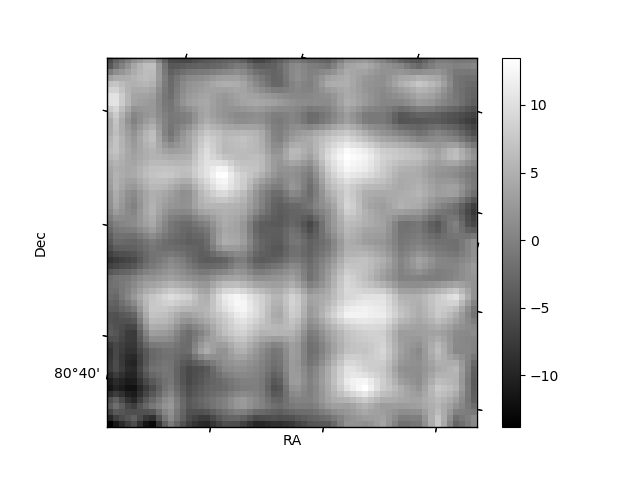
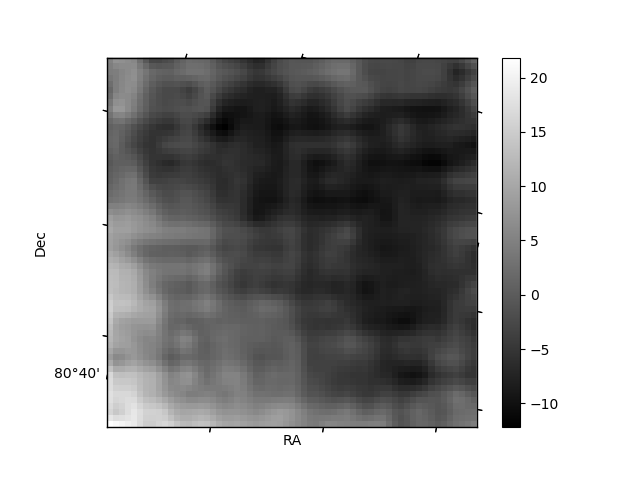
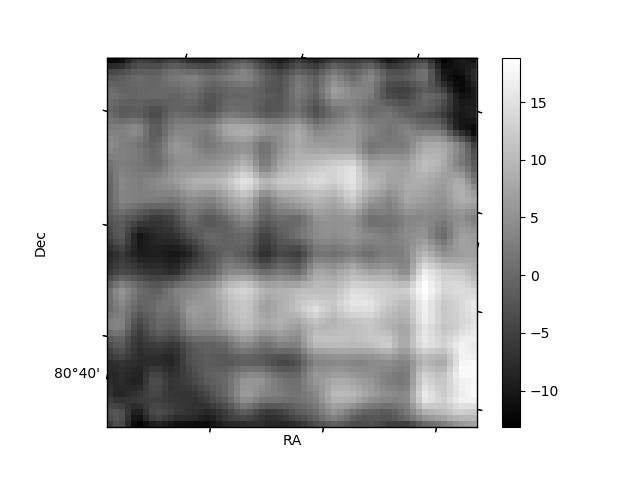
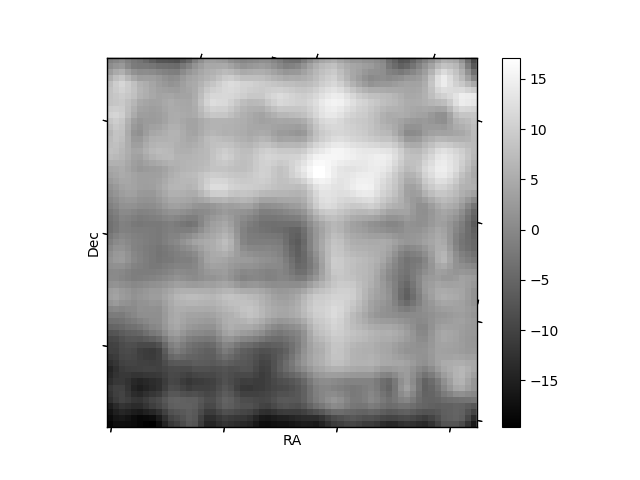
Histogram calculated using DETX and DETY for each event in the final _common_clean file
| Quadrant A | 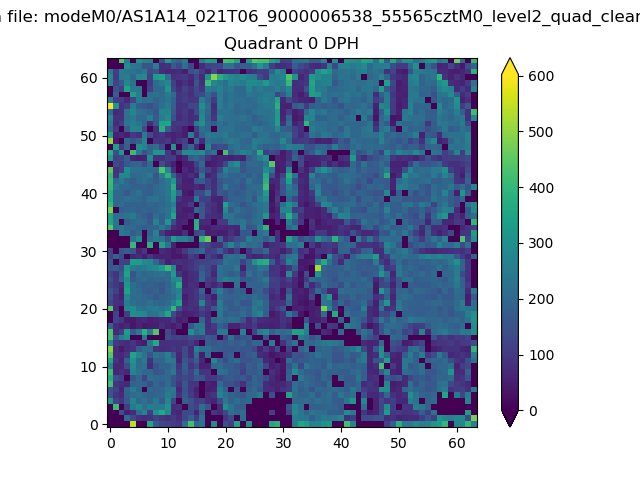 |
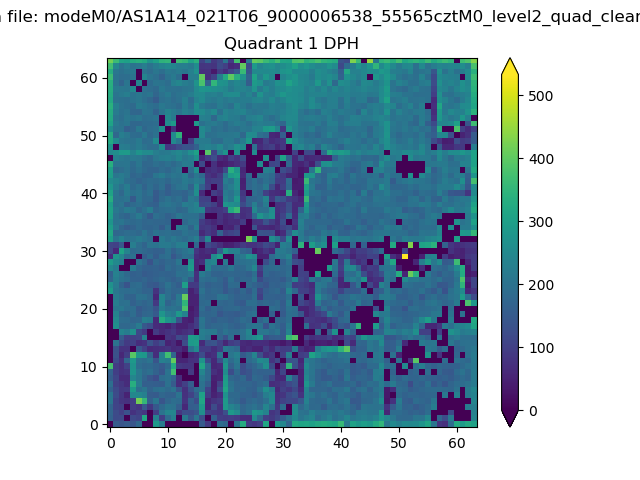 |
Quadrant B |
|---|---|---|---|
| Quadrant D | 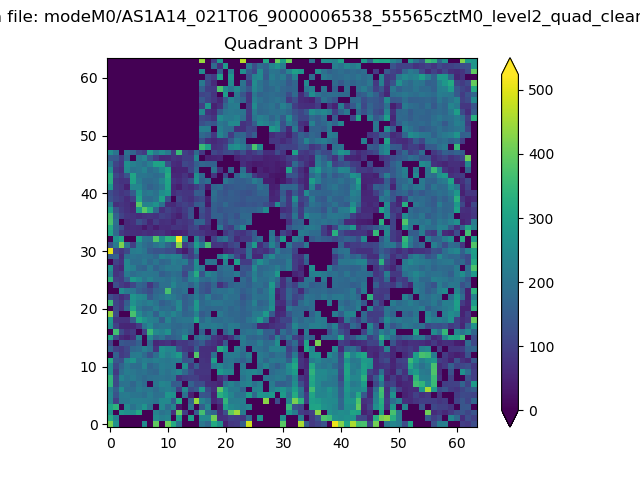 |
 |
Quadrant C |
| Plot type | Count rate plots | Images |
|---|---|---|
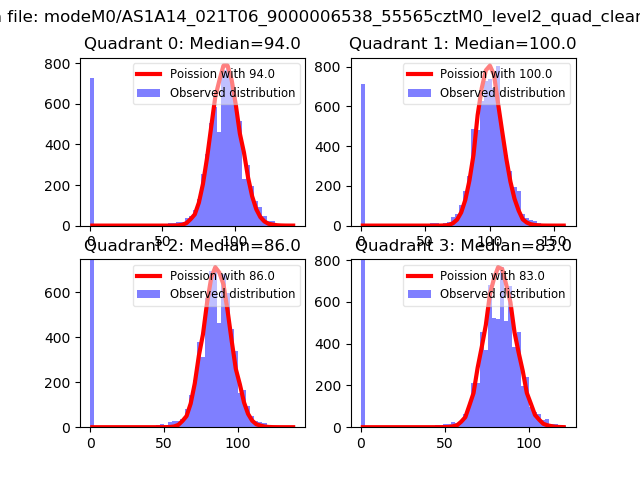
| Comparison with Poisson distribution Blue bars denote a histogram of data divided into 1 sec bins. Red curve is a Poisson curve with rate = median count rate of data. |
 |
 |
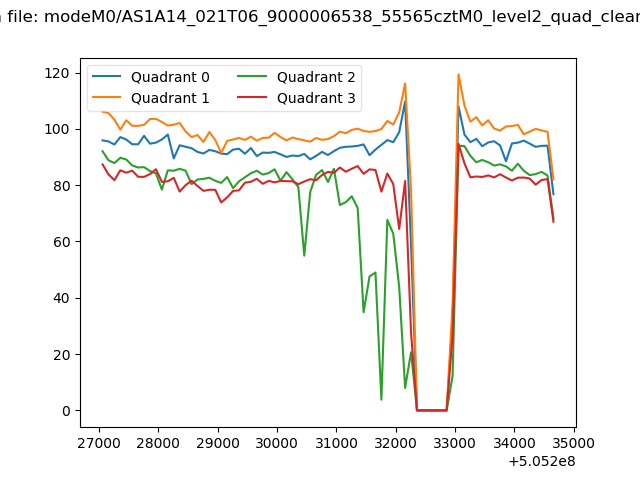
| Quadrant-wise count rates Data is divided into 100 sec bins |
 |
|
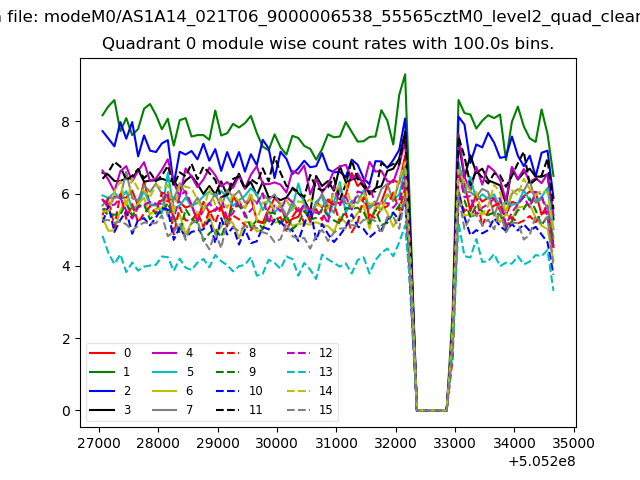
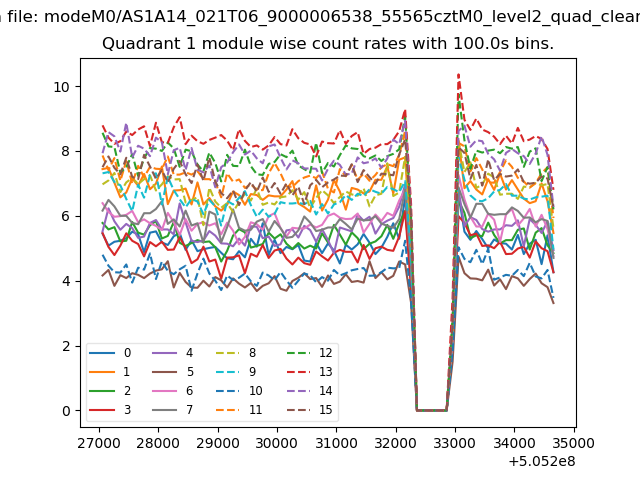
| Module-wise count rates for Quadrant A Data is divided into 100 sec bins |
 |
 |
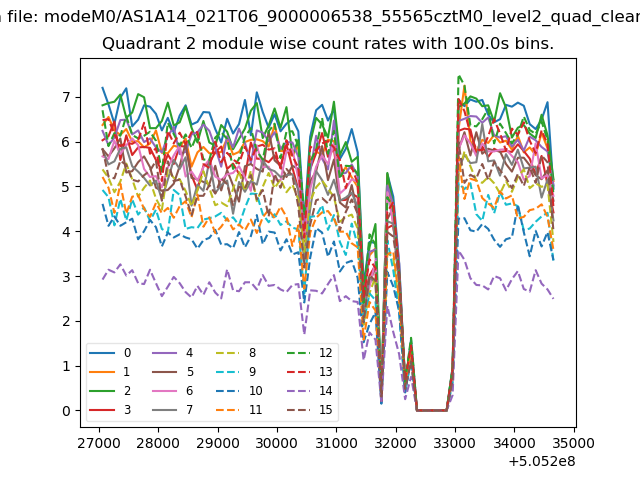
| Module-wise count rates for Quadrant B Data is divided into 100 sec bins |
 |
 |
| Module-wise count rates for Quadrant C Data is divided into 100 sec bins |
 |
 |
| Module-wise count rates for Quadrant D Data is divided into 100 sec bins |
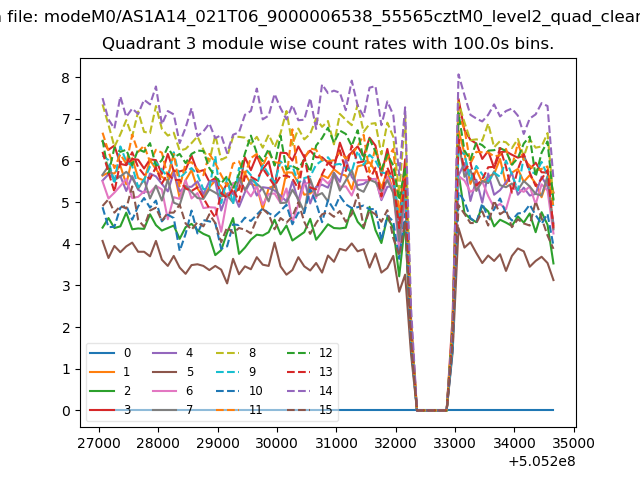 |
 |
| Parameter | Plot |
|---|---|
| CZT HV Monitor | 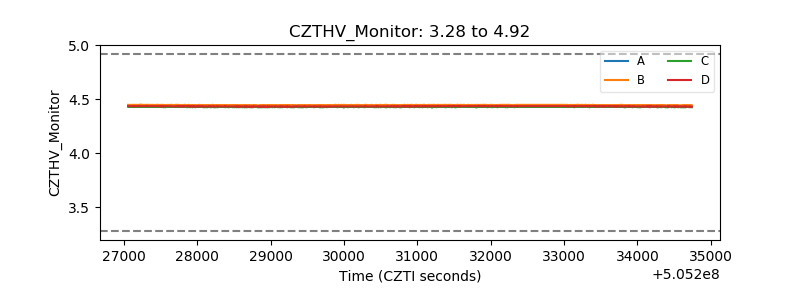 |
| D_VDD | 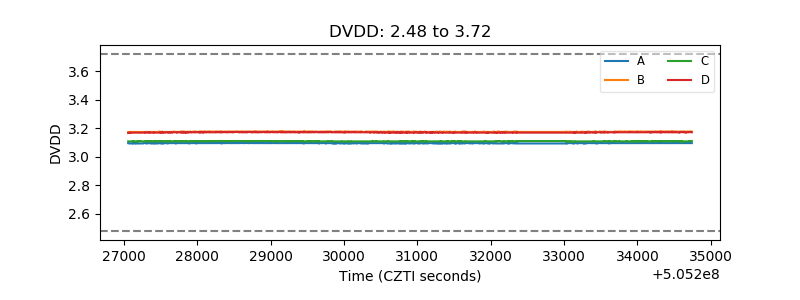 |
| Temperature 1 | 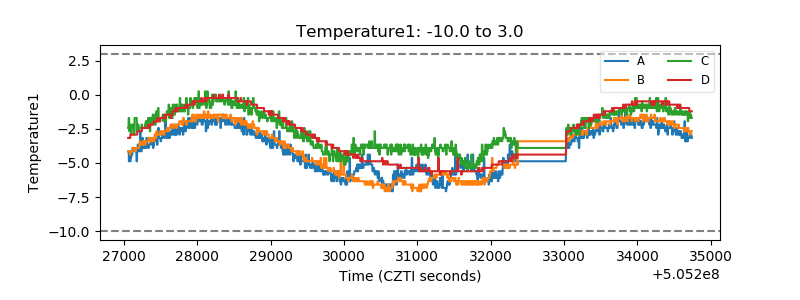 |
| Veto HV Monitor | 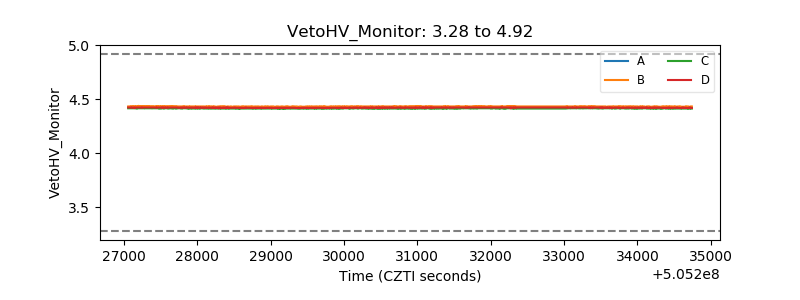 |
| Veto LLD | 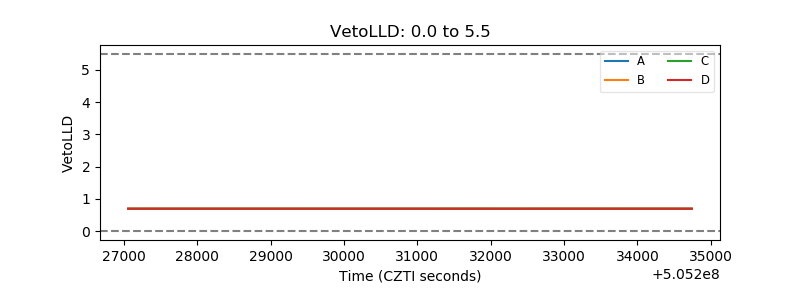 |
| Alpha Counter | 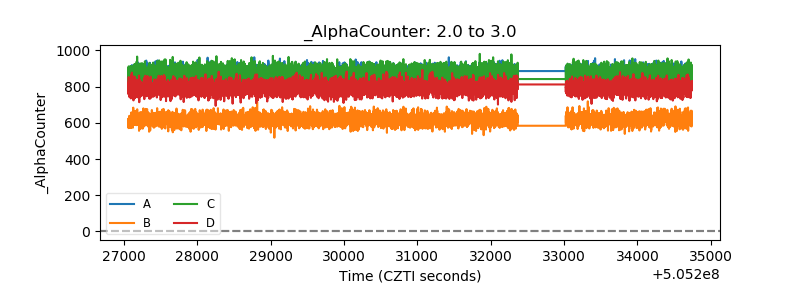 |
| _CPM_Rate | 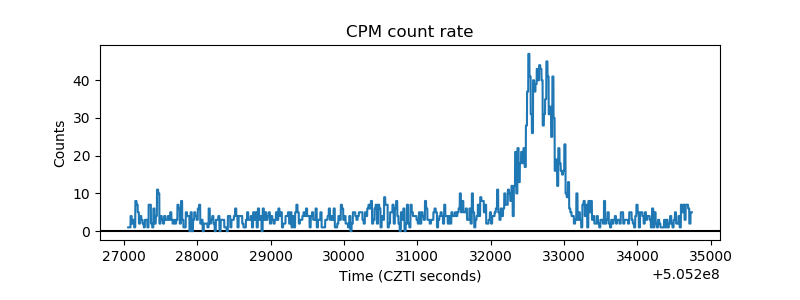 |
| CZT Counter | 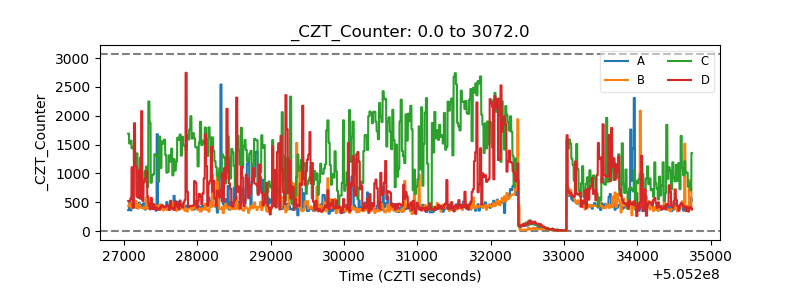 |
| +2.5 Volts monitor | 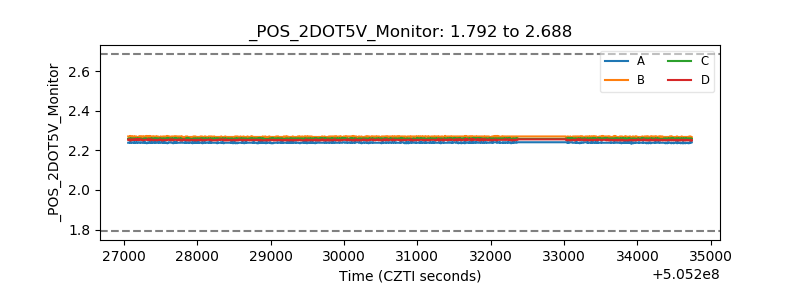 |
| +5 Volts monitor | 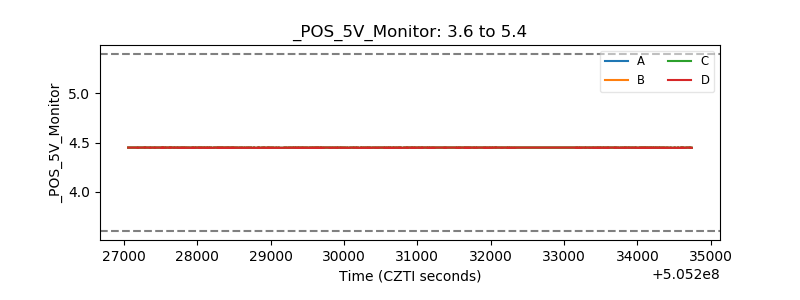 |
| _ROLL_ROT | 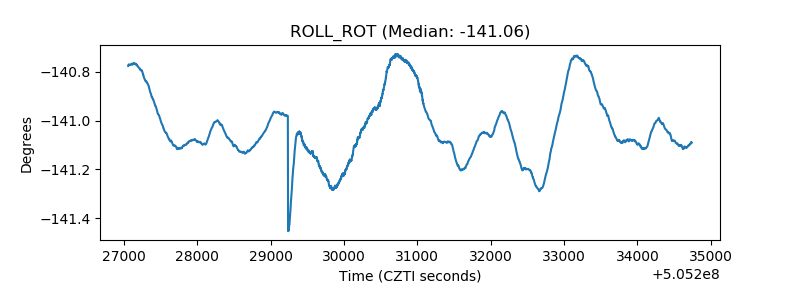 |
| _Roll_DEC | 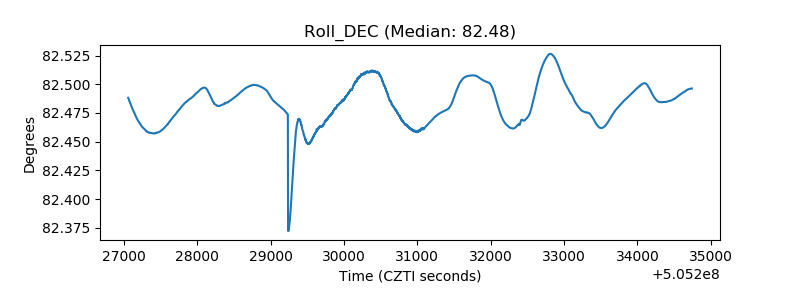 |
| _Roll_RA | 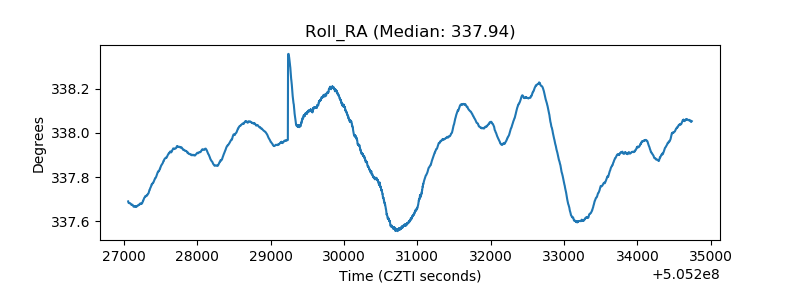 |
| Veto Counter | 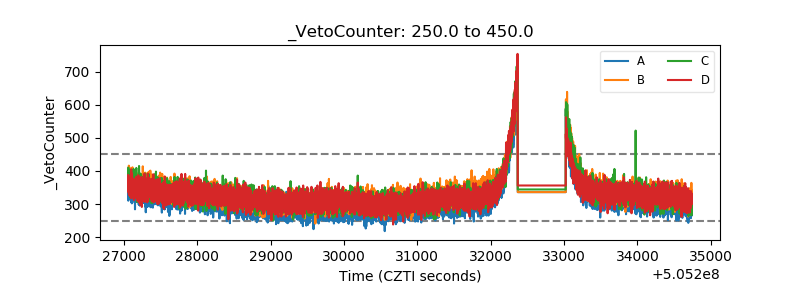 |