| Param | Original file | Final file |
|---|---|---|
| Filename | modeM0/AS1A14_021T06_9000006538_55566cztM0_level2.fits | modeM0/AS1A14_021T06_9000006538_55566cztM0_level2_quad_clean.evt |
| Size (bytes) | 616,224,960 | 106,542,720 |
| Size | 587.7 MB | 101.6 MB |
| Events in quadrant A | 3,671,193 | 732,700 |
| Events in quadrant B | 3,623,609 | 784,277 |
| Events in quadrant C | 9,929,395 | 528,682 |
| Events in quadrant D | 4,980,540 | 637,566 |
| Mode M0 | |||
|---|---|---|---|
| Quadrant | BADHDUFLAG | Total packets | Discarded packets |
| A | 0 | 16880 | 0 |
| B | 0 | 16815 | 0 |
| C | 0 | 35004 | 0 |
| D | 0 | 20468 | 0 |
| Mode SS | |||
|---|---|---|---|
| Quadrant | BADHDUFLAG | Total packets | Discarded packets |
| A | 0 | 156 | 0 |
| B | 0 | 156 | 0 |
| C | 0 | 156 | 0 |
| D | 0 | 156 | 0 |
| Quadrant | Total seconds | Saturated seconds | Saturation percentage |
|---|---|---|---|
| A | 7804 | 51 | 0.653511% |
| B | 7804 | 105 | 1.345464% |
| C | 7804 | 1939 | 24.846233% |
| D | 7804 | 306 | 3.921066% |
Noise dominated data is calculated using 1-second bins in cleaned event files. If a bin has >2000 counts, and if more than 50% of those come from <1% of pixels, then it is considered to be noise-dominated and hence unusable.
| Quadrant | # 1 sec bins | Bins with >0 counts | Bins with >2000 counts | High rate bins dominated by noise | Noise dominated (total time) | Noise dominated (detector-on time) | Marked lightcurve |
|---|---|---|---|---|---|---|---|
| A | 7804 | 7804 | 22 | 22 | 0.28% | 0.28% | 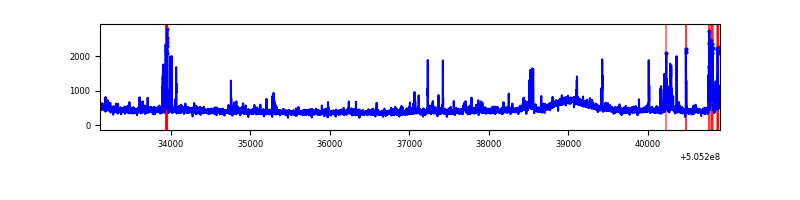 |
| B | 7803 | 7803 | 27 | 27 | 0.35% | 0.35% | 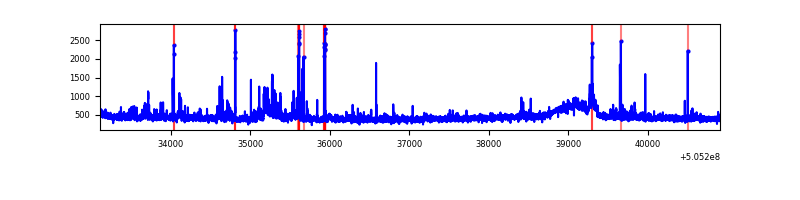 |
| C | 7804 | 7804 | 1883 | 1883 | 24.13% | 24.13% | 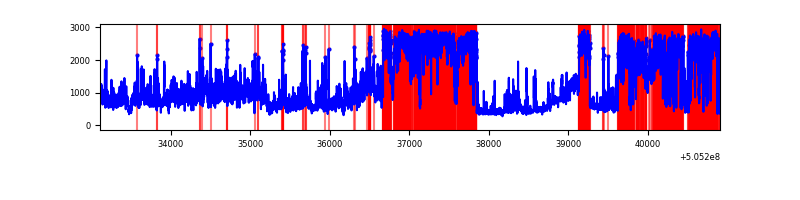 |
| D | 7803 | 7803 | 250 | 250 | 3.20% | 3.20% | 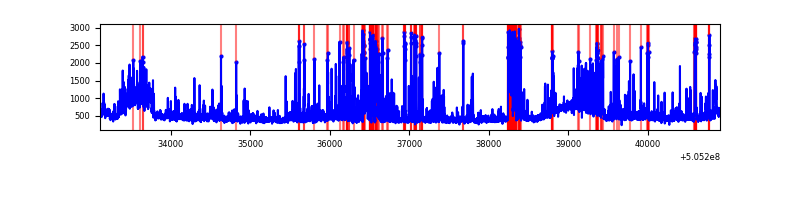 |
Top three noisy pixels from each quadrant. If the there are fewer than three noisy pixels in the level2.evt file, extra rows are filled as -1
| Pixel properties | Quadrant properties | ||||||
|---|---|---|---|---|---|---|---|
| Quadrant | DetID | PixID | Counts | Sigma | Mean | Median | Sigma |
| A | 0 | 8 | 179277 | 881.64 | 825 | 804 | 202.4 |
| A | 8 | 9 | 76583 | 374.34 | 825 | 804 | 202.4 |
| A | 15 | 32 | 73775 | 360.47 | 825 | 804 | 202.4 |
| B | 5 | 172 | 157708 | 900.66 | 812 | 779 | 174.2 |
| B | 4 | 169 | 104860 | 597.35 | 812 | 779 | 174.2 |
| B | 7 | 252 | 50032 | 282.68 | 812 | 779 | 174.2 |
| C | 9 | 38 | 3433440 | 17680.48 | 719 | 709 | 194.2 |
| C | 13 | 3 | 3389633 | 17454.85 | 719 | 709 | 194.2 |
| C | 3 | 242 | 74002 | 377.5 | 719 | 709 | 194.2 |
| D | 2 | 120 | 760088 | 3408.1 | 796 | 760 | 222.8 |
| D | 8 | 245 | 443952 | 1989.18 | 796 | 760 | 222.8 |
| D | 11 | 129 | 316946 | 1419.14 | 796 | 760 | 222.8 |
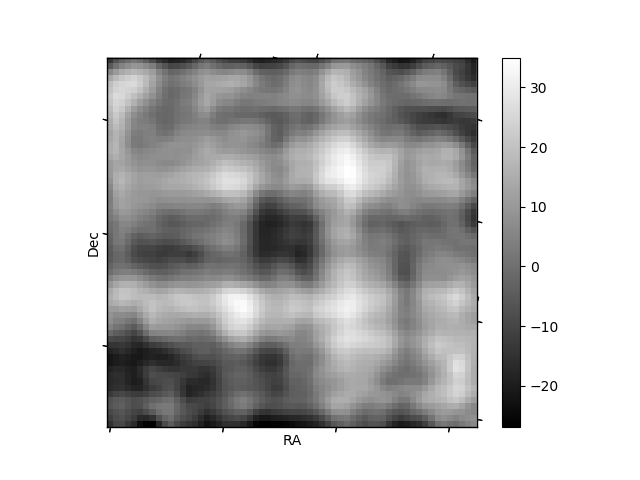
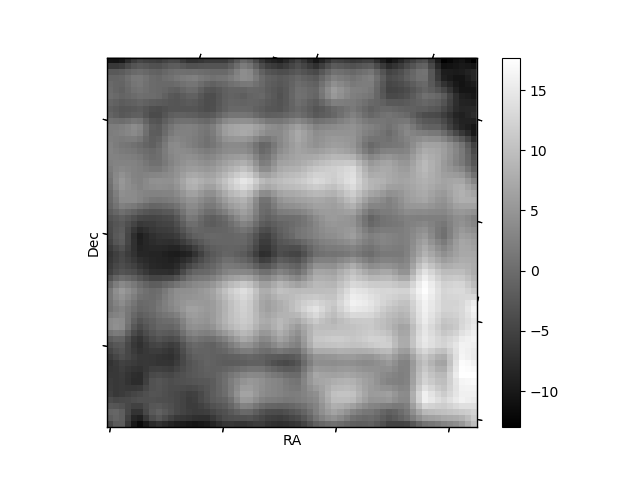
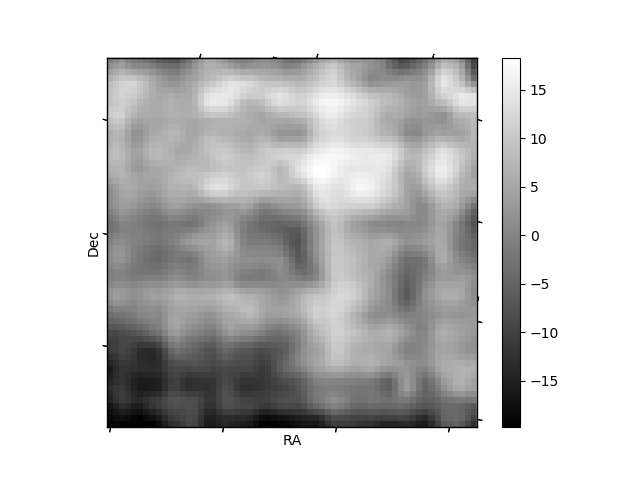
Histogram calculated using DETX and DETY for each event in the final _common_clean file
| Quadrant A | 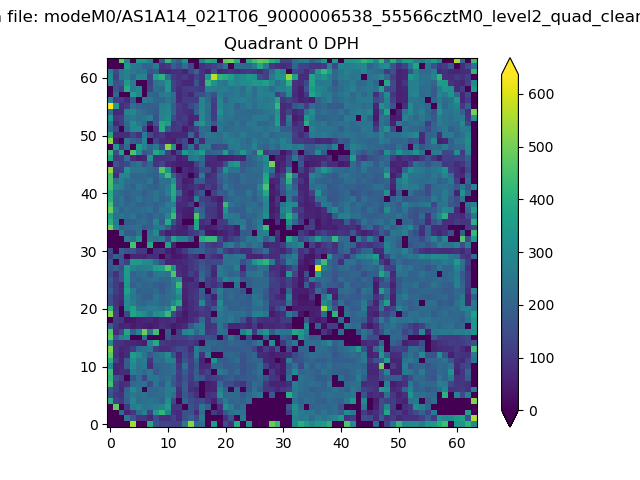 |
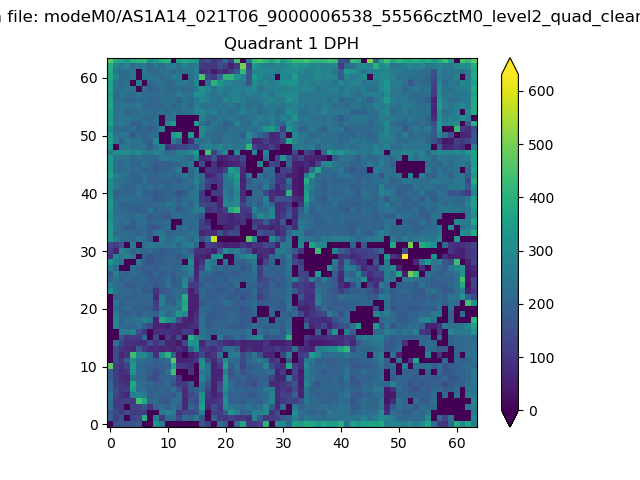 |
Quadrant B |
|---|---|---|---|
| Quadrant D | 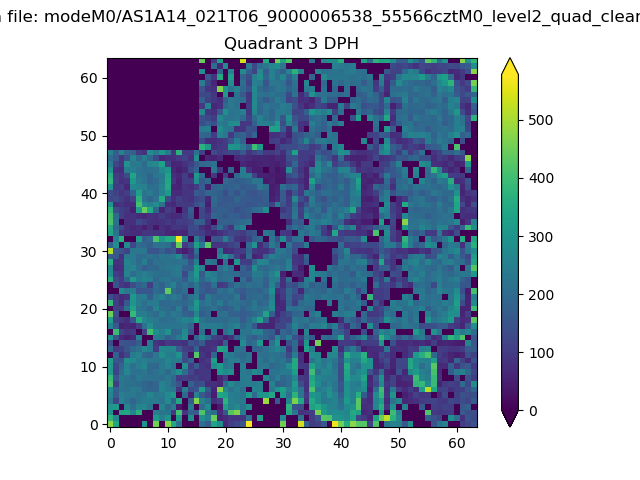 |
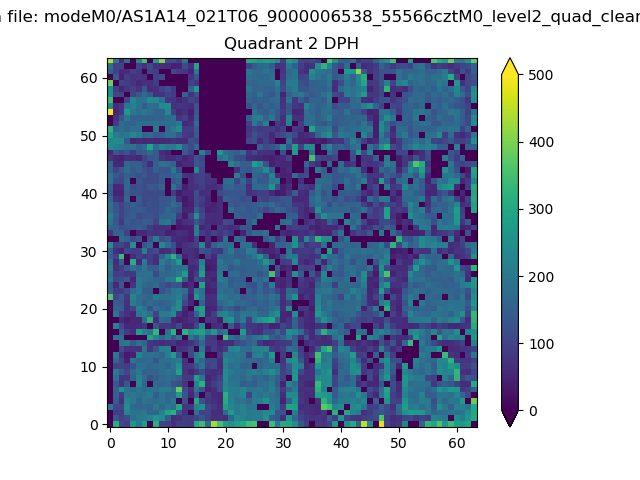 |
Quadrant C |
| Plot type | Count rate plots | Images |
|---|---|---|
| Comparison with Poisson distribution Blue bars denote a histogram of data divided into 1 sec bins. Red curve is a Poisson curve with rate = median count rate of data. |
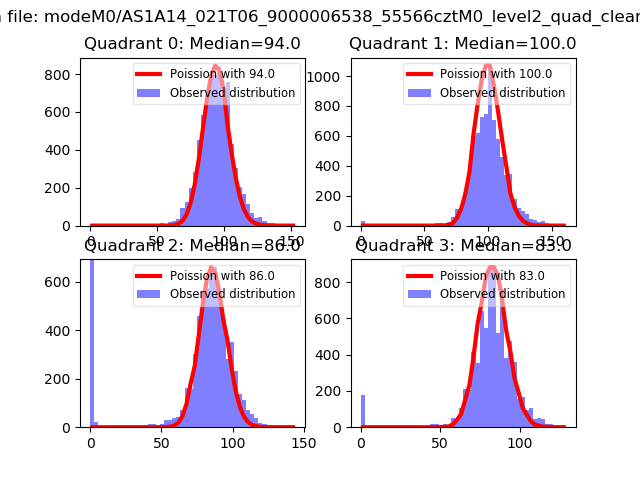 |
 |
| Quadrant-wise count rates Data is divided into 100 sec bins |
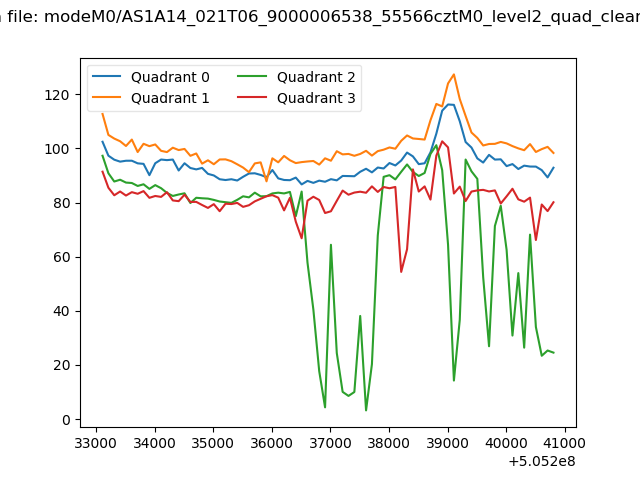 |
|
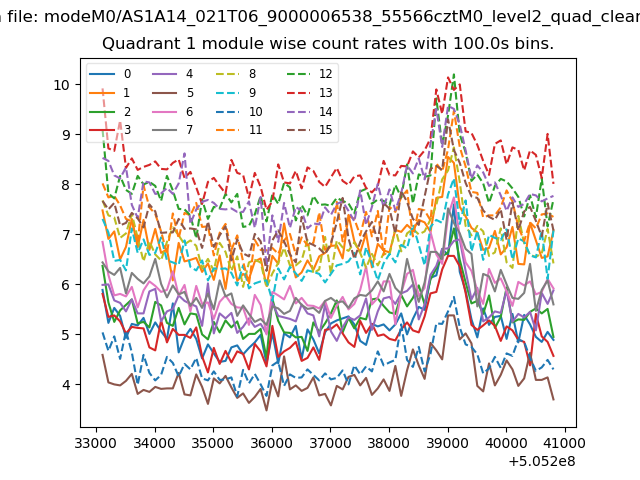
| Module-wise count rates for Quadrant A Data is divided into 100 sec bins |
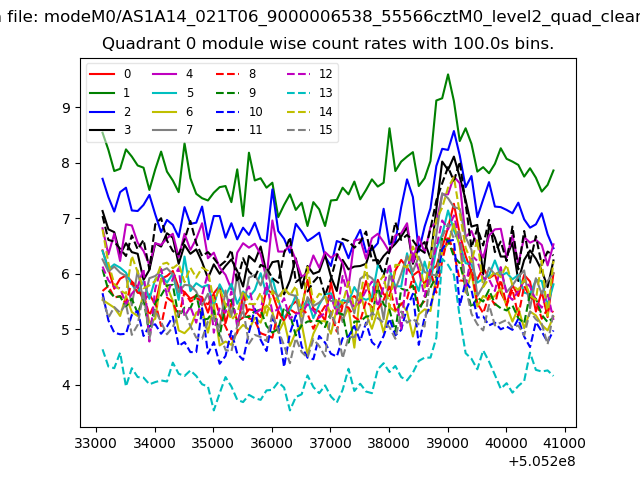 |
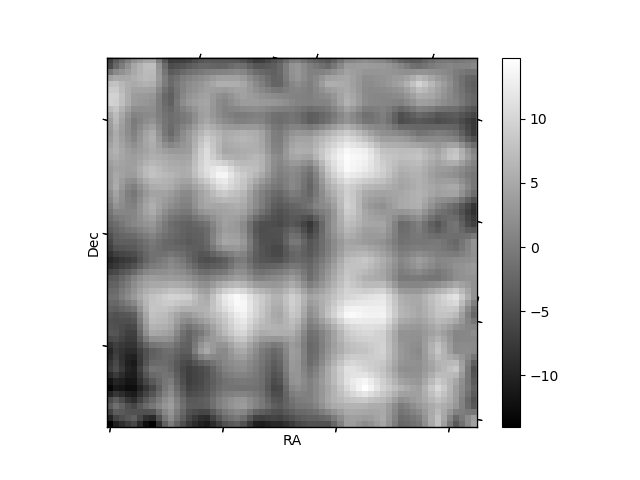 |
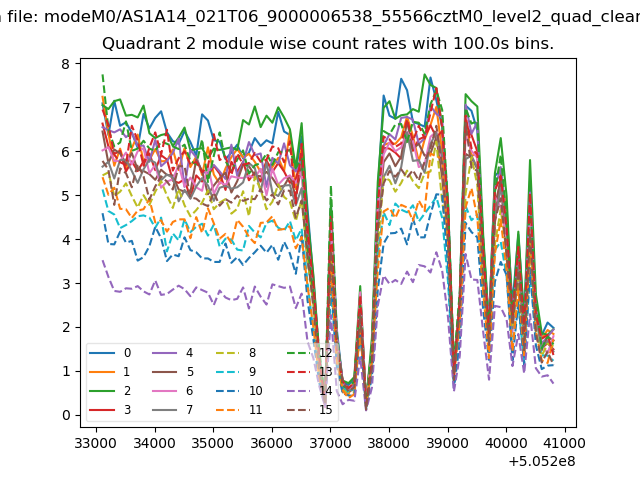
| Module-wise count rates for Quadrant B Data is divided into 100 sec bins |
 |
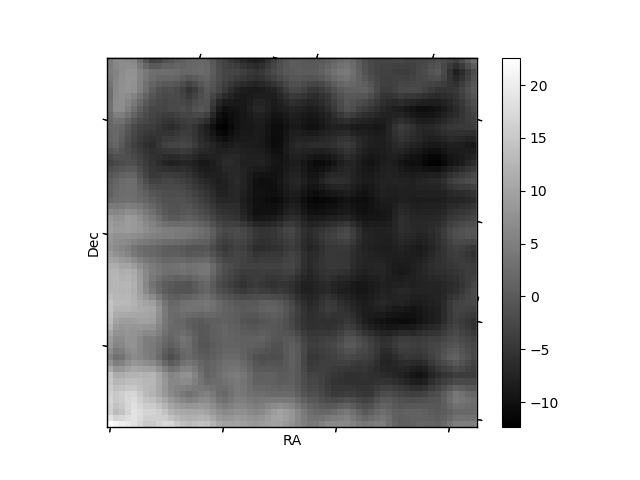 |
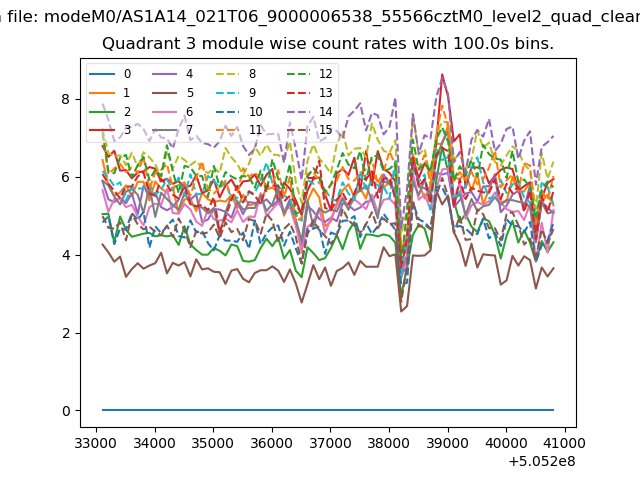
| Module-wise count rates for Quadrant C Data is divided into 100 sec bins |
 |
 |
| Module-wise count rates for Quadrant D Data is divided into 100 sec bins |
 |
 |
| Parameter | Plot |
|---|---|
| CZT HV Monitor | 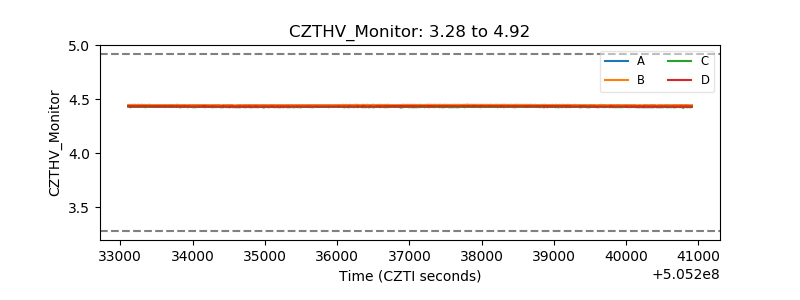 |
| D_VDD | 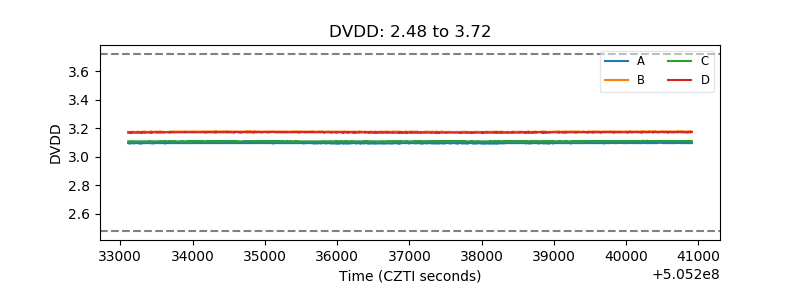 |
| Temperature 1 | 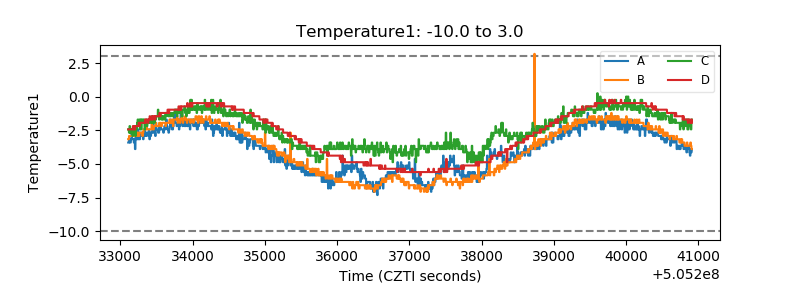 |
| Veto HV Monitor | 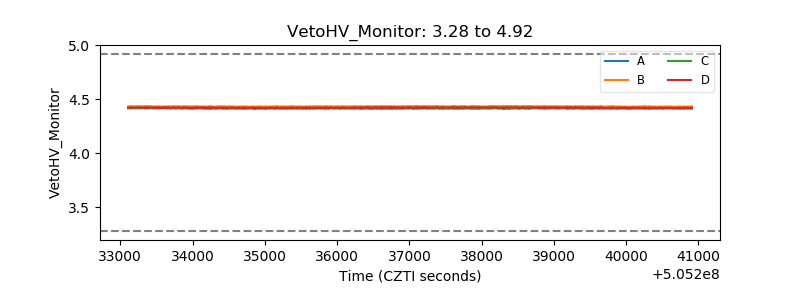 |
| Veto LLD | 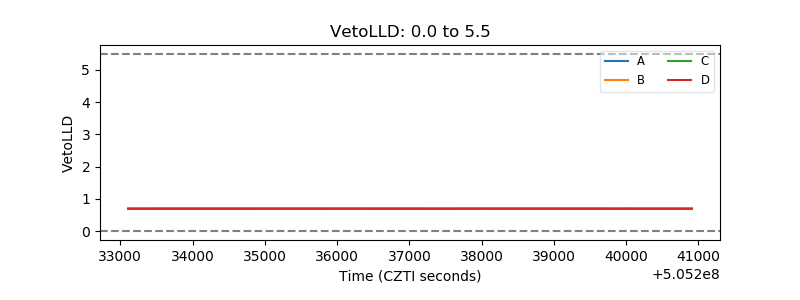 |
| Alpha Counter | 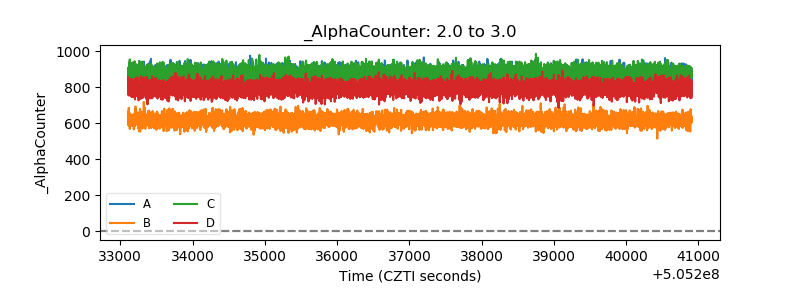 |
| _CPM_Rate | 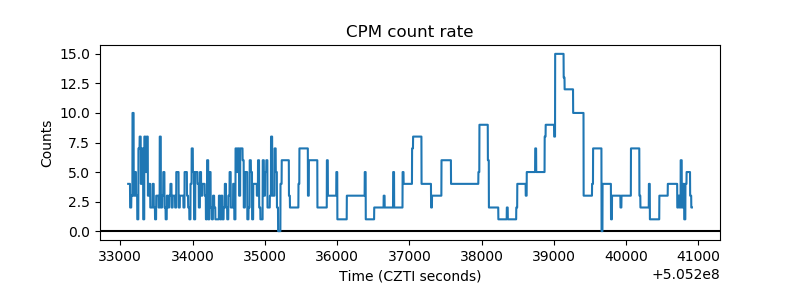 |
| CZT Counter | 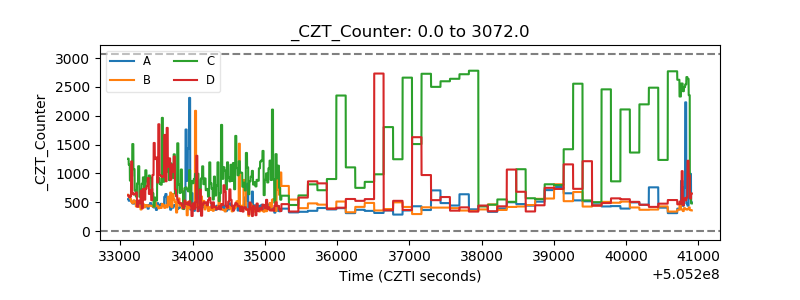 |
| +2.5 Volts monitor |  |
| +5 Volts monitor | 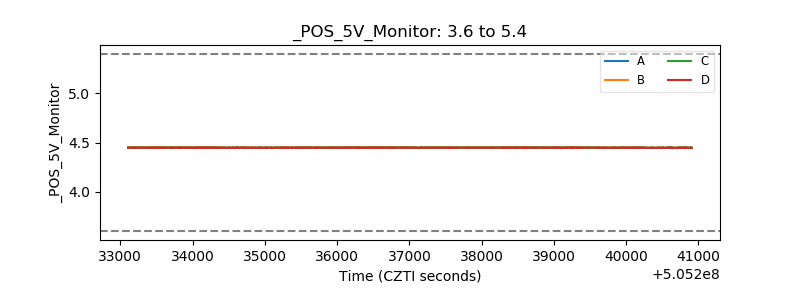 |
| _ROLL_ROT | 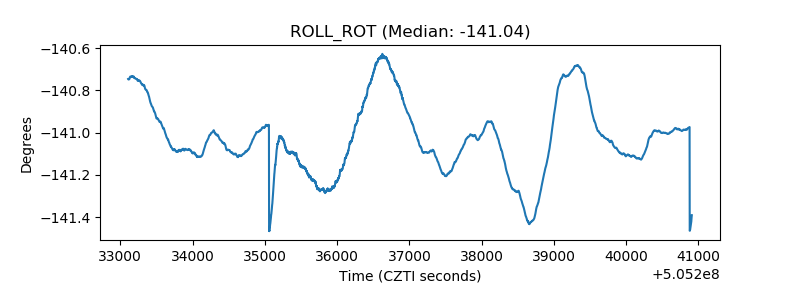 |
| _Roll_DEC | 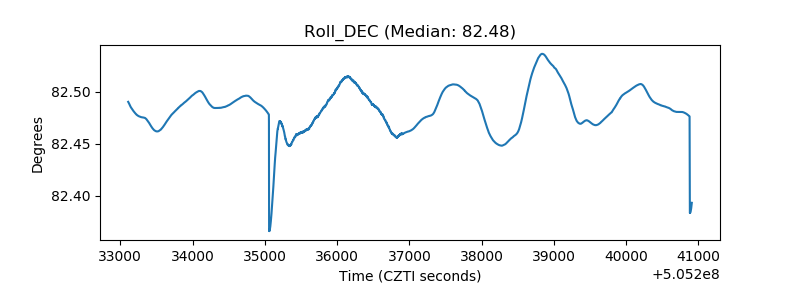 |
| _Roll_RA | 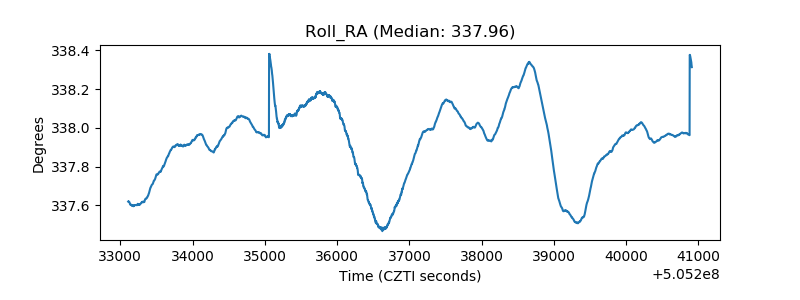 |
| Veto Counter | 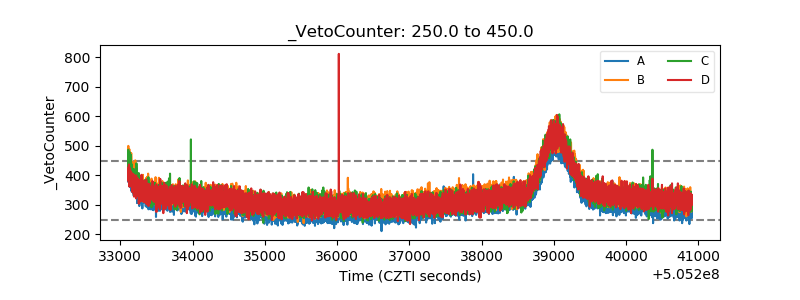 |