| Param | Original file | Final file |
|---|---|---|
| Filename | modeM0/AS1A14_021T06_9000006538_55567cztM0_level2.fits | modeM0/AS1A14_021T06_9000006538_55567cztM0_level2_quad_clean.evt |
| Size (bytes) | 641,456,640 | 94,340,160 |
| Size | 611.7 MB | 90.0 MB |
| Events in quadrant A | 4,550,468 | 637,448 |
| Events in quadrant B | 3,122,173 | 710,157 |
| Events in quadrant C | 11,163,612 | 430,040 |
| Events in quadrant D | 4,353,228 | 580,679 |
| Mode M0 | |||
|---|---|---|---|
| Quadrant | BADHDUFLAG | Total packets | Discarded packets |
| A | 0 | 18738 | 0 |
| B | 0 | 14908 | 0 |
| C | 0 | 38130 | 0 |
| D | 0 | 18199 | 0 |
| Mode SS | |||
|---|---|---|---|
| Quadrant | BADHDUFLAG | Total packets | Discarded packets |
| A | 0 | 142 | 0 |
| B | 0 | 142 | 0 |
| C | 0 | 142 | 0 |
| D | 0 | 142 | 0 |
| Quadrant | Total seconds | Saturated seconds | Saturation percentage |
|---|---|---|---|
| A | 7153 | 331 | 4.627429% |
| B | 7154 | 22 | 0.307520% |
| C | 7154 | 2575 | 35.993850% |
| D | 7154 | 225 | 3.145094% |
Noise dominated data is calculated using 1-second bins in cleaned event files. If a bin has >2000 counts, and if more than 50% of those come from <1% of pixels, then it is considered to be noise-dominated and hence unusable.
| Quadrant | # 1 sec bins | Bins with >0 counts | Bins with >2000 counts | High rate bins dominated by noise | Noise dominated (total time) | Noise dominated (detector-on time) | Marked lightcurve |
|---|---|---|---|---|---|---|---|
| A | 7153 | 7153 | 340 | 340 | 4.75% | 4.75% | 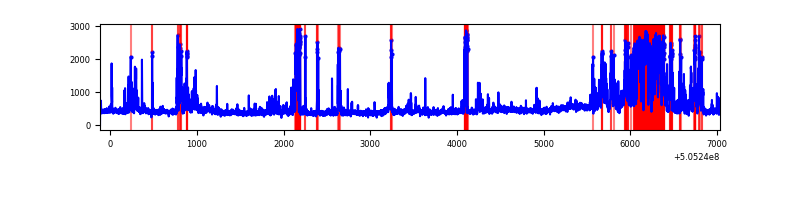 |
| B | 7154 | 7154 | 15 | 15 | 0.21% | 0.21% | 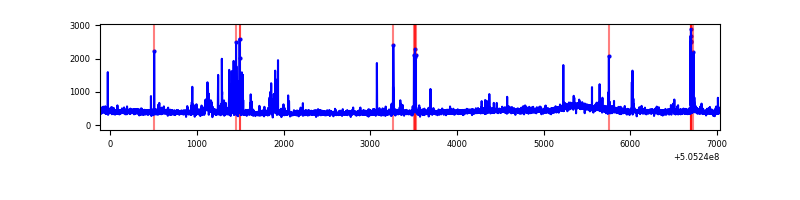 |
| C | 7154 | 7154 | 2736 | 2736 | 38.24% | 38.24% | 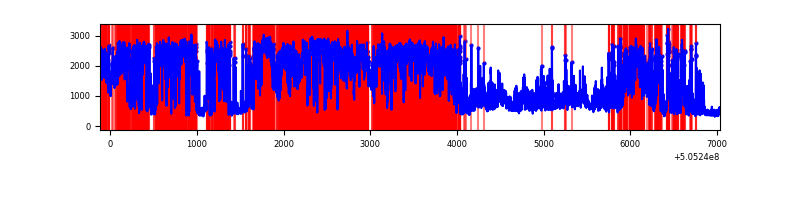 |
| D | 7154 | 7154 | 244 | 244 | 3.41% | 3.41% | 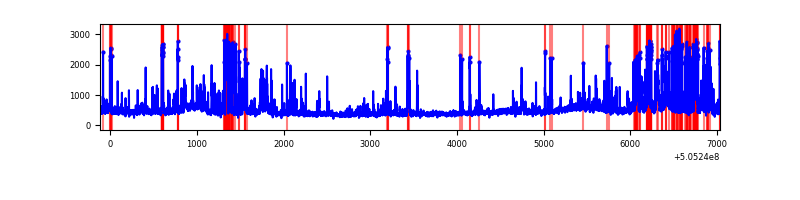 |
Top three noisy pixels from each quadrant. If the there are fewer than three noisy pixels in the level2.evt file, extra rows are filled as -1
| Pixel properties | Quadrant properties | ||||||
|---|---|---|---|---|---|---|---|
| Quadrant | DetID | PixID | Counts | Sigma | Mean | Median | Sigma |
| A | 4 | 159 | 830221 | 4626.4 | 722 | 703 | 179.3 |
| A | 0 | 8 | 503475 | 2804.07 | 722 | 703 | 179.3 |
| A | 8 | 9 | 251365 | 1397.99 | 722 | 703 | 179.3 |
| B | 7 | 252 | 75284 | 480.43 | 725 | 697 | 155.3 |
| B | 4 | 169 | 63431 | 404.08 | 725 | 697 | 155.3 |
| B | 4 | 206 | 41689 | 264.04 | 725 | 697 | 155.3 |
| C | 9 | 38 | 6112412 | 36465.84 | 616 | 613 | 167.6 |
| C | 15 | 148 | 1221147 | 7282.27 | 616 | 613 | 167.6 |
| C | 13 | 3 | 914612 | 5453.34 | 616 | 613 | 167.6 |
| D | 5 | 222 | 323477 | 1625.51 | 704 | 674 | 198.6 |
| D | 8 | 129 | 289591 | 1454.88 | 704 | 674 | 198.6 |
| D | 2 | 120 | 199228 | 999.84 | 704 | 674 | 198.6 |
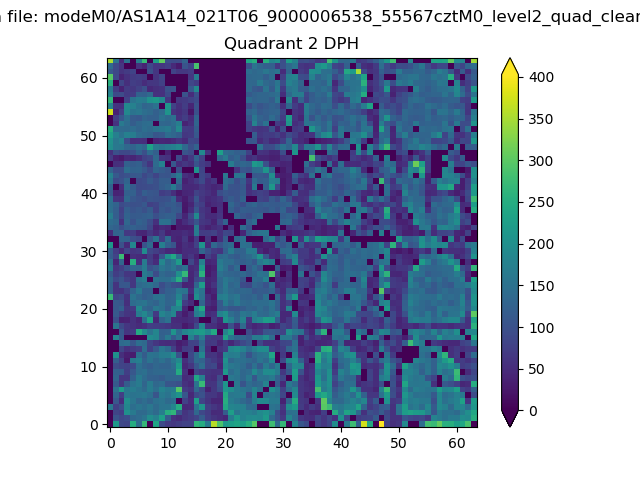
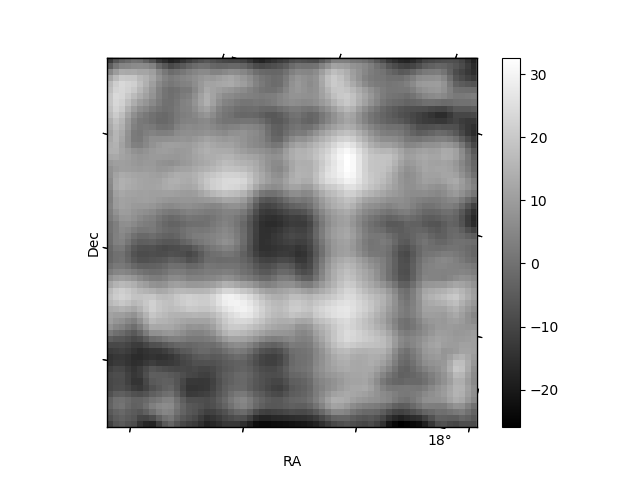
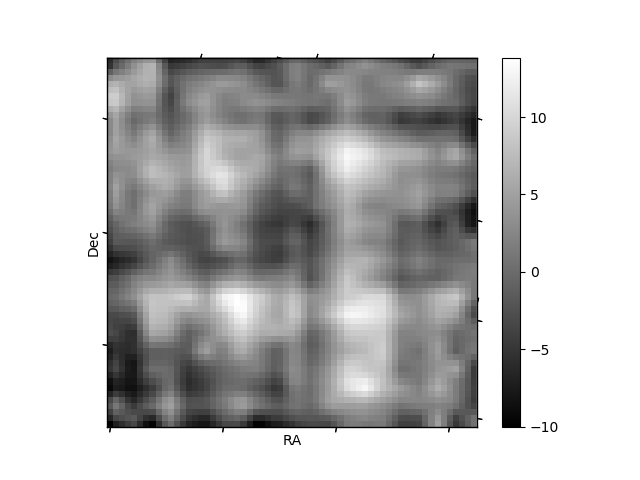
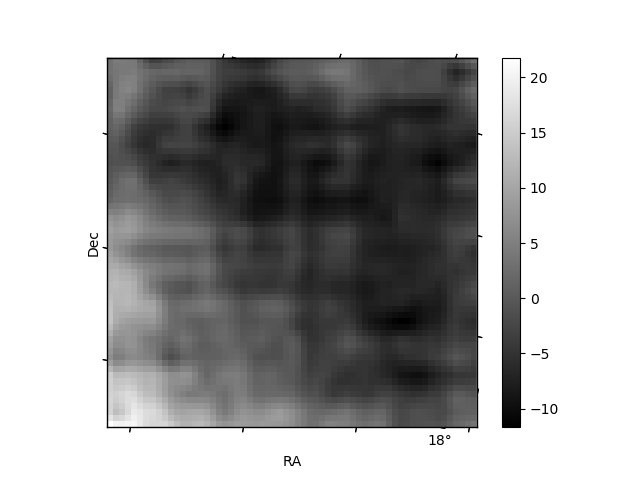
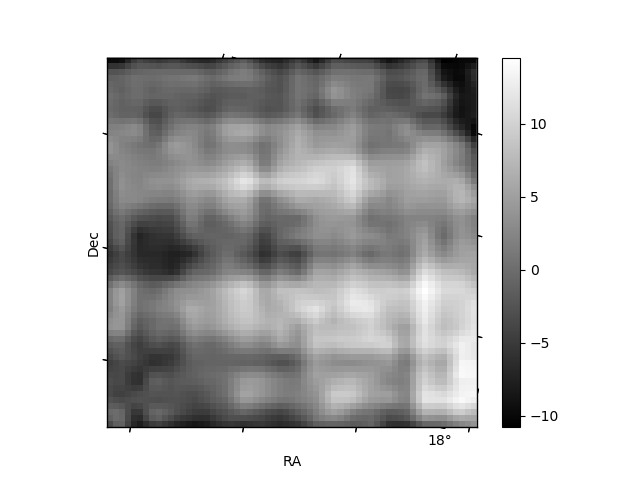
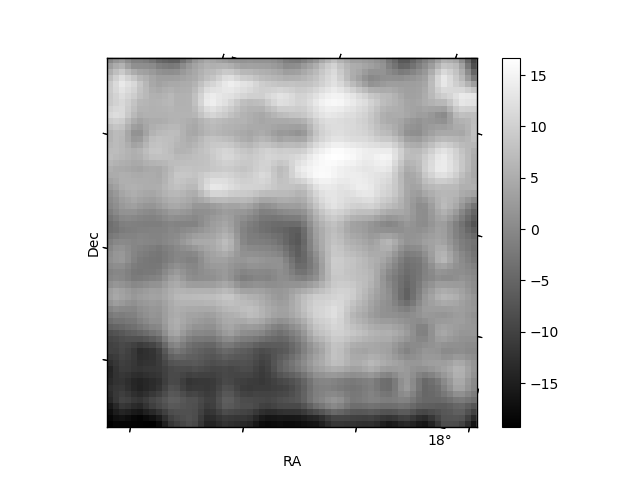
Histogram calculated using DETX and DETY for each event in the final _common_clean file
| Quadrant A | 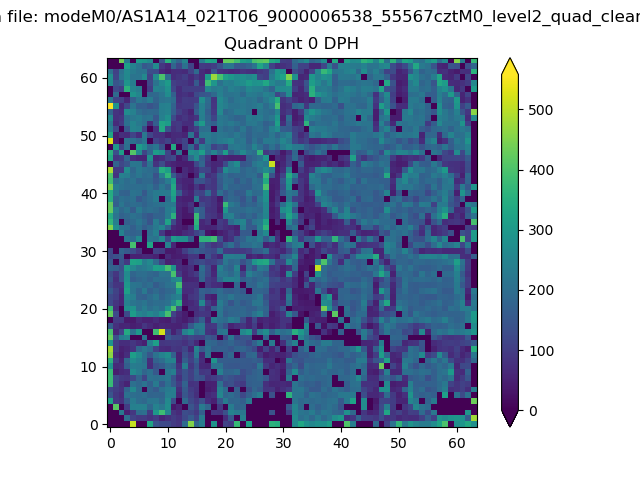 |
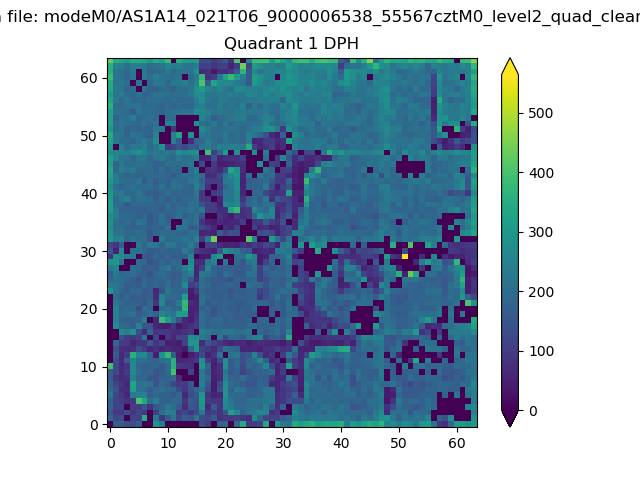 |
Quadrant B |
|---|---|---|---|
| Quadrant D | 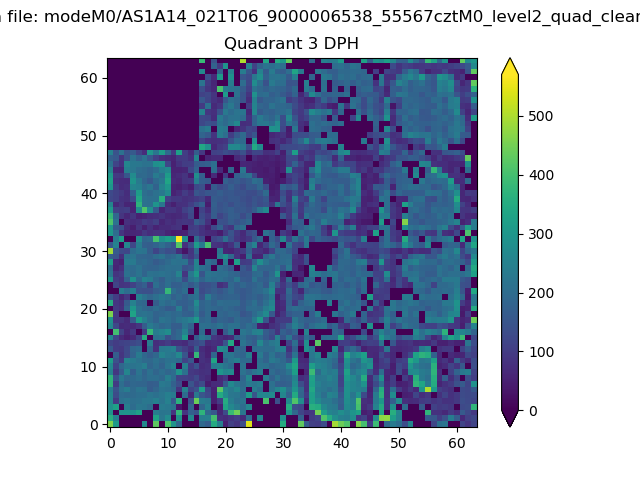 |
 |
Quadrant C |
| Plot type | Count rate plots | Images |
|---|---|---|
| Comparison with Poisson distribution Blue bars denote a histogram of data divided into 1 sec bins. Red curve is a Poisson curve with rate = median count rate of data. |
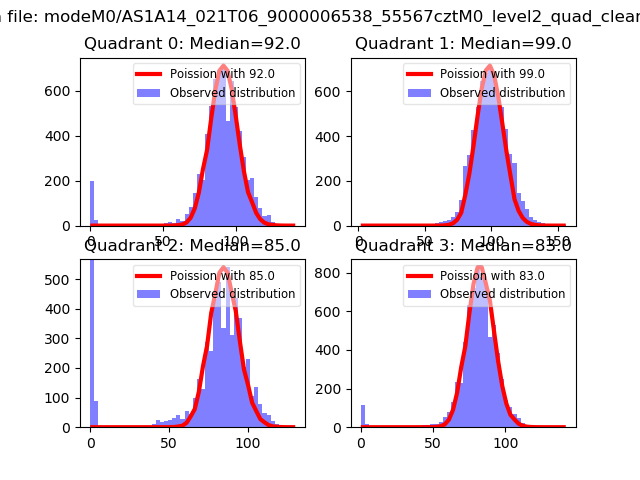 |
 |
| Quadrant-wise count rates Data is divided into 100 sec bins |
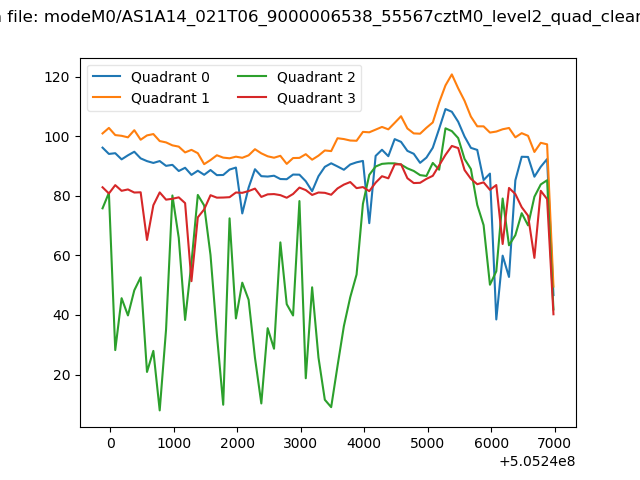 |
|
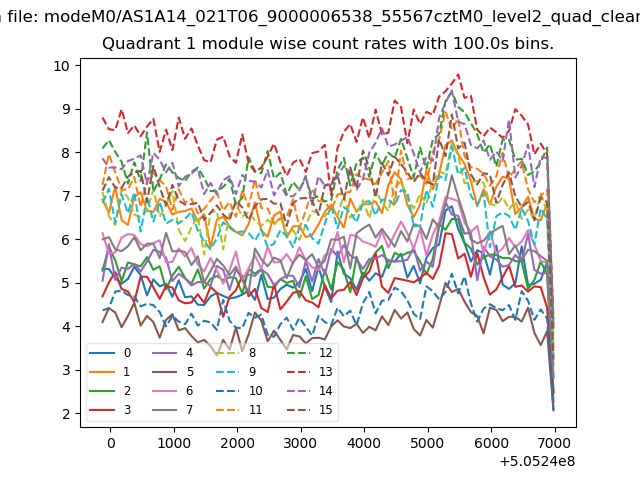
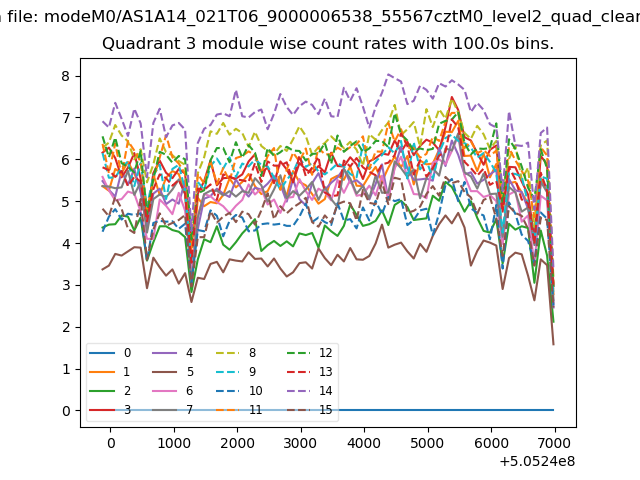
| Module-wise count rates for Quadrant A Data is divided into 100 sec bins |
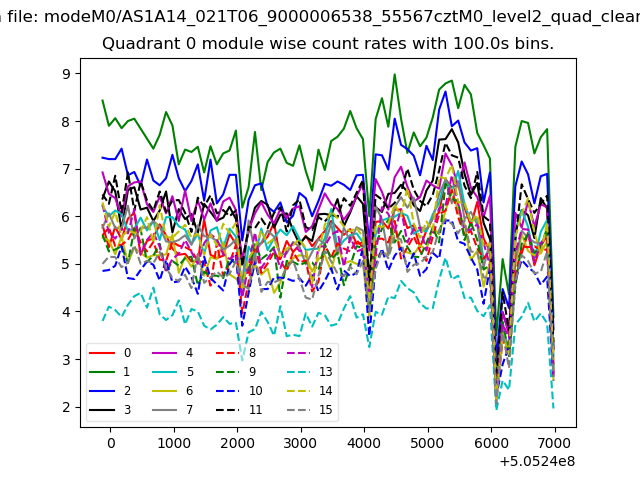 |
 |
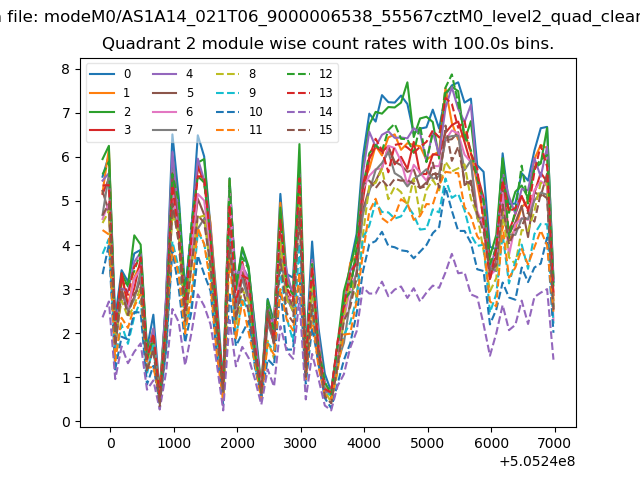
| Module-wise count rates for Quadrant B Data is divided into 100 sec bins |
 |
 |
| Module-wise count rates for Quadrant C Data is divided into 100 sec bins |
 |
 |
| Module-wise count rates for Quadrant D Data is divided into 100 sec bins |
 |
 |
| Parameter | Plot |
|---|---|
| CZT HV Monitor | 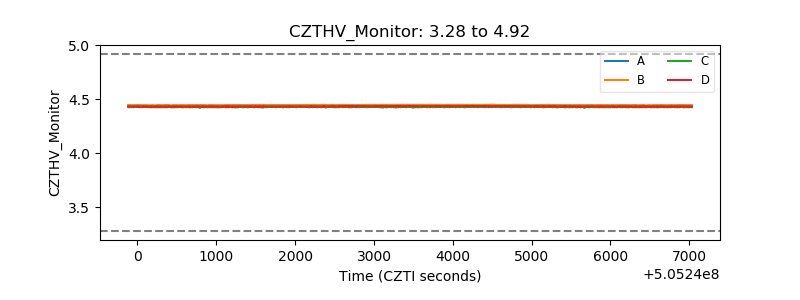 |
| D_VDD | 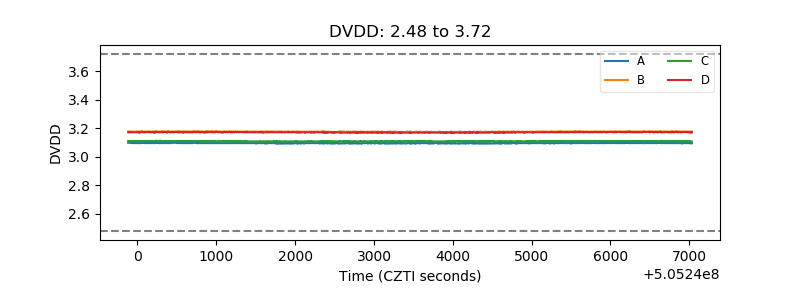 |
| Temperature 1 | 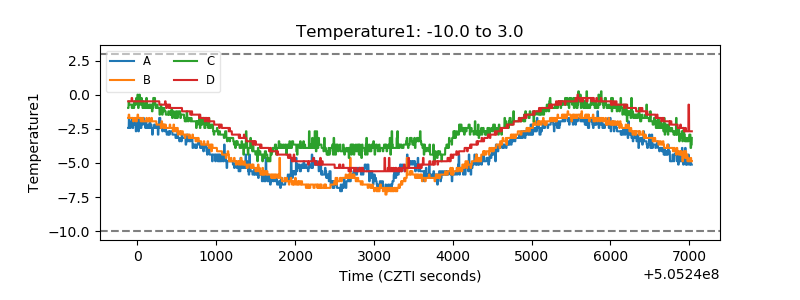 |
| Veto HV Monitor | 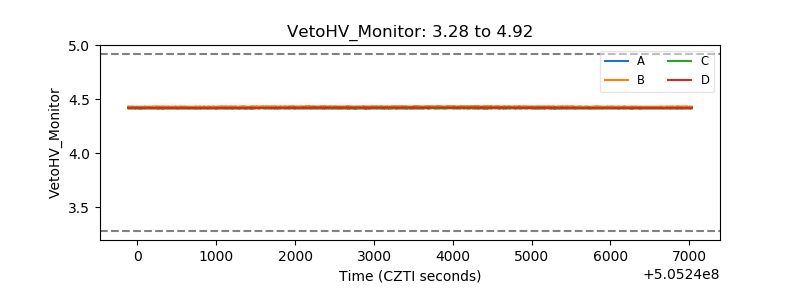 |
| Veto LLD | 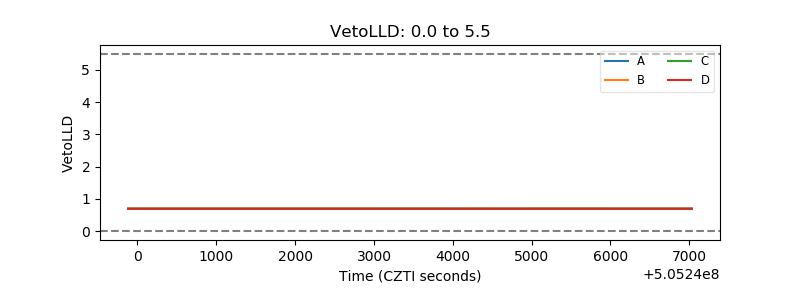 |
| Alpha Counter | 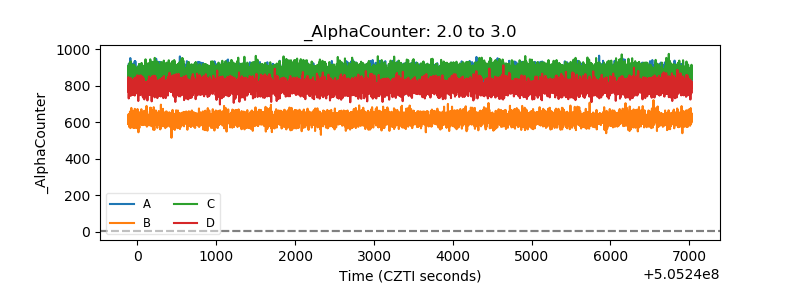 |
| _CPM_Rate | 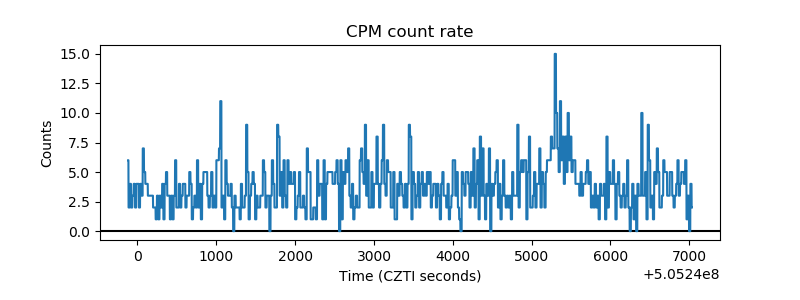 |
| CZT Counter | 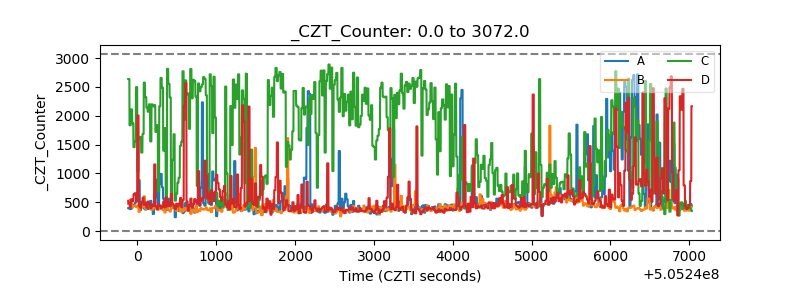 |
| +2.5 Volts monitor | 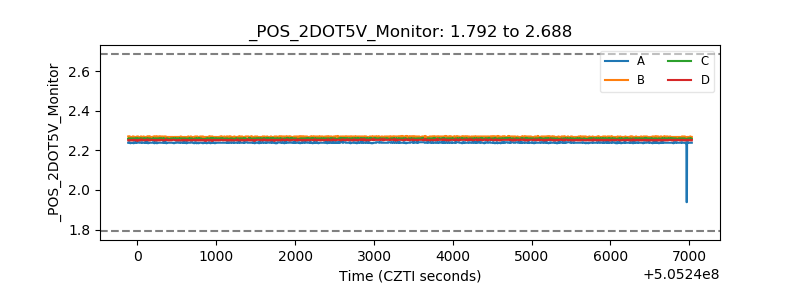 |
| +5 Volts monitor | 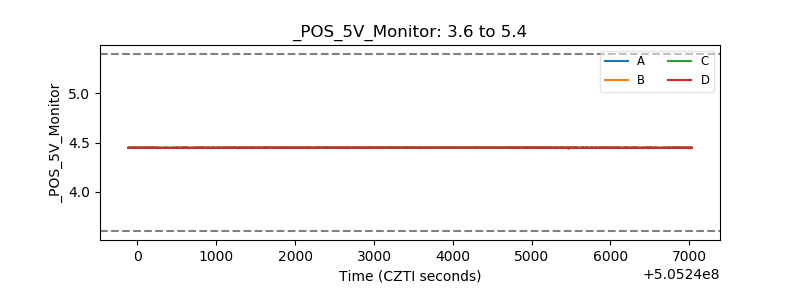 |
| _ROLL_ROT | 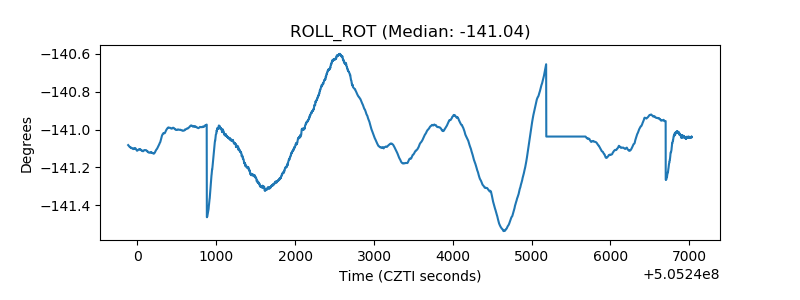 |
| _Roll_DEC | 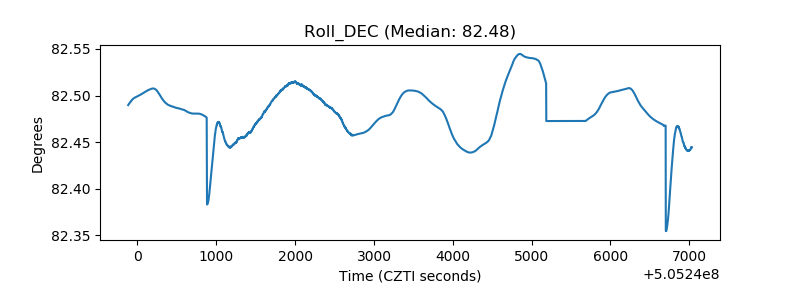 |
| _Roll_RA | 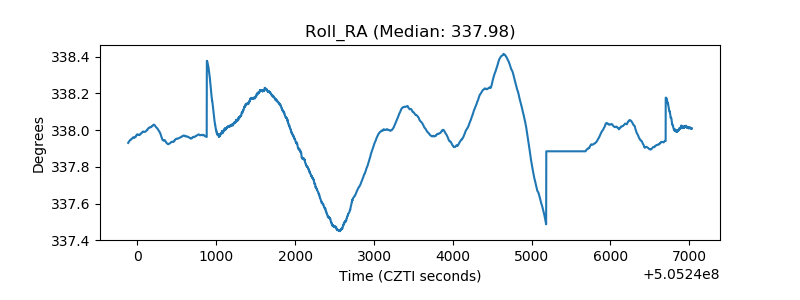 |
| Veto Counter | 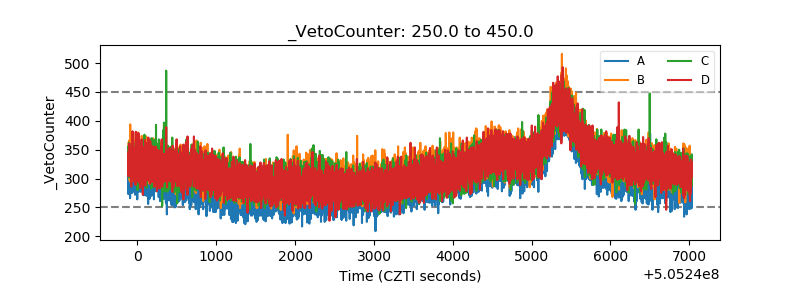 |