| Param | Original file | Final file |
|---|---|---|
| Filename | modeM0/AS1A14_021T06_9000006538_55568cztM0_level2.fits | modeM0/AS1A14_021T06_9000006538_55568cztM0_level2_quad_clean.evt |
| Size (bytes) | 558,734,400 | 106,859,520 |
| Size | 532.9 MB | 101.9 MB |
| Events in quadrant A | 5,363,421 | 677,016 |
| Events in quadrant B | 3,592,125 | 764,384 |
| Events in quadrant C | 5,615,028 | 635,507 |
| Events in quadrant D | 5,512,327 | 621,458 |
| Mode M0 | |||
|---|---|---|---|
| Quadrant | BADHDUFLAG | Total packets | Discarded packets |
| A | 0 | 21676 | 0 |
| B | 0 | 16639 | 0 |
| C | 0 | 22266 | 0 |
| D | 0 | 22092 | 0 |
| Mode SS | |||
|---|---|---|---|
| Quadrant | BADHDUFLAG | Total packets | Discarded packets |
| A | 0 | 154 | 0 |
| B | 0 | 154 | 0 |
| C | 0 | 154 | 0 |
| D | 0 | 154 | 0 |
| Quadrant | Total seconds | Saturated seconds | Saturation percentage |
|---|---|---|---|
| A | 7723 | 501 | 6.487116% |
| B | 7723 | 53 | 0.686262% |
| C | 7723 | 586 | 7.587725% |
| D | 7723 | 361 | 4.674349% |
Noise dominated data is calculated using 1-second bins in cleaned event files. If a bin has >2000 counts, and if more than 50% of those come from <1% of pixels, then it is considered to be noise-dominated and hence unusable.
| Quadrant | # 1 sec bins | Bins with >0 counts | Bins with >2000 counts | High rate bins dominated by noise | Noise dominated (total time) | Noise dominated (detector-on time) | Marked lightcurve |
|---|---|---|---|---|---|---|---|
| A | 7723 | 7723 | 459 | 459 | 5.94% | 5.94% | 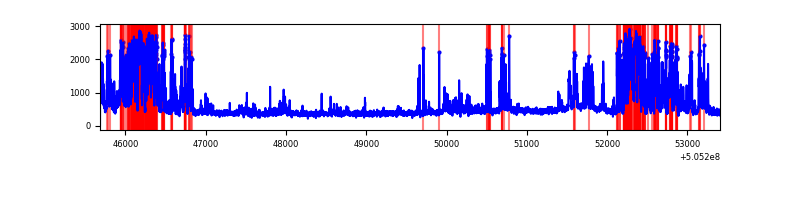 |
| B | 7723 | 7723 | 31 | 31 | 0.40% | 0.40% | 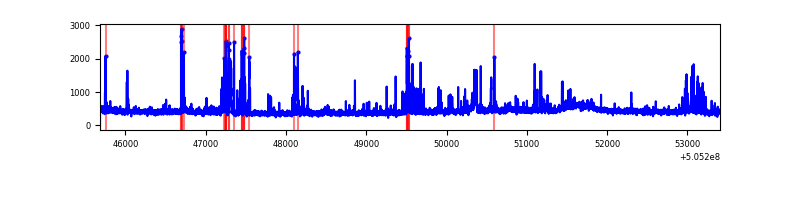 |
| C | 7723 | 7723 | 548 | 548 | 7.10% | 7.10% | 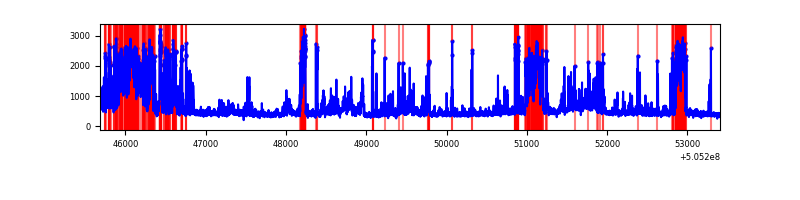 |
| D | 7723 | 7723 | 359 | 359 | 4.65% | 4.65% | 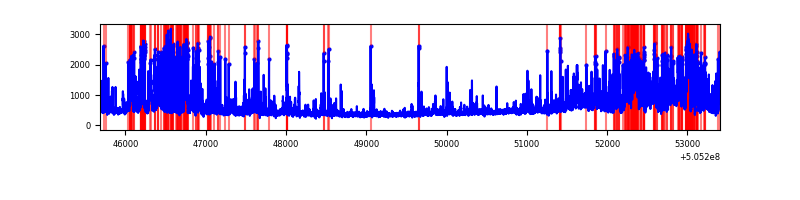 |
Top three noisy pixels from each quadrant. If the there are fewer than three noisy pixels in the level2.evt file, extra rows are filled as -1
| Pixel properties | Quadrant properties | ||||||
|---|---|---|---|---|---|---|---|
| Quadrant | DetID | PixID | Counts | Sigma | Mean | Median | Sigma |
| A | 4 | 159 | 1771367 | 9140.0 | 779 | 758 | 193.7 |
| A | 0 | 8 | 352323 | 1814.8 | 779 | 758 | 193.7 |
| A | 15 | 32 | 117418 | 602.21 | 779 | 758 | 193.7 |
| B | 4 | 206 | 217721 | 1282.53 | 785 | 758 | 169.2 |
| B | 7 | 252 | 99254 | 582.24 | 785 | 758 | 169.2 |
| B | 4 | 169 | 65274 | 381.37 | 785 | 758 | 169.2 |
| C | 9 | 38 | 1219802 | 5865.56 | 756 | 750 | 207.8 |
| C | 15 | 148 | 753367 | 3621.27 | 756 | 750 | 207.8 |
| C | 6 | 223 | 198713 | 952.51 | 756 | 750 | 207.8 |
| D | 11 | 129 | 912390 | 4231.46 | 763 | 731 | 215.4 |
| D | 8 | 128 | 357017 | 1653.7 | 763 | 731 | 215.4 |
| D | 5 | 222 | 337891 | 1564.93 | 763 | 731 | 215.4 |
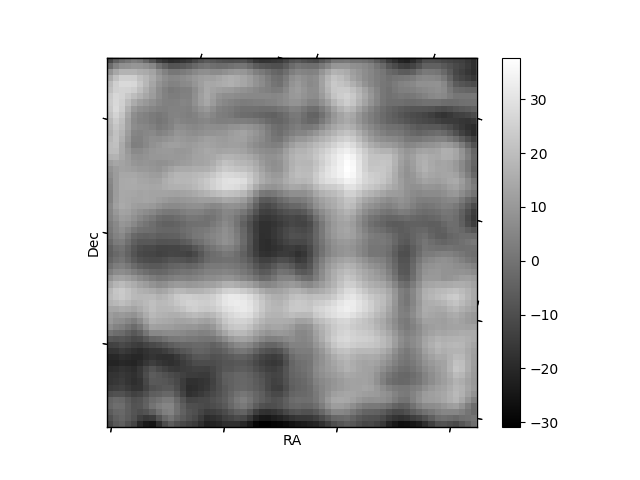
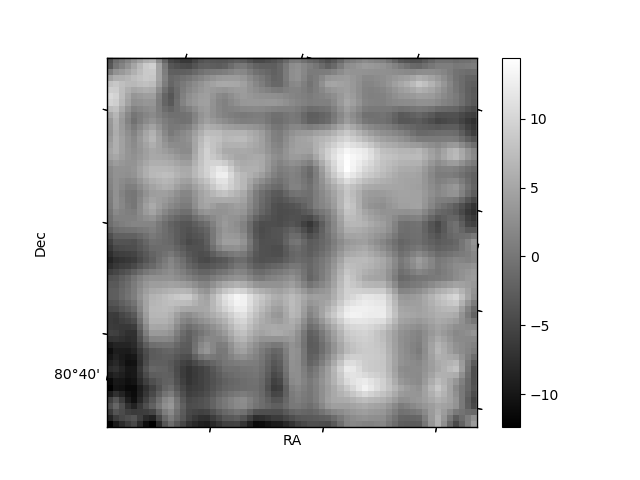
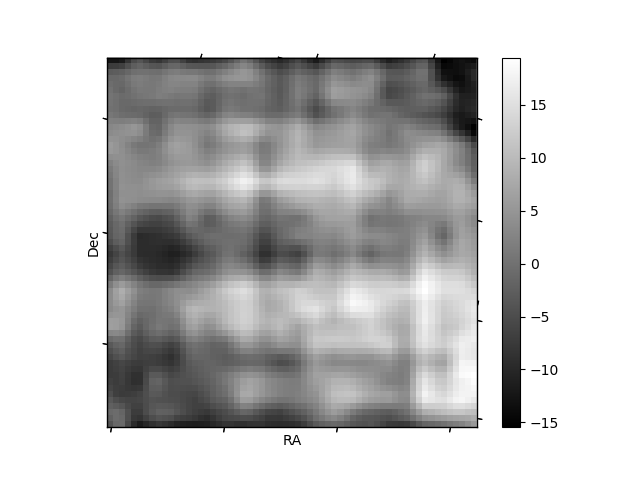
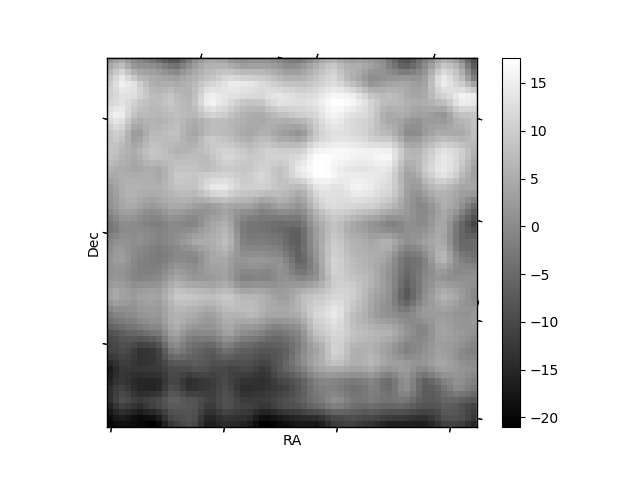
Histogram calculated using DETX and DETY for each event in the final _common_clean file
| Quadrant A | 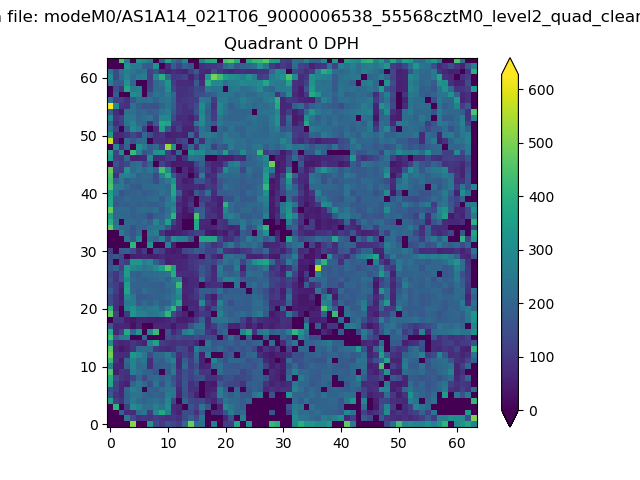 |
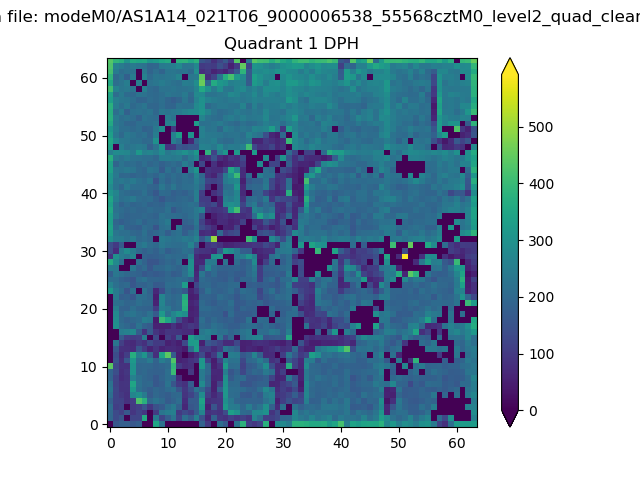 |
Quadrant B |
|---|---|---|---|
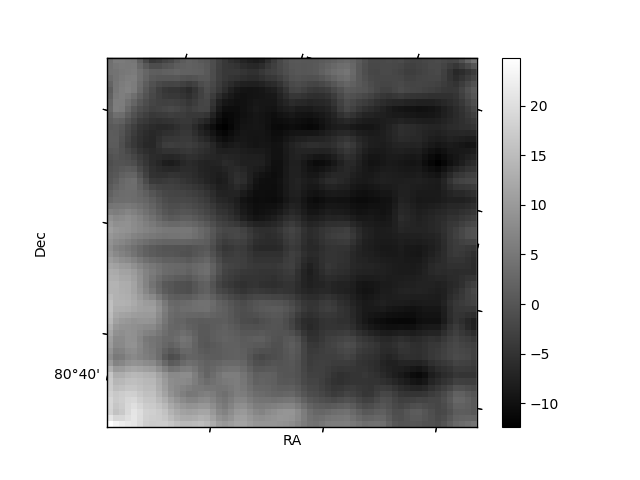
| Quadrant D | 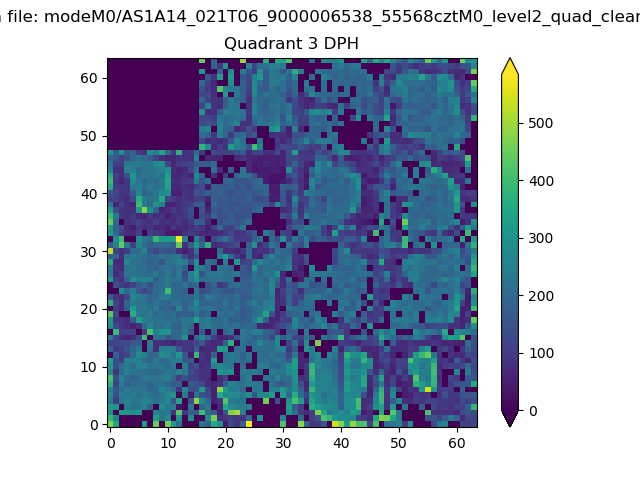 |
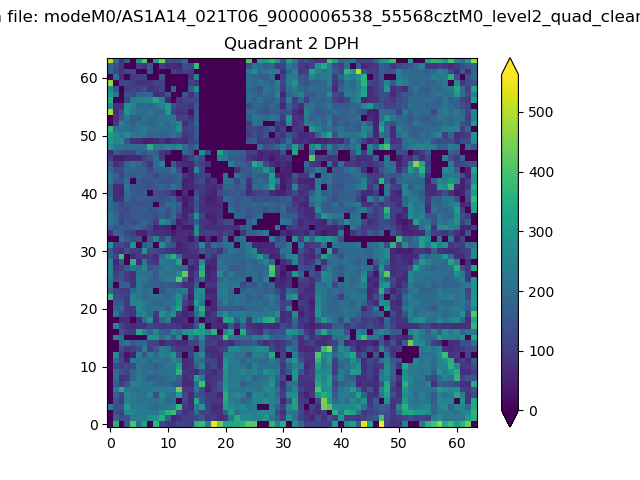 |
Quadrant C |
| Plot type | Count rate plots | Images |
|---|---|---|
| Comparison with Poisson distribution Blue bars denote a histogram of data divided into 1 sec bins. Red curve is a Poisson curve with rate = median count rate of data. |
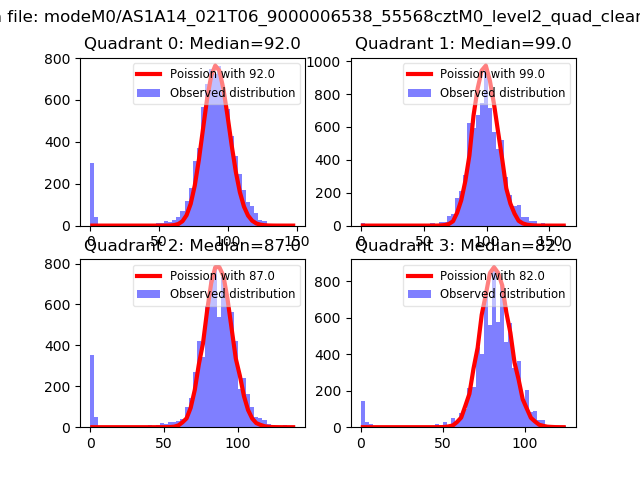 |
 |
| Quadrant-wise count rates Data is divided into 100 sec bins |
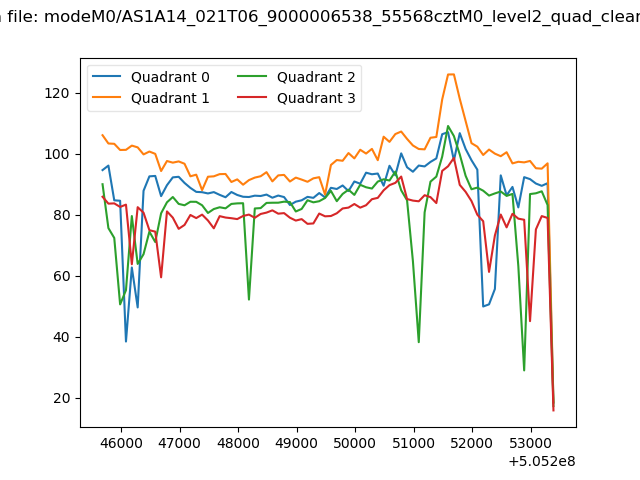 |
|
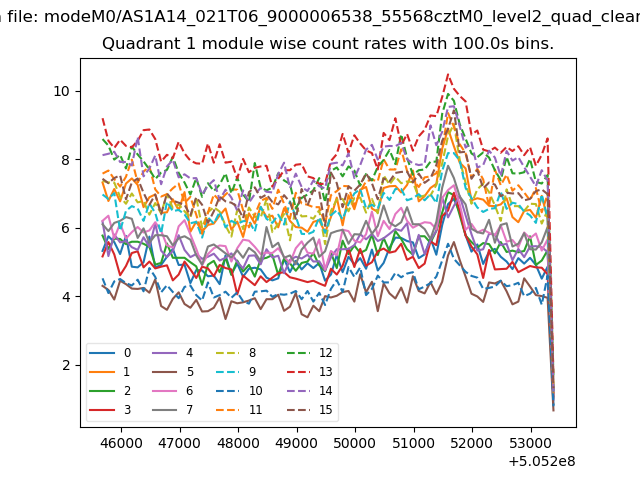
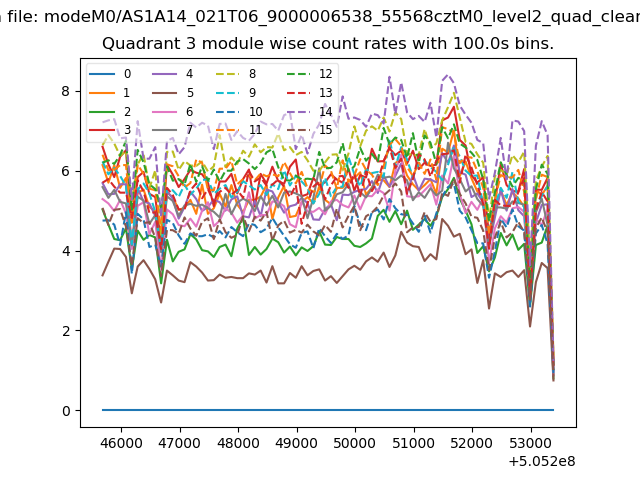
| Module-wise count rates for Quadrant A Data is divided into 100 sec bins |
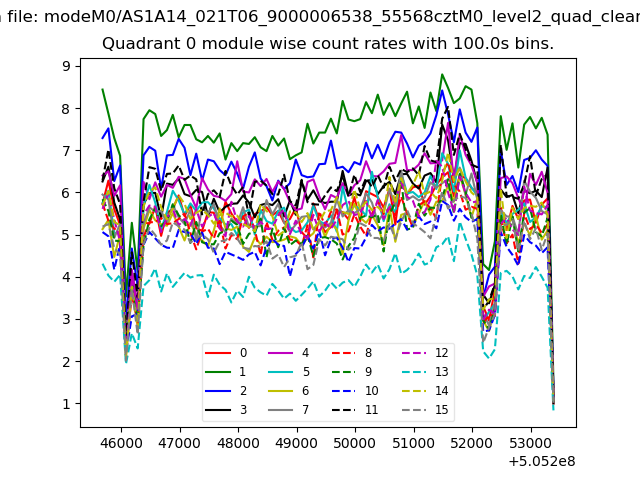 |
 |
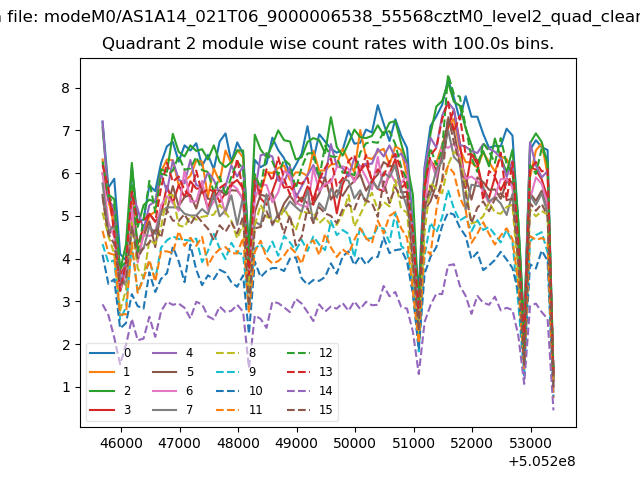
| Module-wise count rates for Quadrant B Data is divided into 100 sec bins |
 |
 |
| Module-wise count rates for Quadrant C Data is divided into 100 sec bins |
 |
 |
| Module-wise count rates for Quadrant D Data is divided into 100 sec bins |
 |
 |
| Parameter | Plot |
|---|---|
| CZT HV Monitor | 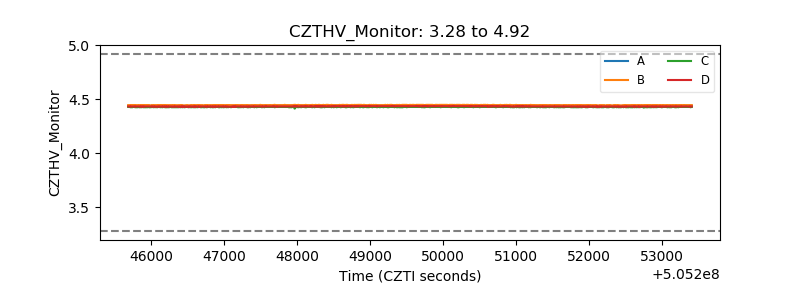 |
| D_VDD | 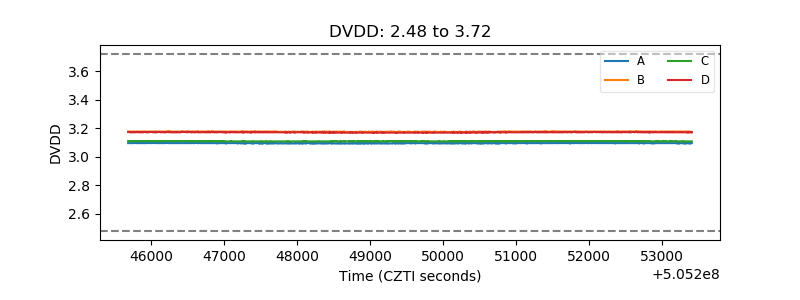 |
| Temperature 1 | 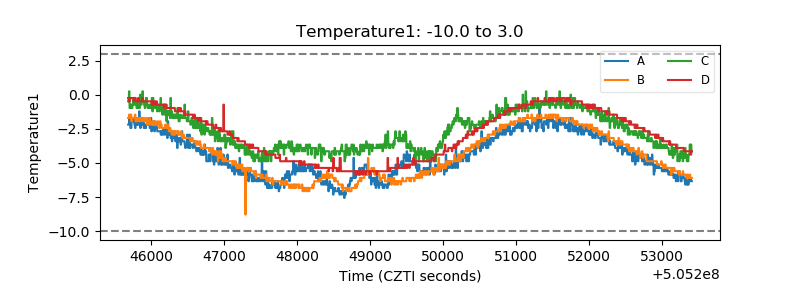 |
| Veto HV Monitor | 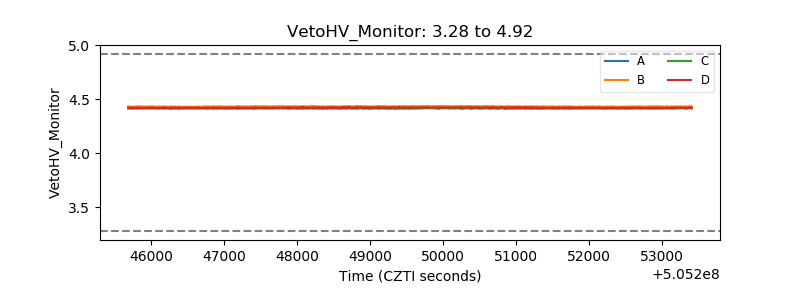 |
| Veto LLD | 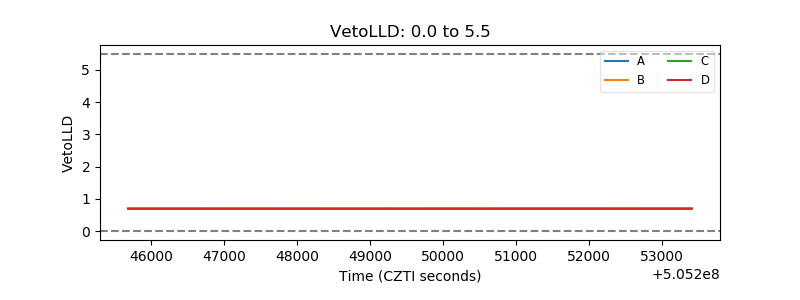 |
| Alpha Counter | 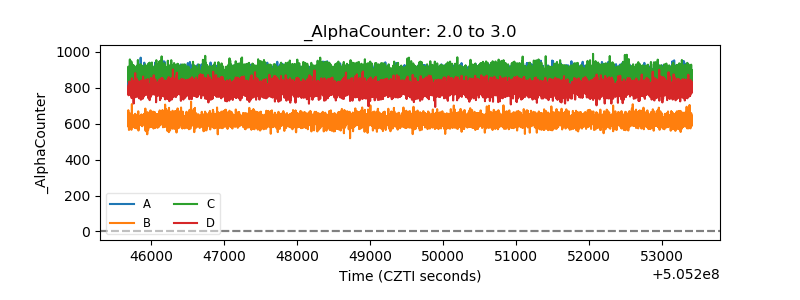 |
| _CPM_Rate | 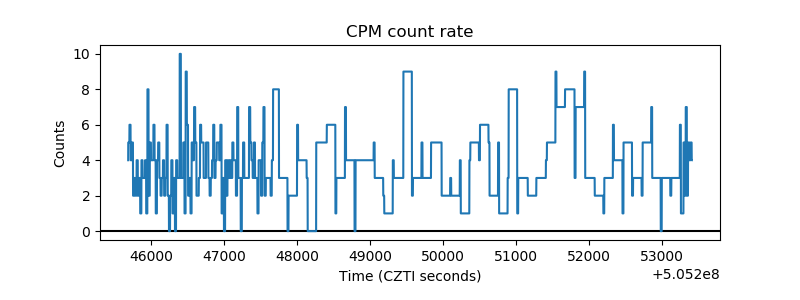 |
| CZT Counter | 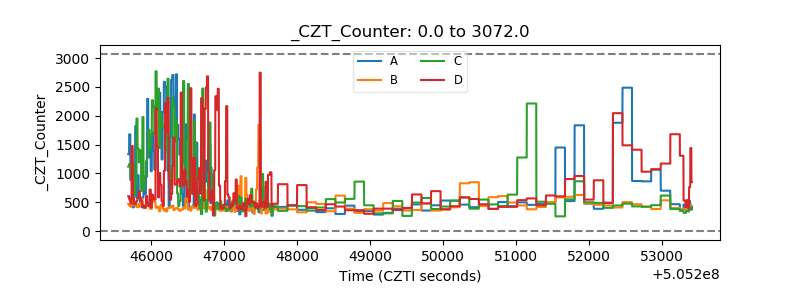 |
| +2.5 Volts monitor | 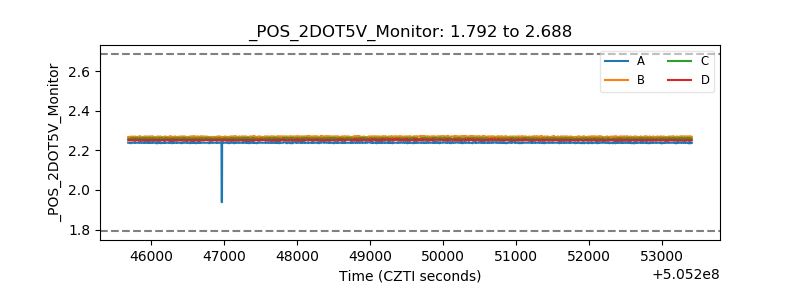 |
| +5 Volts monitor | 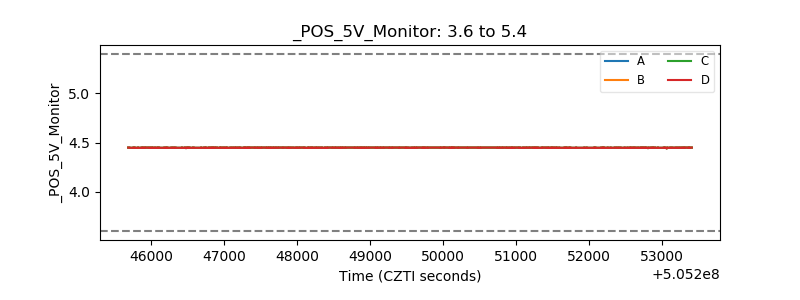 |
| _ROLL_ROT | 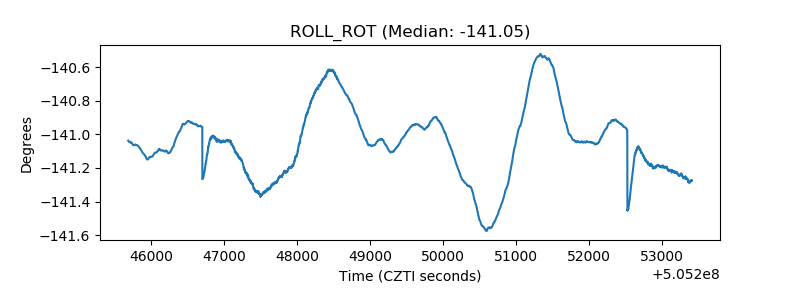 |
| _Roll_DEC | 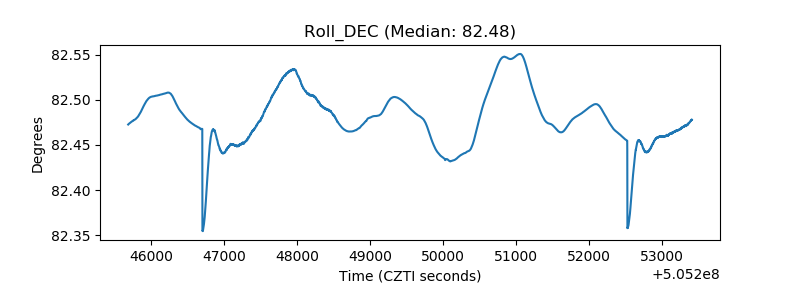 |
| _Roll_RA | 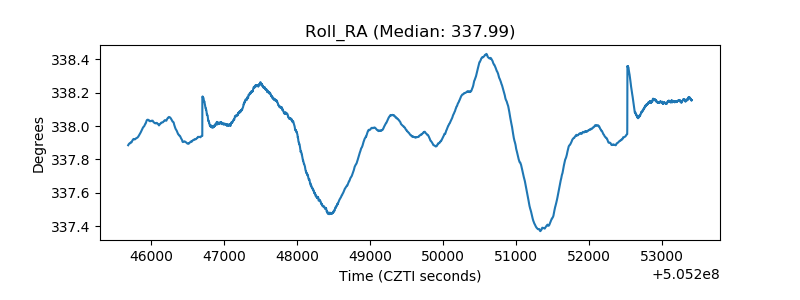 |
| Veto Counter | 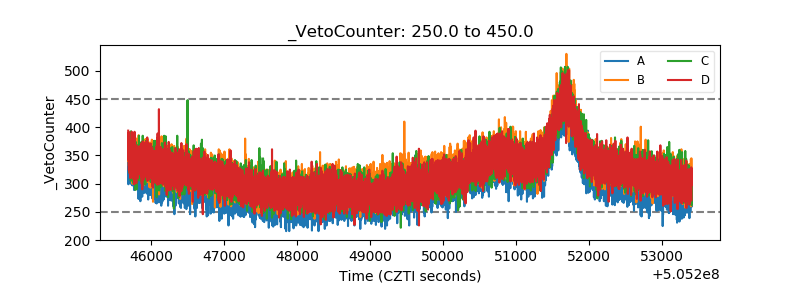 |