| Param | Original file | Final file |
|---|---|---|
| Filename | modeM0/AS1A14_021T06_9000006538_55571cztM0_level2.fits | modeM0/AS1A14_021T06_9000006538_55571cztM0_level2_quad_clean.evt |
| Size (bytes) | 1,372,236,480 | 261,806,400 |
| Size | 1.3 GB | 249.7 MB |
| Events in quadrant A | 11,266,303 | 1,697,882 |
| Events in quadrant B | 9,594,470 | 1,848,825 |
| Events in quadrant C | 15,855,373 | 1,515,521 |
| Events in quadrant D | 12,585,857 | 1,534,639 |
| Mode M9 | |||
|---|---|---|---|
| Quadrant | BADHDUFLAG | Total packets | Discarded packets |
| A | 0 | 14 | 0 |
| B | 0 | 14 | 0 |
| C | 0 | 14 | 0 |
| D | 0 | 14 | 0 |
| Mode M0 | |||
|---|---|---|---|
| Quadrant | BADHDUFLAG | Total packets | Discarded packets |
| A | 0 | 47822 | 4 |
| B | 0 | 43306 | 25 |
| C | 0 | 60897 | 13 |
| D | 0 | 51845 | 18 |
| Mode SS | |||
|---|---|---|---|
| Quadrant | BADHDUFLAG | Total packets | Discarded packets |
| A | 0 | 390 | 0 |
| B | 0 | 390 | 0 |
| C | 0 | 390 | 0 |
| D | 0 | 390 | 0 |
| Quadrant | Total seconds | Saturated seconds | Saturation percentage |
|---|---|---|---|
| A | 19308 | 782 | 4.050135% |
| B | 19299 | 477 | 2.471631% |
| C | 19304 | 1953 | 10.117074% |
| D | 19303 | 804 | 4.165156% |
Noise dominated data is calculated using 1-second bins in cleaned event files. If a bin has >2000 counts, and if more than 50% of those come from <1% of pixels, then it is considered to be noise-dominated and hence unusable.
| Quadrant | # 1 sec bins | Bins with >0 counts | Bins with >2000 counts | High rate bins dominated by noise | Noise dominated (total time) | Noise dominated (detector-on time) | Marked lightcurve |
|---|---|---|---|---|---|---|---|
| A | 20568 | 19313 | 553 | 553 | 2.69% | 2.86% | 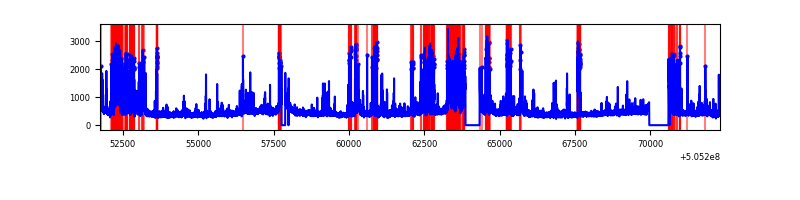 |
| B | 20569 | 19310 | 309 | 309 | 1.50% | 1.60% | 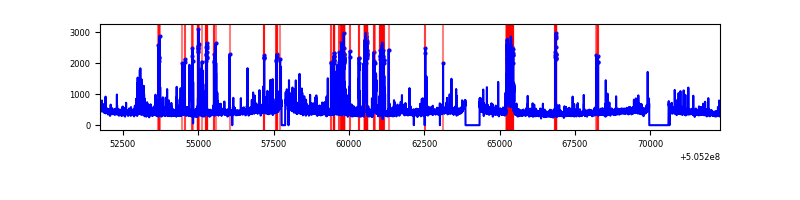 |
| C | 20568 | 19312 | 1441 | 1441 | 7.01% | 7.46% | 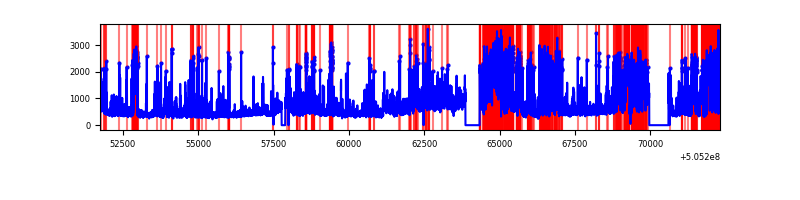 |
| D | 20568 | 19312 | 743 | 743 | 3.61% | 3.85% | 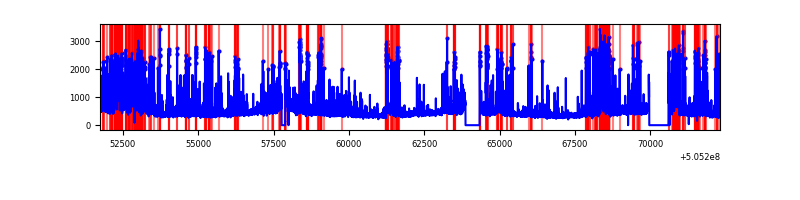 |
Top three noisy pixels from each quadrant. If the there are fewer than three noisy pixels in the level2.evt file, extra rows are filled as -1
| Pixel properties | Quadrant properties | ||||||
|---|---|---|---|---|---|---|---|
| Quadrant | DetID | PixID | Counts | Sigma | Mean | Median | Sigma |
| A | 4 | 159 | 1487083 | 3091.95 | 1956 | 1904 | 480.3 |
| A | 15 | 32 | 1232194 | 2561.31 | 1956 | 1904 | 480.3 |
| A | 0 | 8 | 625154 | 1297.53 | 1956 | 1904 | 480.3 |
| B | 4 | 206 | 743382 | 1761.55 | 1958 | 1881 | 420.9 |
| B | 2 | 249 | 584104 | 1383.16 | 1958 | 1881 | 420.9 |
| B | 4 | 169 | 127351 | 298.07 | 1958 | 1881 | 420.9 |
| C | 9 | 38 | 6748873 | 13173.11 | 1871 | 1849 | 512.2 |
| C | 12 | 252 | 980257 | 1910.28 | 1871 | 1849 | 512.2 |
| C | 13 | 3 | 313632 | 608.73 | 1871 | 1849 | 512.2 |
| D | 11 | 129 | 3209455 | 5951.58 | 1905 | 1818 | 539.0 |
| D | 8 | 128 | 478547 | 884.54 | 1905 | 1818 | 539.0 |
| D | 2 | 172 | 450984 | 833.4 | 1905 | 1818 | 539.0 |
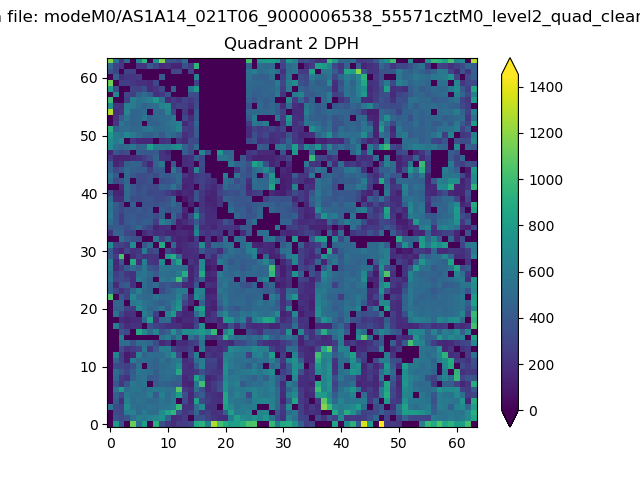
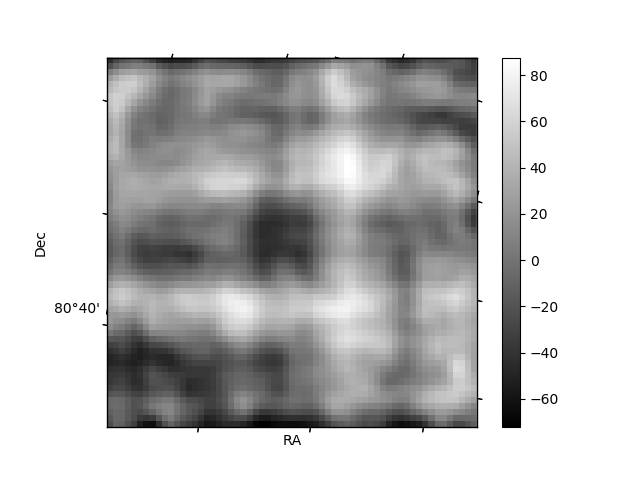
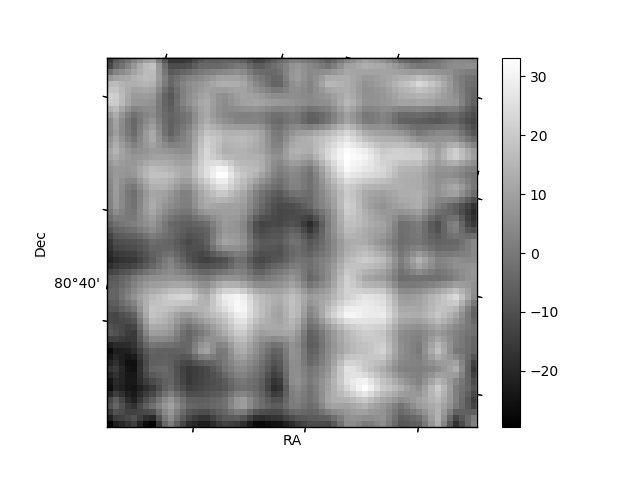
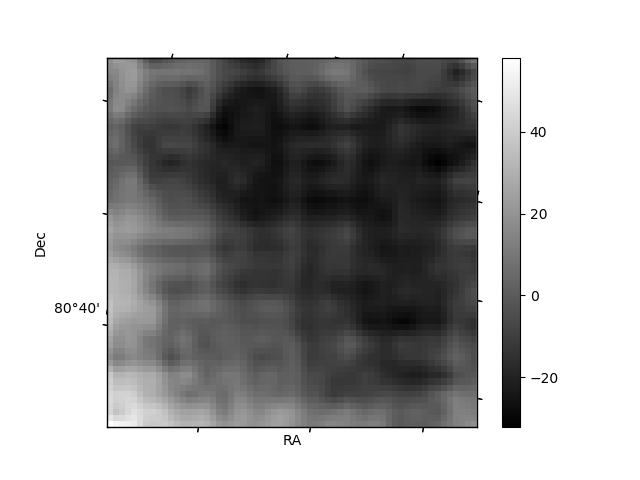
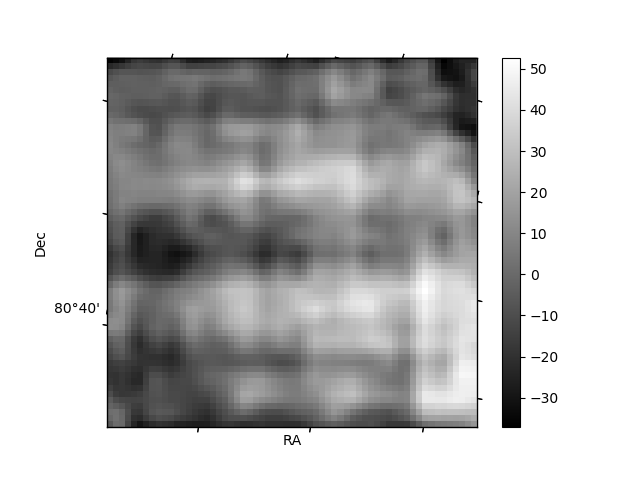
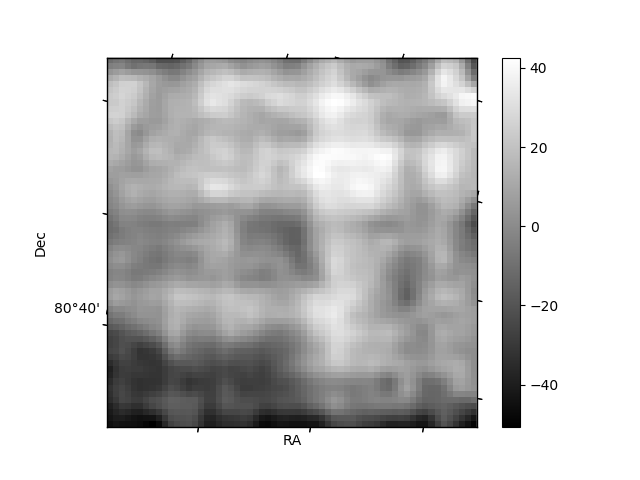
Histogram calculated using DETX and DETY for each event in the final _common_clean file
| Quadrant A | 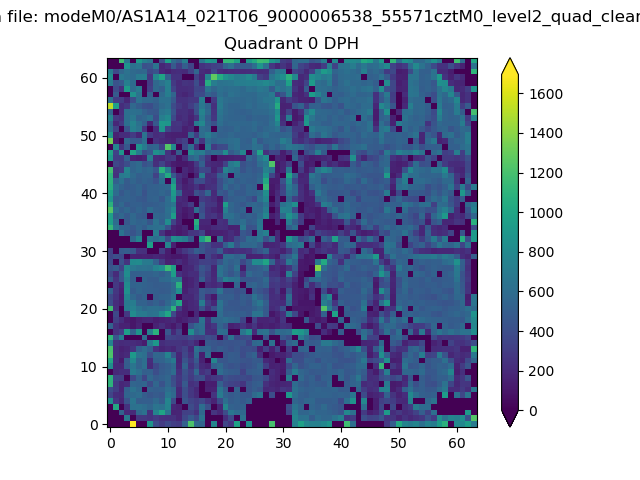 |
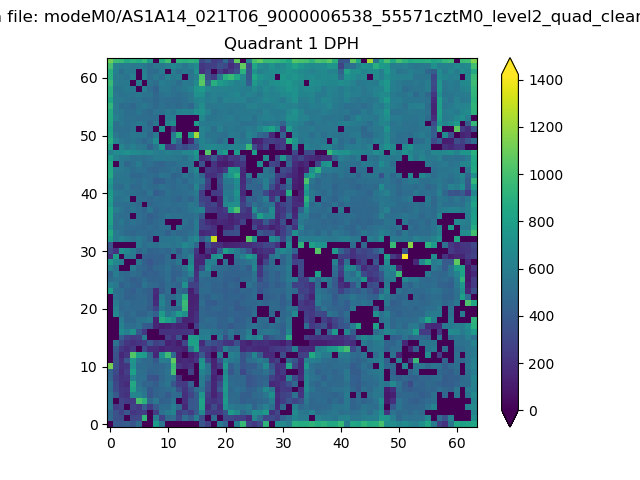 |
Quadrant B |
|---|---|---|---|
| Quadrant D | 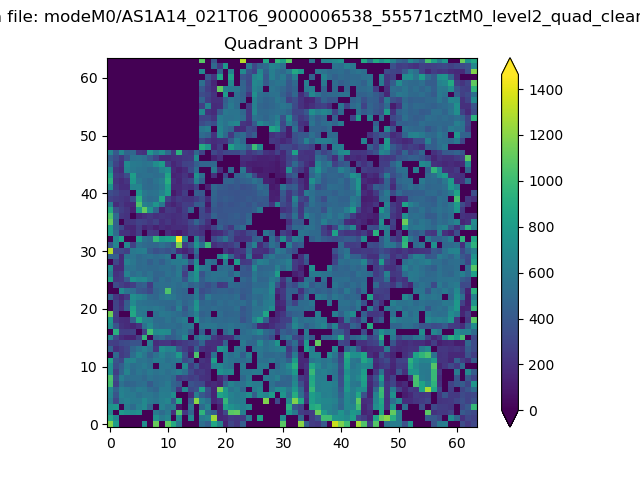 |
 |
Quadrant C |
| Plot type | Count rate plots | Images |
|---|---|---|
| Comparison with Poisson distribution Blue bars denote a histogram of data divided into 1 sec bins. Red curve is a Poisson curve with rate = median count rate of data. |
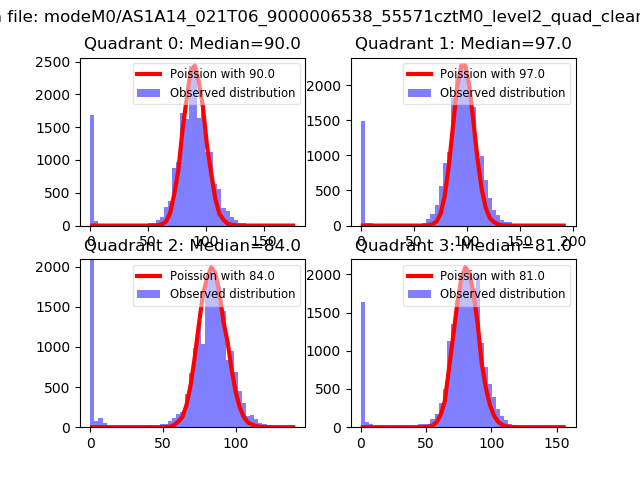 |
 |
| Quadrant-wise count rates Data is divided into 100 sec bins |
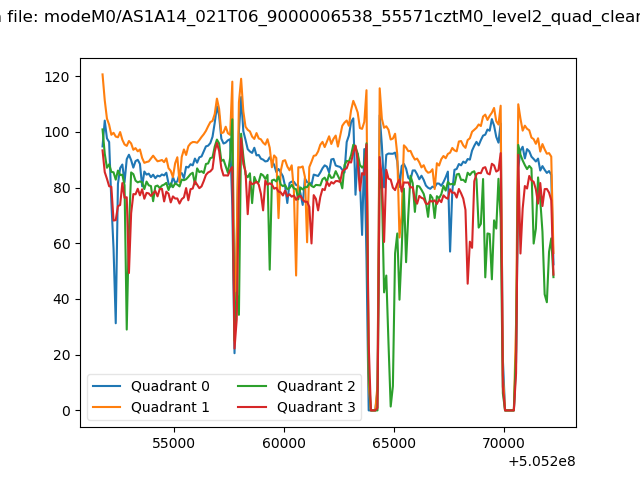 |
|
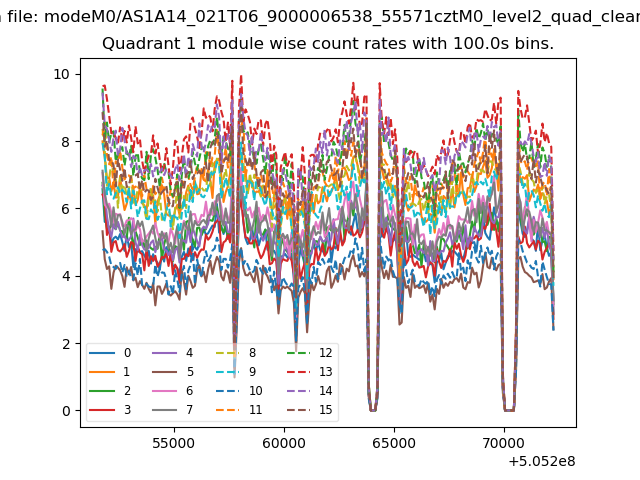
| Module-wise count rates for Quadrant A Data is divided into 100 sec bins |
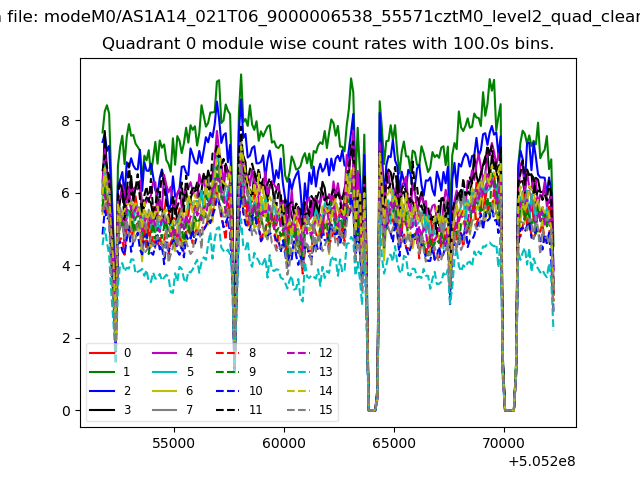 |
 |
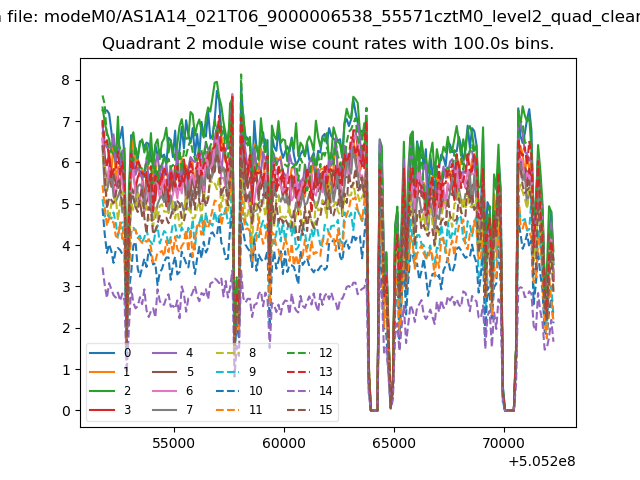
| Module-wise count rates for Quadrant B Data is divided into 100 sec bins |
 |
 |
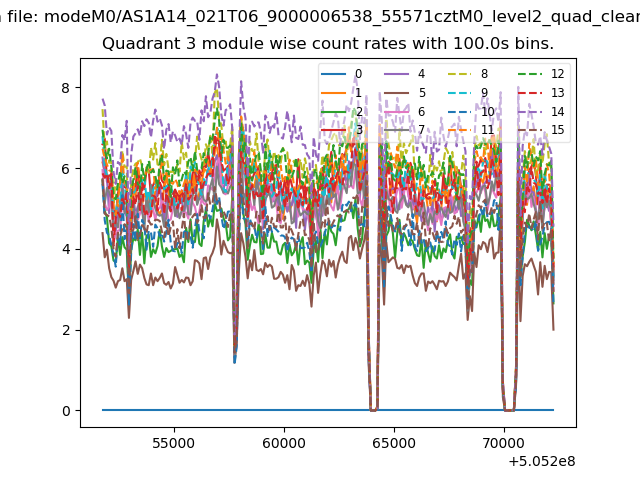
| Module-wise count rates for Quadrant C Data is divided into 100 sec bins |
 |
 |
| Module-wise count rates for Quadrant D Data is divided into 100 sec bins |
 |
 |
| Parameter | Plot |
|---|---|
| CZT HV Monitor |  |
| D_VDD | 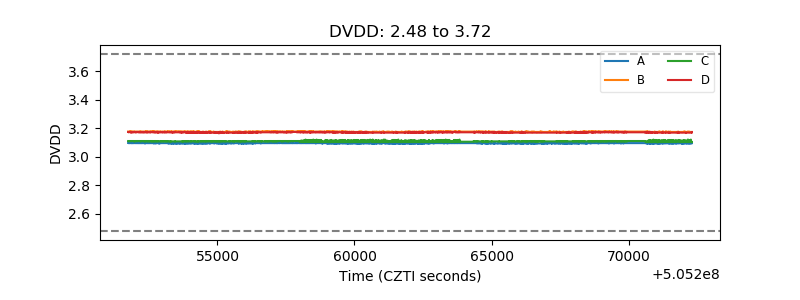 |
| Temperature 1 | 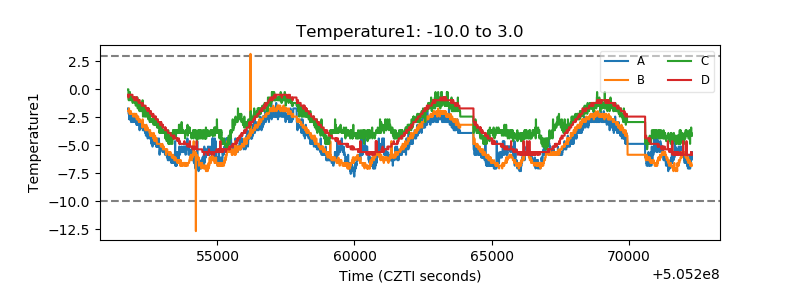 |
| Veto HV Monitor | 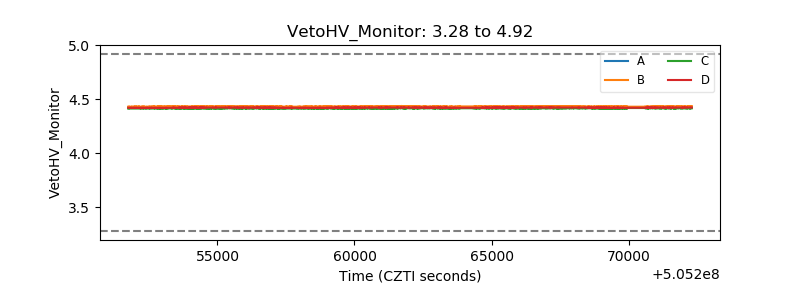 |
| Veto LLD | 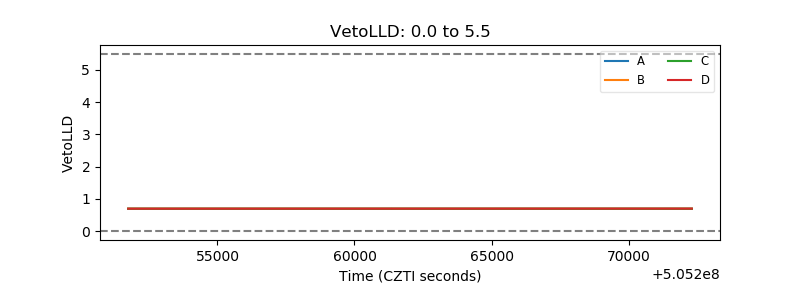 |
| Alpha Counter | 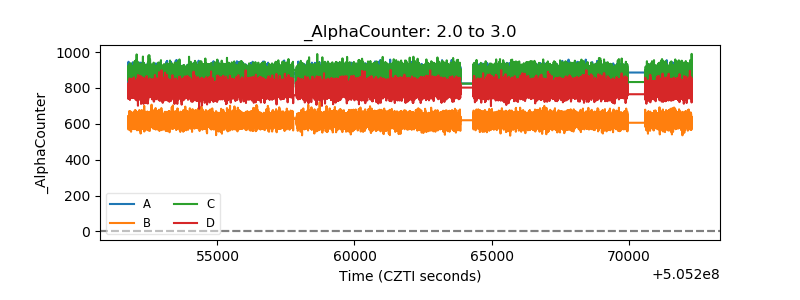 |
| _CPM_Rate | 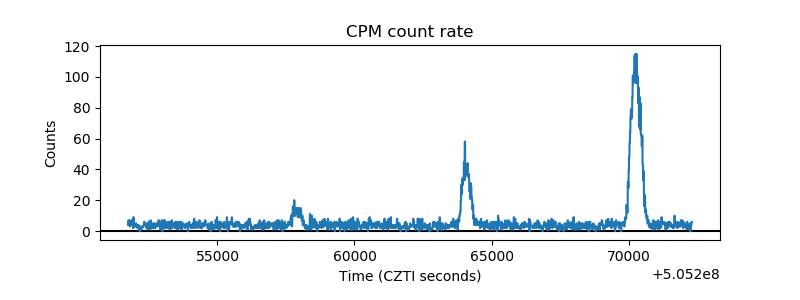 |
| CZT Counter | 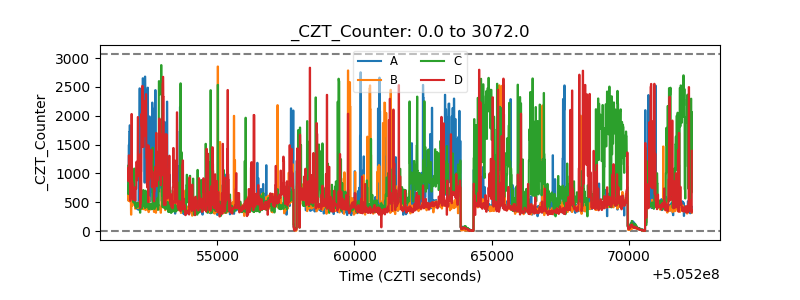 |
| +2.5 Volts monitor | 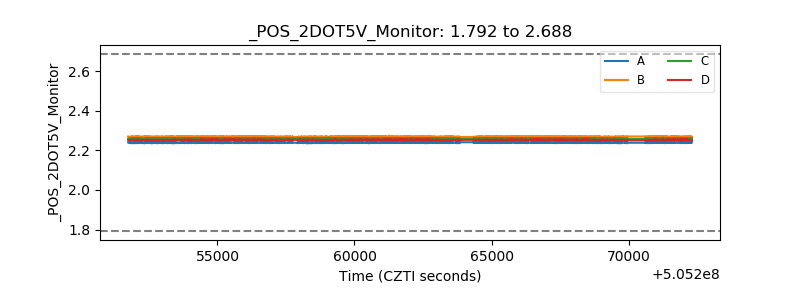 |
| +5 Volts monitor | 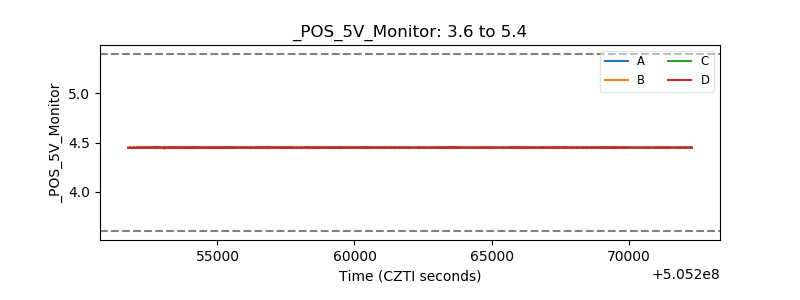 |
| _ROLL_ROT | 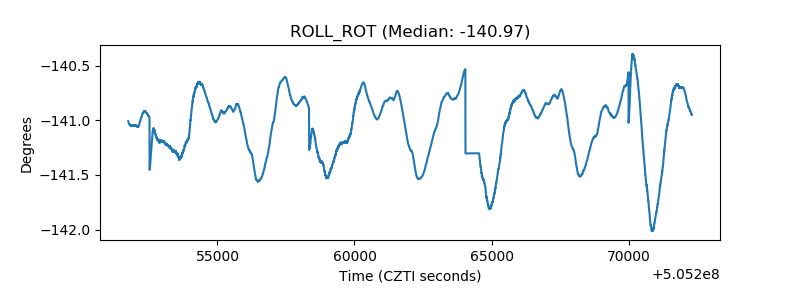 |
| _Roll_DEC | 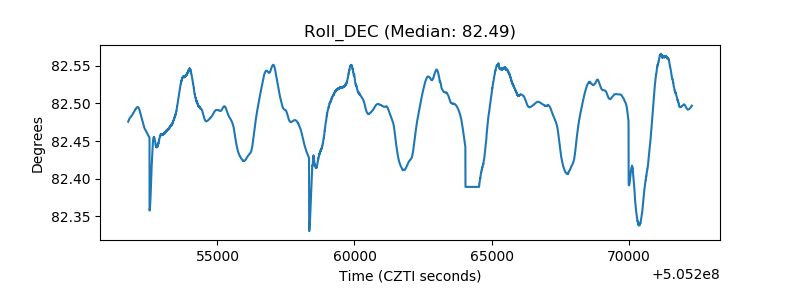 |
| _Roll_RA | 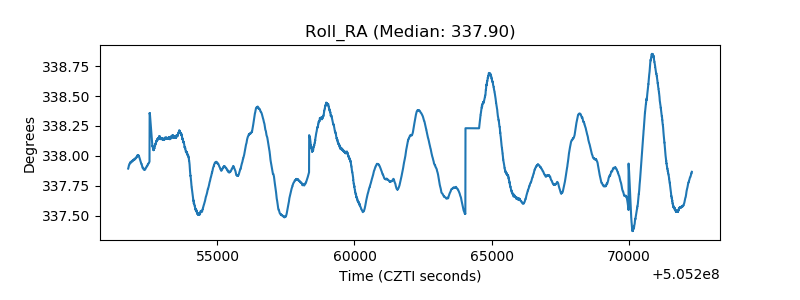 |
| Veto Counter | 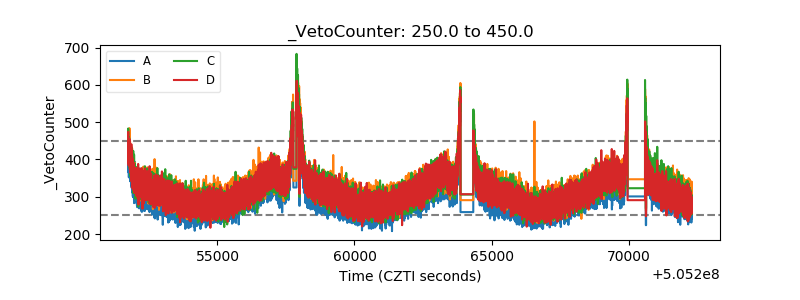 |