| Param | Original file | Final file |
|---|---|---|
| Filename | modeM0/AS1A14_021T06_9000006538_55572cztM0_level2.fits | modeM0/AS1A14_021T06_9000006538_55572cztM0_level2_quad_clean.evt |
| Size (bytes) | 604,117,440 | 94,867,200 |
| Size | 576.1 MB | 90.5 MB |
| Events in quadrant A | 4,308,479 | 627,102 |
| Events in quadrant B | 3,019,170 | 698,502 |
| Events in quadrant C | 9,969,375 | 491,362 |
| Events in quadrant D | 4,514,708 | 561,307 |
| Mode M9 | |||
|---|---|---|---|
| Quadrant | BADHDUFLAG | Total packets | Discarded packets |
| A | 0 | 15 | 0 |
| B | 0 | 15 | 0 |
| C | 0 | 15 | 0 |
| D | 0 | 15 | 0 |
| Mode M0 | |||
|---|---|---|---|
| Quadrant | BADHDUFLAG | Total packets | Discarded packets |
| A | 0 | 18058 | 2 |
| B | 0 | 14633 | 2 |
| C | 0 | 34548 | 15 |
| D | 0 | 18773 | 2 |
| Mode SS | |||
|---|---|---|---|
| Quadrant | BADHDUFLAG | Total packets | Discarded packets |
| A | 0 | 144 | 0 |
| B | 0 | 144 | 0 |
| C | 0 | 144 | 0 |
| D | 0 | 144 | 0 |
| Quadrant | Total seconds | Saturated seconds | Saturation percentage |
|---|---|---|---|
| A | 7099 | 277 | 3.901958% |
| B | 7099 | 57 | 0.802930% |
| C | 7097 | 1836 | 25.870086% |
| D | 7100 | 369 | 5.197183% |
Noise dominated data is calculated using 1-second bins in cleaned event files. If a bin has >2000 counts, and if more than 50% of those come from <1% of pixels, then it is considered to be noise-dominated and hence unusable.
| Quadrant | # 1 sec bins | Bins with >0 counts | Bins with >2000 counts | High rate bins dominated by noise | Noise dominated (total time) | Noise dominated (detector-on time) | Marked lightcurve |
|---|---|---|---|---|---|---|---|
| A | 8589 | 7102 | 233 | 233 | 2.71% | 3.28% | 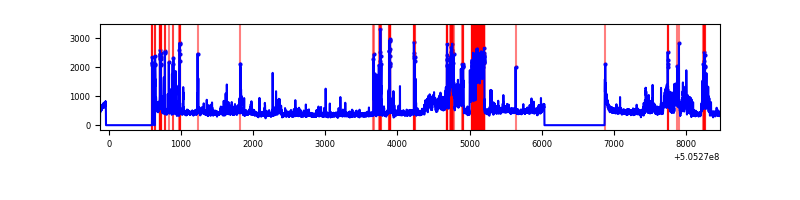 |
| B | 8589 | 7102 | 5 | 5 | 0.06% | 0.07% | 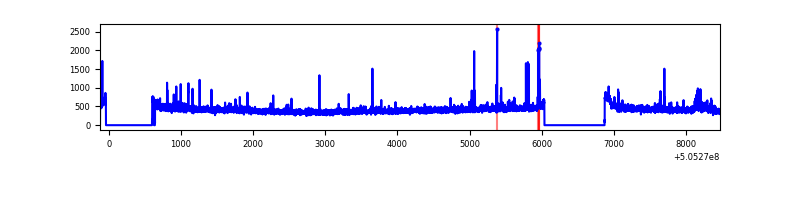 |
| C | 8590 | 7102 | 1831 | 1831 | 21.32% | 25.78% | 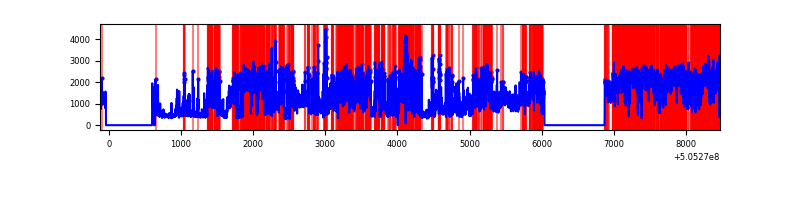 |
| D | 8590 | 7103 | 340 | 340 | 3.96% | 4.79% | 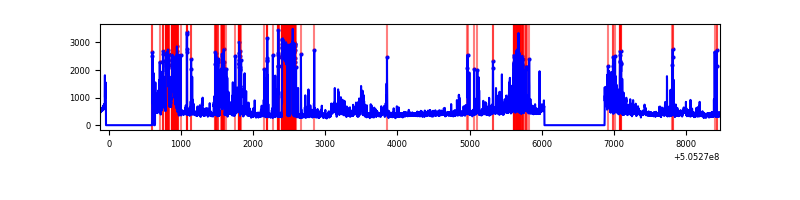 |
Top three noisy pixels from each quadrant. If the there are fewer than three noisy pixels in the level2.evt file, extra rows are filled as -1
| Pixel properties | Quadrant properties | ||||||
|---|---|---|---|---|---|---|---|
| Quadrant | DetID | PixID | Counts | Sigma | Mean | Median | Sigma |
| A | 12 | 115 | 883767 | 4933.67 | 720 | 702 | 179.0 |
| A | 15 | 32 | 312131 | 1739.95 | 720 | 702 | 179.0 |
| A | 0 | 8 | 114510 | 635.84 | 720 | 702 | 179.0 |
| B | 5 | 172 | 50983 | 323.6 | 721 | 695 | 155.4 |
| B | 10 | 247 | 39310 | 248.48 | 721 | 695 | 155.4 |
| B | 4 | 169 | 24204 | 151.28 | 721 | 695 | 155.4 |
| C | 9 | 38 | 6704335 | 37052.49 | 659 | 650 | 180.9 |
| C | 12 | 252 | 398454 | 2198.73 | 659 | 650 | 180.9 |
| C | 13 | 3 | 78362 | 429.53 | 659 | 650 | 180.9 |
| D | 11 | 129 | 1607625 | 8208.95 | 691 | 660 | 195.8 |
| D | 5 | 173 | 61183 | 309.17 | 691 | 660 | 195.8 |
| D | 2 | 31 | 46968 | 236.56 | 691 | 660 | 195.8 |
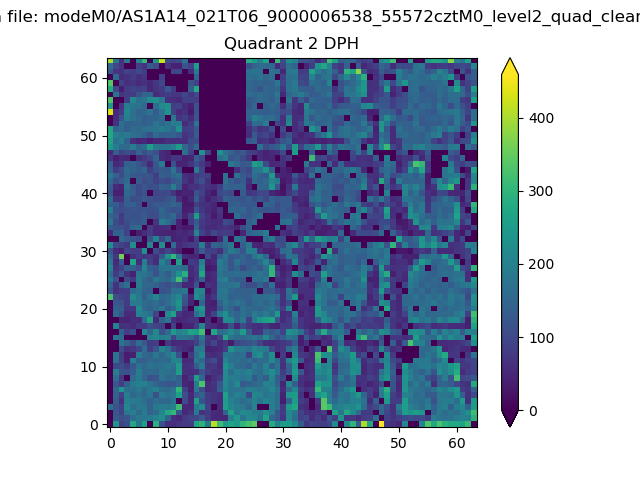
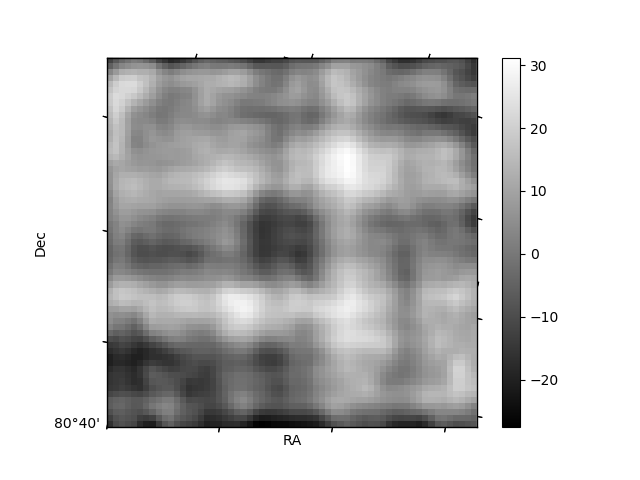
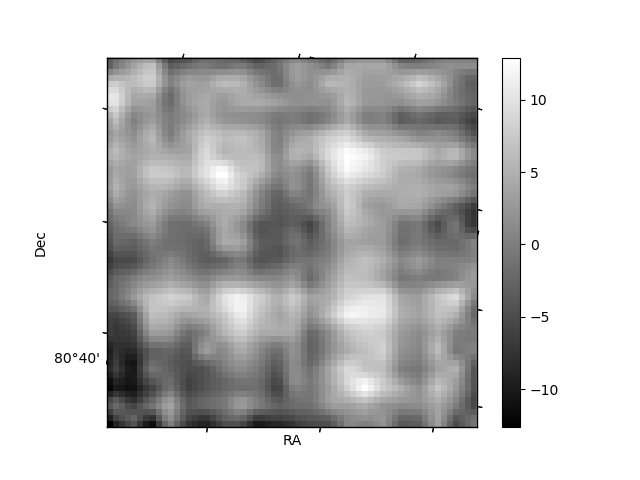
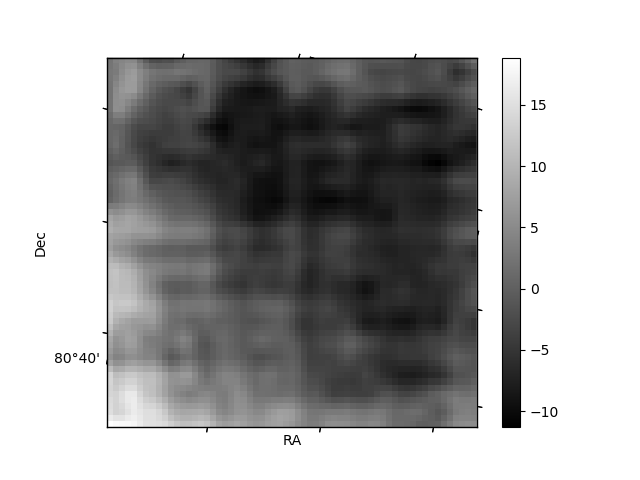
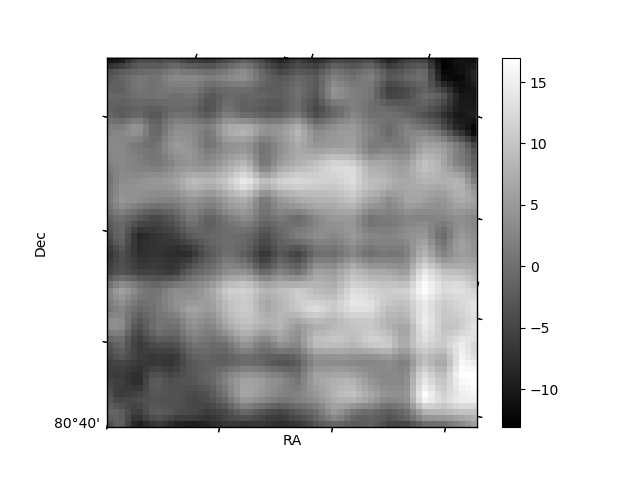
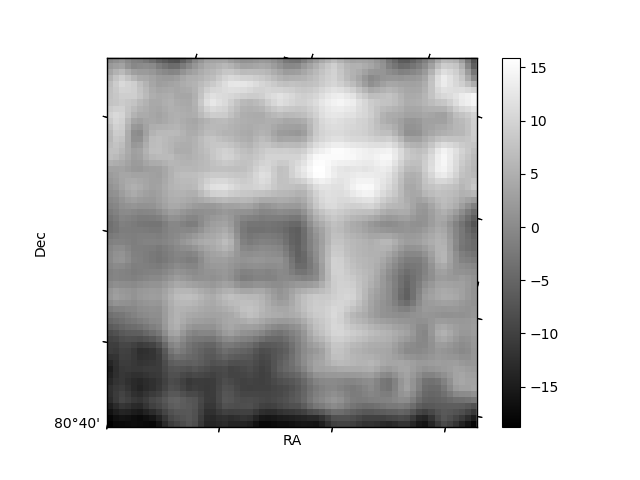
Histogram calculated using DETX and DETY for each event in the final _common_clean file
| Quadrant A | 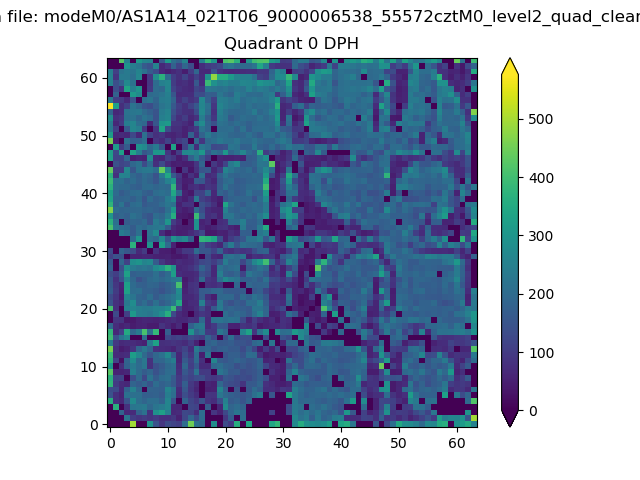 |
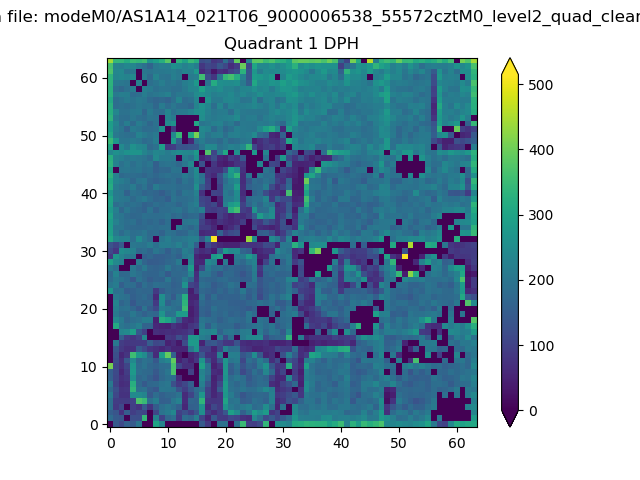 |
Quadrant B |
|---|---|---|---|
| Quadrant D | 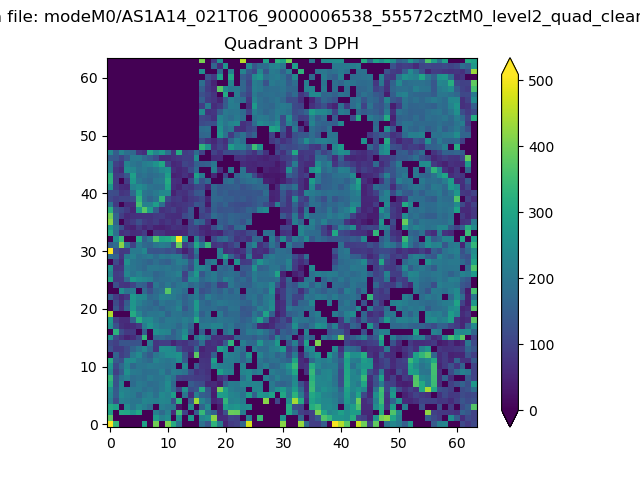 |
 |
Quadrant C |
| Plot type | Count rate plots | Images |
|---|---|---|
| Comparison with Poisson distribution Blue bars denote a histogram of data divided into 1 sec bins. Red curve is a Poisson curve with rate = median count rate of data. |
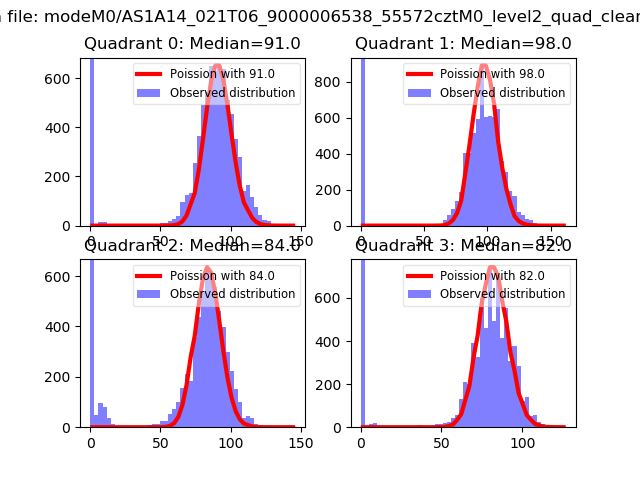 |
 |
| Quadrant-wise count rates Data is divided into 100 sec bins |
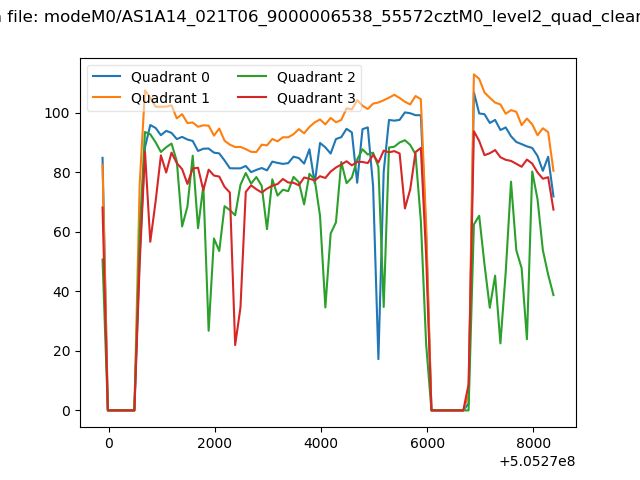 |
|
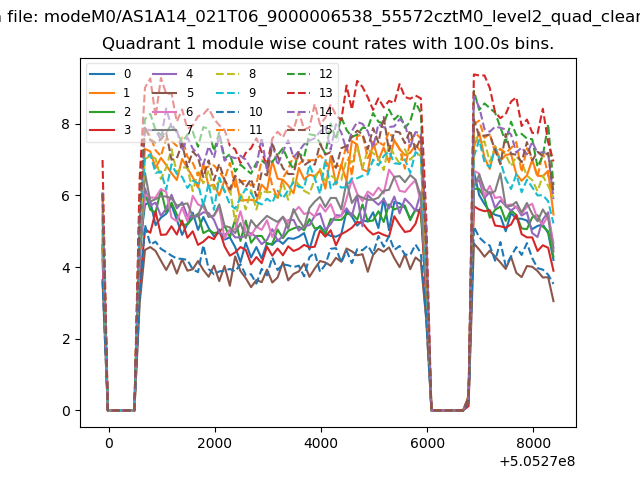
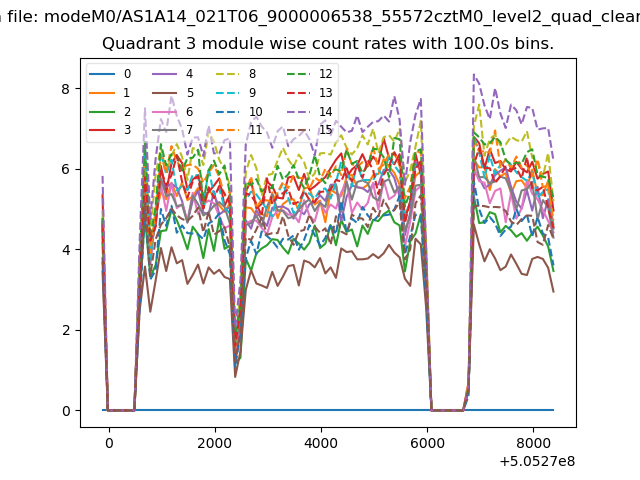
| Module-wise count rates for Quadrant A Data is divided into 100 sec bins |
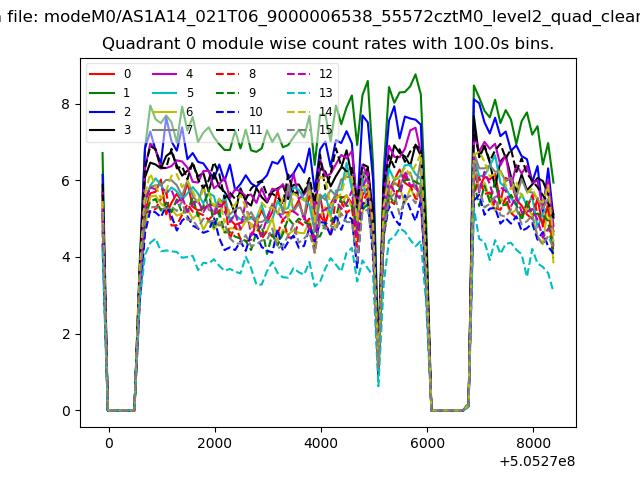 |
 |
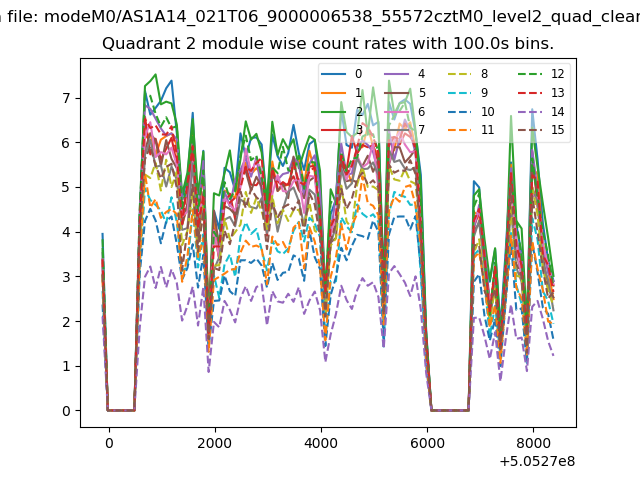
| Module-wise count rates for Quadrant B Data is divided into 100 sec bins |
 |
 |
| Module-wise count rates for Quadrant C Data is divided into 100 sec bins |
 |
 |
| Module-wise count rates for Quadrant D Data is divided into 100 sec bins |
 |
 |
| Parameter | Plot |
|---|---|
| CZT HV Monitor | 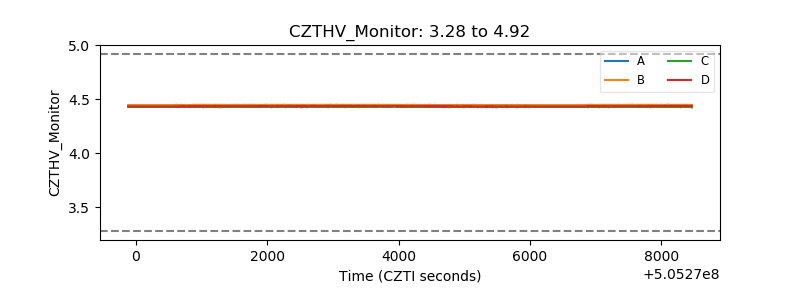 |
| D_VDD | 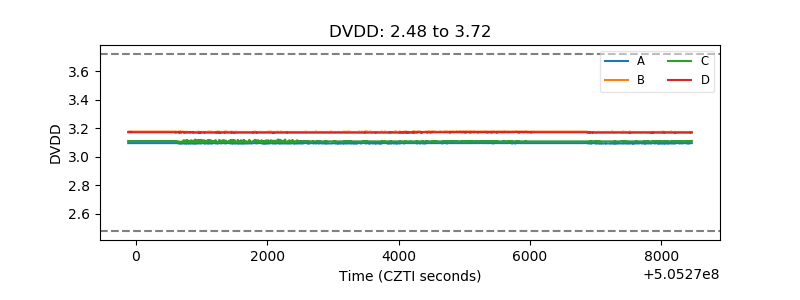 |
| Temperature 1 | 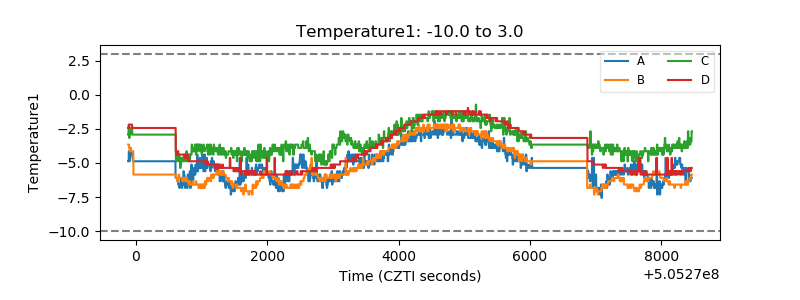 |
| Veto HV Monitor | 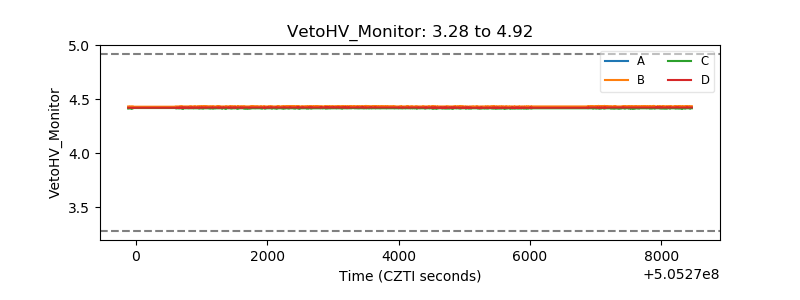 |
| Veto LLD | 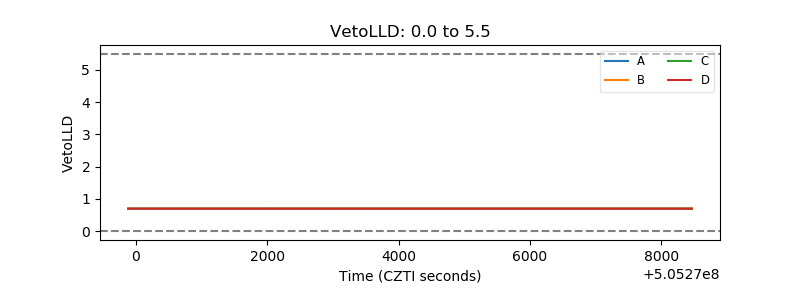 |
| Alpha Counter | 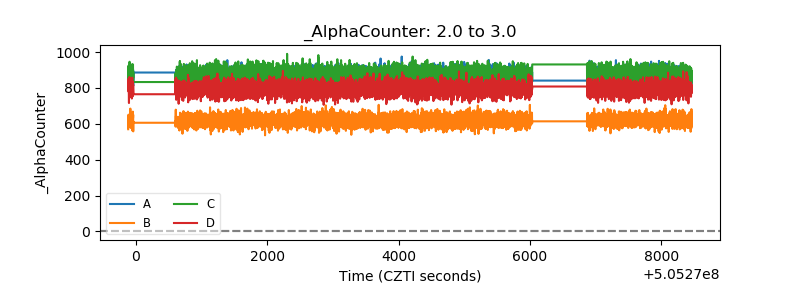 |
| _CPM_Rate | 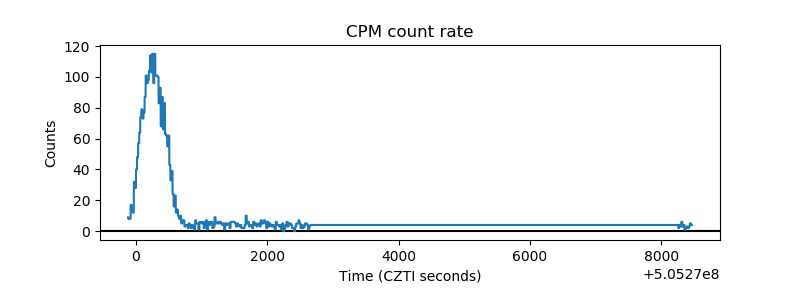 |
| CZT Counter | 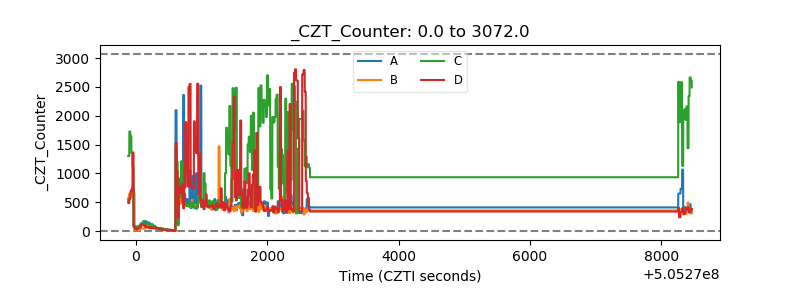 |
| +2.5 Volts monitor | 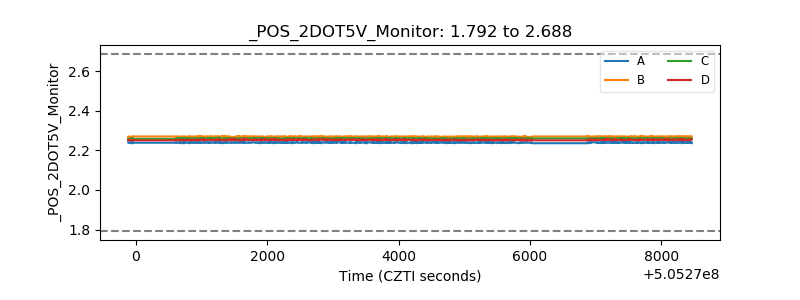 |
| +5 Volts monitor |  |
| _ROLL_ROT | 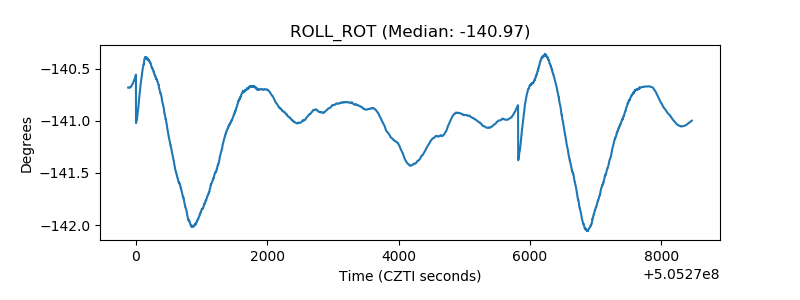 |
| _Roll_DEC | 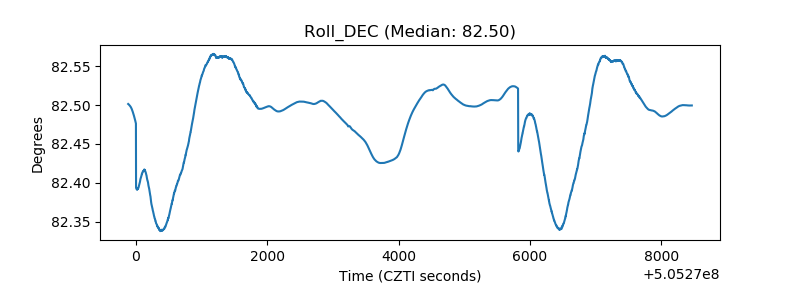 |
| _Roll_RA | 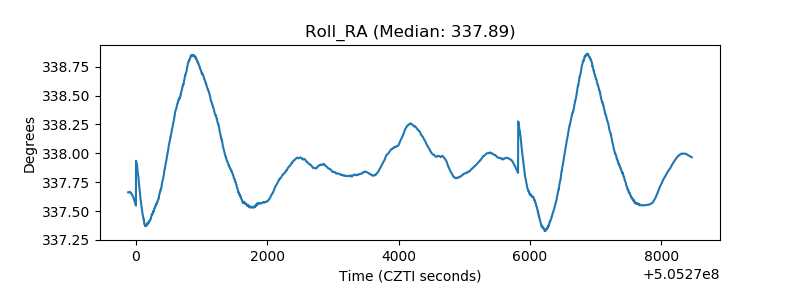 |
| Veto Counter | 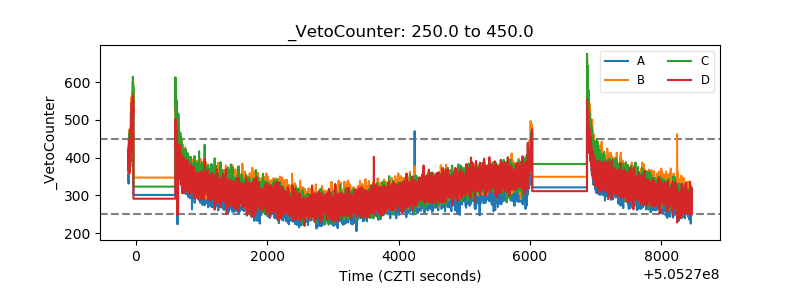 |