| Param | Original file | Final file |
|---|---|---|
| Filename | modeM0/AS1A14_021T06_9000006538_55574cztM0_level2.fits | modeM0/AS1A14_021T06_9000006538_55574cztM0_level2_quad_clean.evt |
| Size (bytes) | 650,666,880 | 93,729,600 |
| Size | 620.5 MB | 89.4 MB |
| Events in quadrant A | 6,297,485 | 608,472 |
| Events in quadrant B | 2,947,369 | 684,397 |
| Events in quadrant C | 9,886,089 | 503,983 |
| Events in quadrant D | 4,422,625 | 561,690 |
| Mode M9 | |||
|---|---|---|---|
| Quadrant | BADHDUFLAG | Total packets | Discarded packets |
| A | 0 | 18 | 0 |
| B | 0 | 18 | 0 |
| C | 0 | 18 | 0 |
| D | 0 | 18 | 0 |
| Mode M0 | |||
|---|---|---|---|
| Quadrant | BADHDUFLAG | Total packets | Discarded packets |
| A | 0 | 23505 | 2 |
| B | 0 | 14183 | 2 |
| C | 0 | 34184 | 2 |
| D | 0 | 18295 | 2 |
| Mode SS | |||
|---|---|---|---|
| Quadrant | BADHDUFLAG | Total packets | Discarded packets |
| A | 0 | 142 | 0 |
| B | 0 | 142 | 0 |
| C | 0 | 142 | 0 |
| D | 0 | 142 | 0 |
| Quadrant | Total seconds | Saturated seconds | Saturation percentage |
|---|---|---|---|
| A | 6874 | 442 | 6.430026% |
| B | 6875 | 60 | 0.872727% |
| C | 6875 | 1430 | 20.800000% |
| D | 6875 | 239 | 3.476364% |
Noise dominated data is calculated using 1-second bins in cleaned event files. If a bin has >2000 counts, and if more than 50% of those come from <1% of pixels, then it is considered to be noise-dominated and hence unusable.
| Quadrant | # 1 sec bins | Bins with >0 counts | Bins with >2000 counts | High rate bins dominated by noise | Noise dominated (total time) | Noise dominated (detector-on time) | Marked lightcurve |
|---|---|---|---|---|---|---|---|
| A | 8684 | 6876 | 432 | 432 | 4.97% | 6.28% | 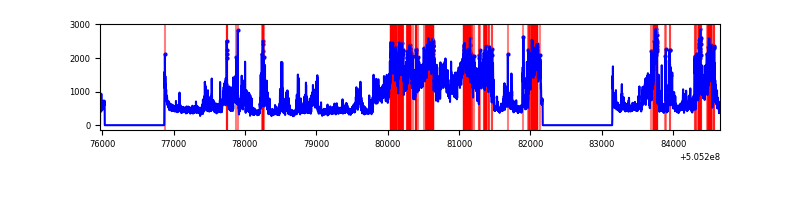 |
| B | 8685 | 6877 | 12 | 12 | 0.14% | 0.17% | 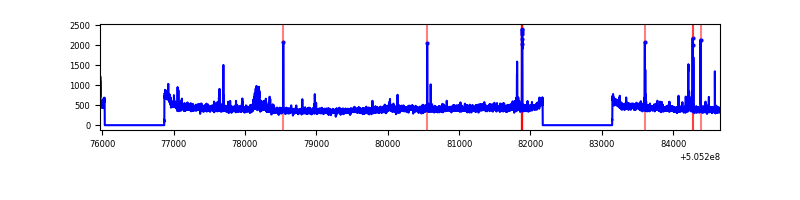 |
| C | 8685 | 6877 | 1485 | 1485 | 17.10% | 21.59% | 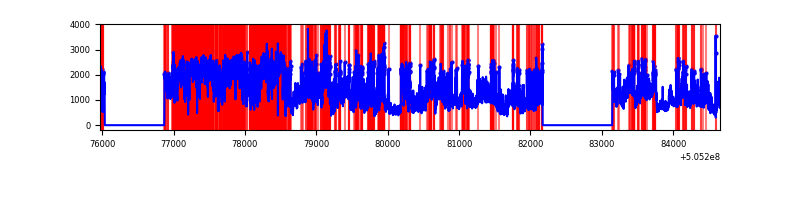 |
| D | 8685 | 6877 | 204 | 204 | 2.35% | 2.97% | 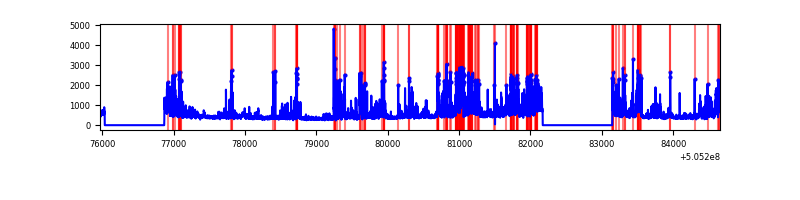 |
Top three noisy pixels from each quadrant. If the there are fewer than three noisy pixels in the level2.evt file, extra rows are filled as -1
| Pixel properties | Quadrant properties | ||||||
|---|---|---|---|---|---|---|---|
| Quadrant | DetID | PixID | Counts | Sigma | Mean | Median | Sigma |
| A | 12 | 115 | 3281699 | 18833.88 | 697 | 679 | 174.2 |
| A | 4 | 159 | 81685 | 464.99 | 697 | 679 | 174.2 |
| A | 15 | 32 | 58122 | 329.74 | 697 | 679 | 174.2 |
| B | 5 | 172 | 69524 | 456.26 | 702 | 674 | 150.9 |
| B | 7 | 252 | 24581 | 158.43 | 702 | 674 | 150.9 |
| B | 4 | 67 | 21290 | 136.62 | 702 | 674 | 150.9 |
| C | 9 | 38 | 7006207 | 39235.31 | 647 | 638 | 178.6 |
| C | 13 | 3 | 95114 | 529.12 | 647 | 638 | 178.6 |
| C | 12 | 252 | 87679 | 487.48 | 647 | 638 | 178.6 |
| D | 11 | 129 | 1290173 | 6766.01 | 672 | 643 | 190.6 |
| D | 8 | 245 | 143863 | 751.46 | 672 | 643 | 190.6 |
| D | 4 | 160 | 96409 | 502.47 | 672 | 643 | 190.6 |
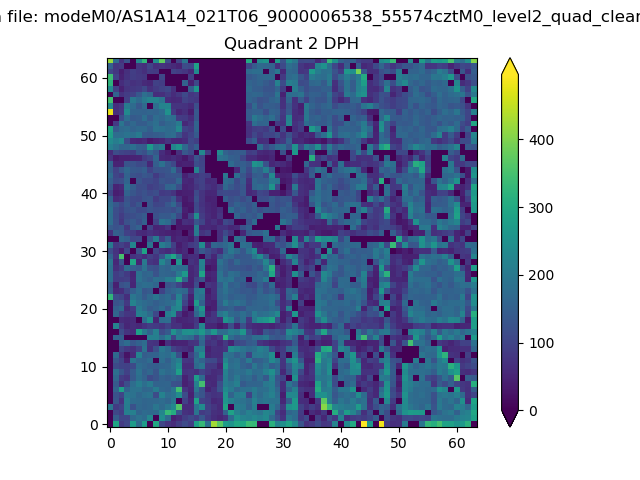
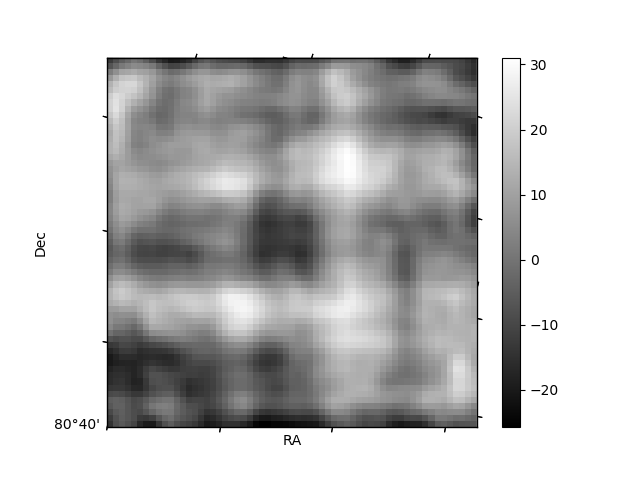
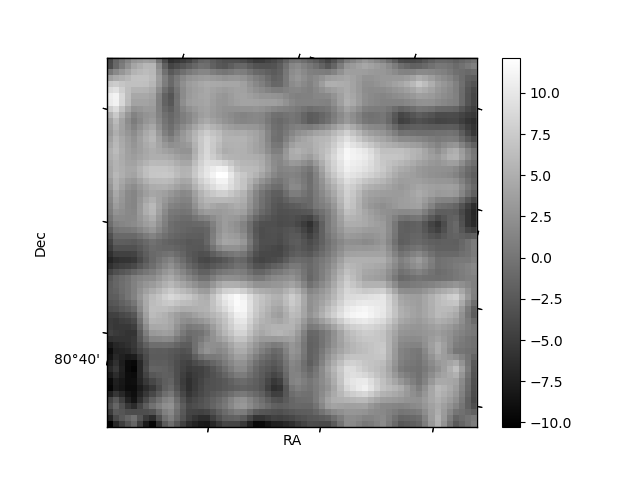
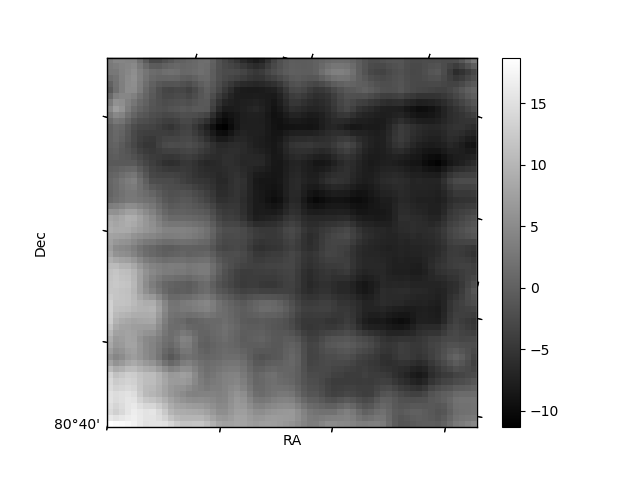
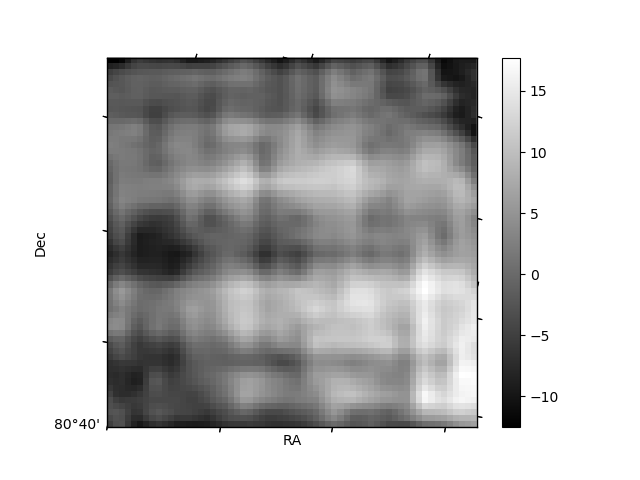
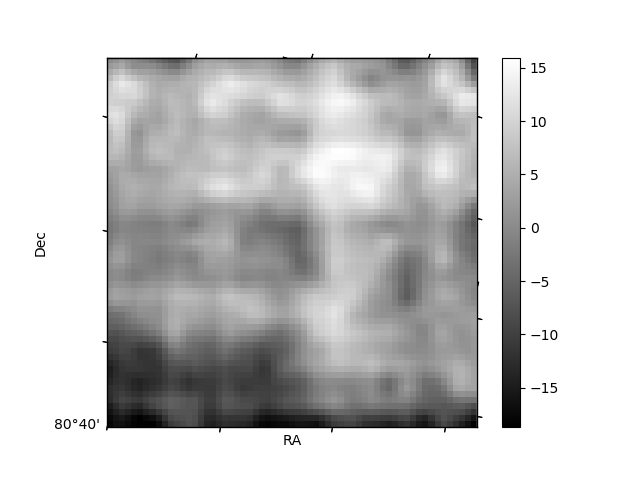
Histogram calculated using DETX and DETY for each event in the final _common_clean file
| Quadrant A | 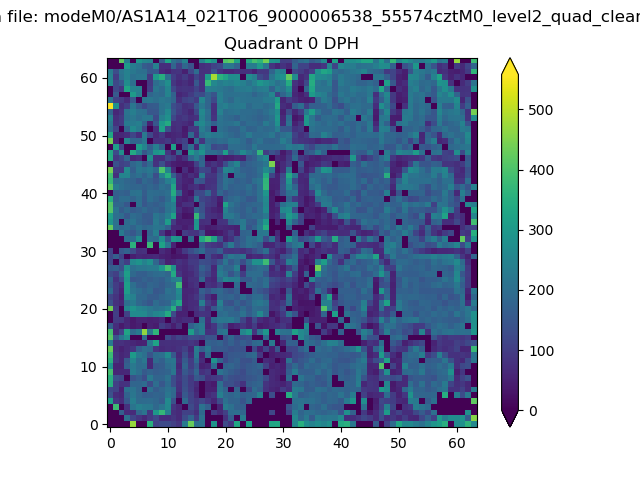 |
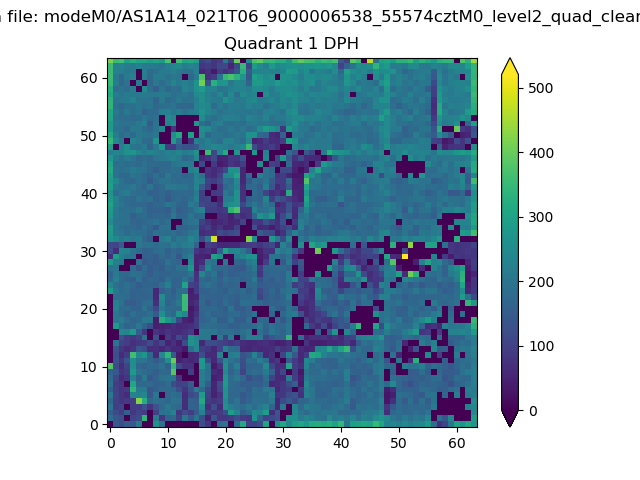 |
Quadrant B |
|---|---|---|---|
| Quadrant D | 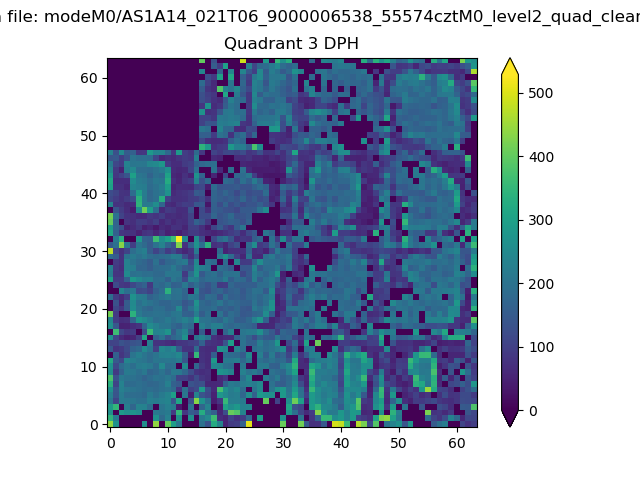 |
 |
Quadrant C |
| Plot type | Count rate plots | Images |
|---|---|---|
| Comparison with Poisson distribution Blue bars denote a histogram of data divided into 1 sec bins. Red curve is a Poisson curve with rate = median count rate of data. |
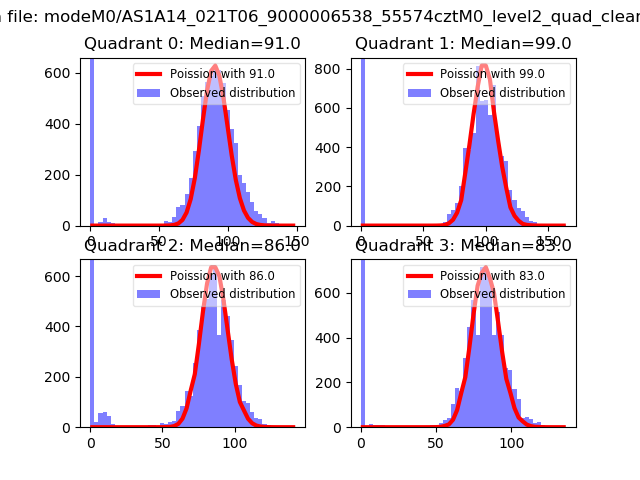 |
 |
| Quadrant-wise count rates Data is divided into 100 sec bins |
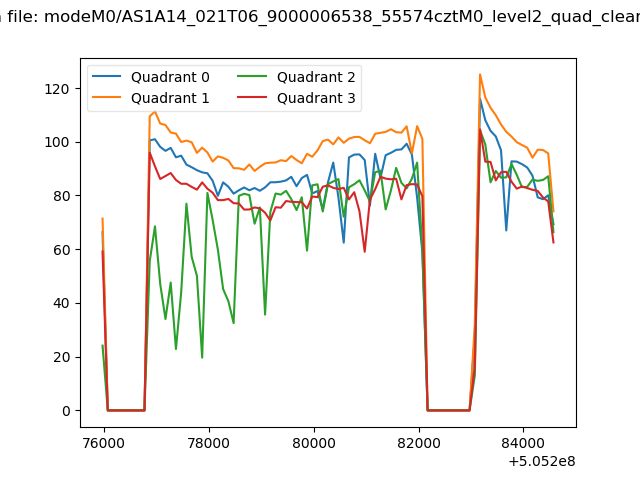 |
|
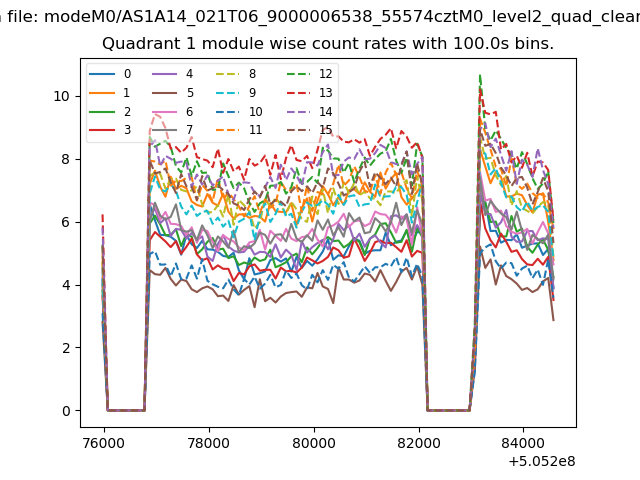
| Module-wise count rates for Quadrant A Data is divided into 100 sec bins |
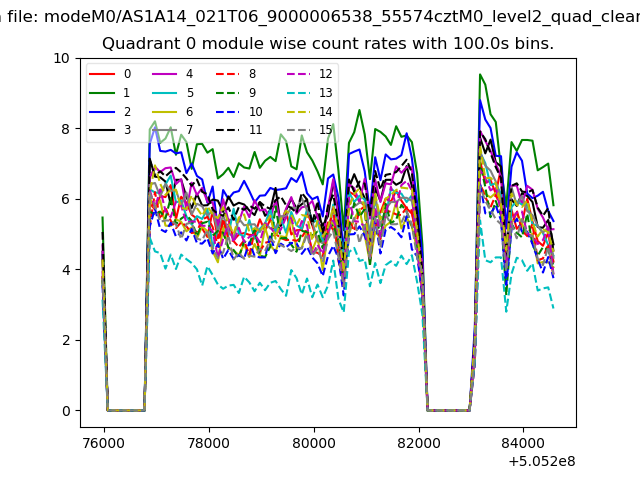 |
 |
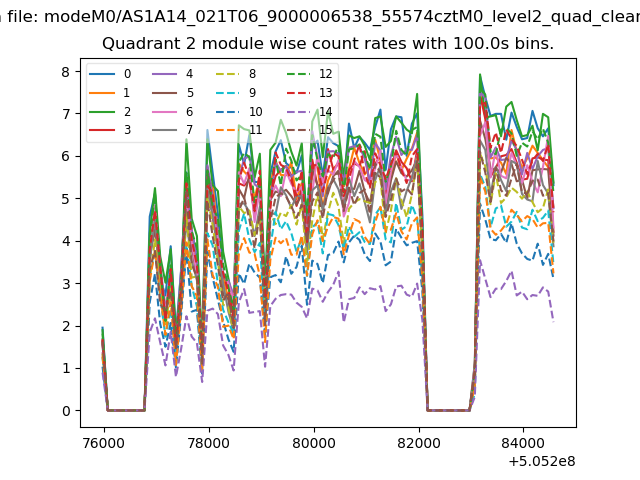
| Module-wise count rates for Quadrant B Data is divided into 100 sec bins |
 |
 |
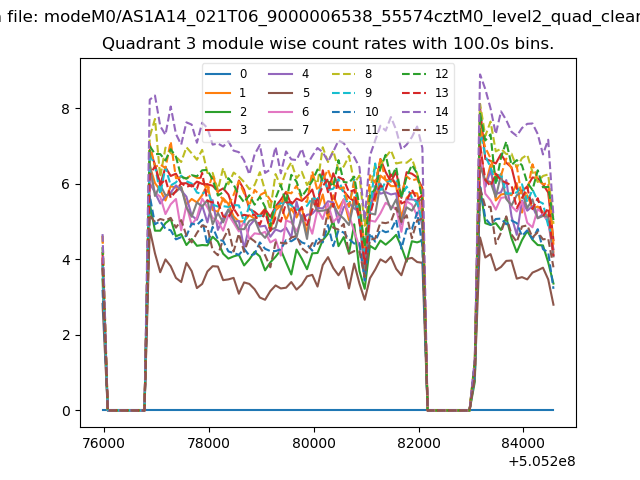
| Module-wise count rates for Quadrant C Data is divided into 100 sec bins |
 |
 |
| Module-wise count rates for Quadrant D Data is divided into 100 sec bins |
 |
 |
| Parameter | Plot |
|---|---|
| CZT HV Monitor | 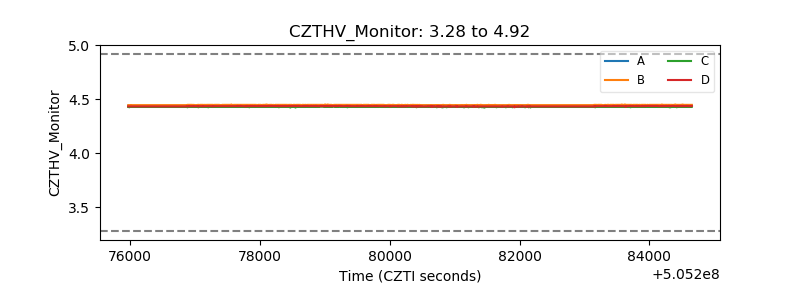 |
| D_VDD | 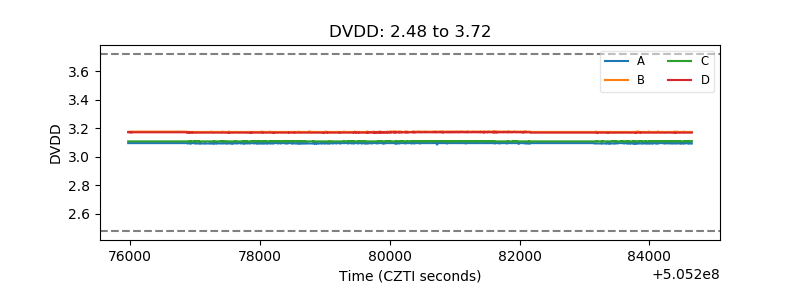 |
| Temperature 1 | 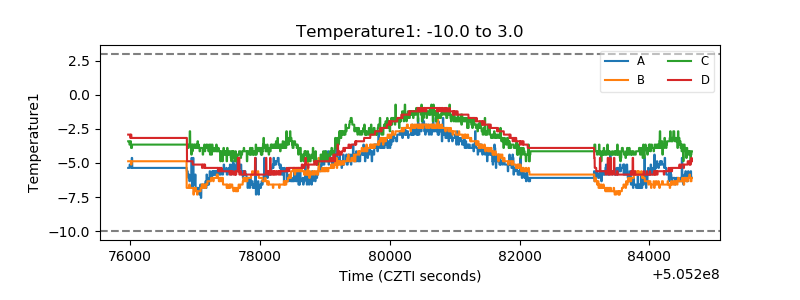 |
| Veto HV Monitor | 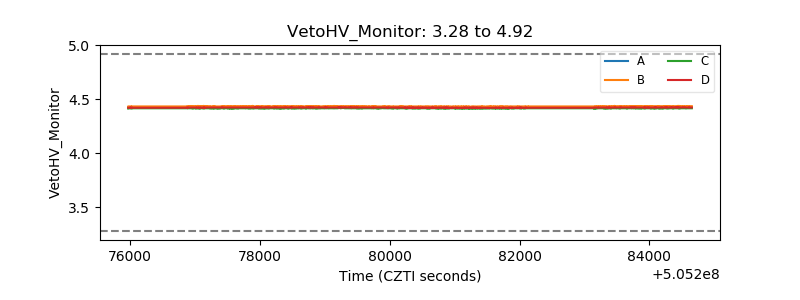 |
| Veto LLD | 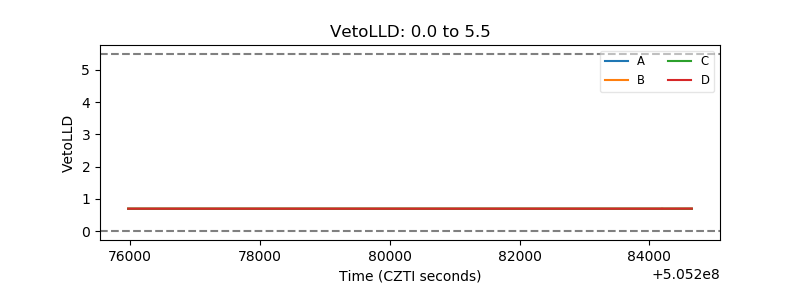 |
| Alpha Counter | 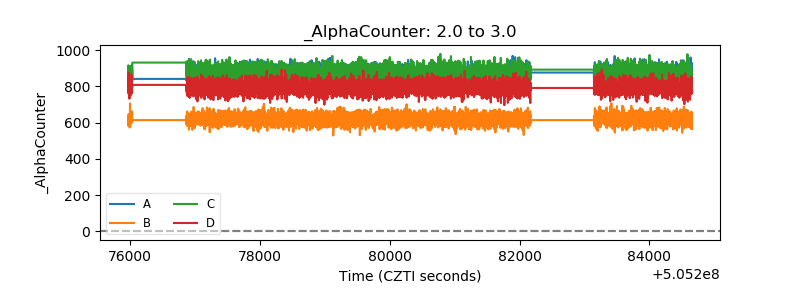 |
| _CPM_Rate | 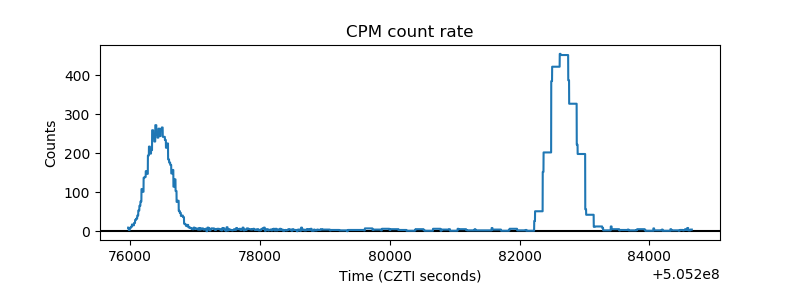 |
| CZT Counter | 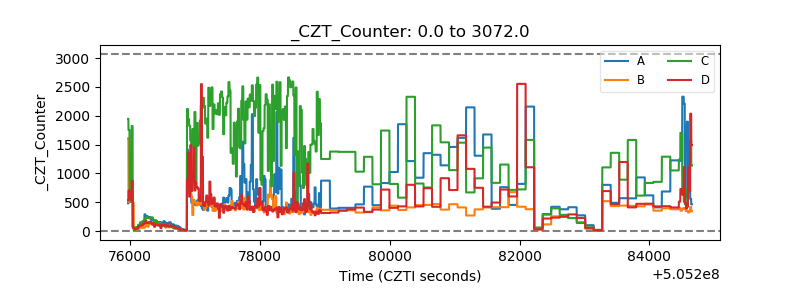 |
| +2.5 Volts monitor |  |
| +5 Volts monitor |  |
| _ROLL_ROT | 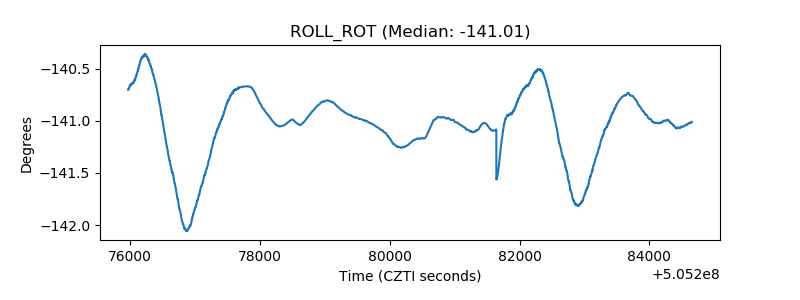 |
| _Roll_DEC | 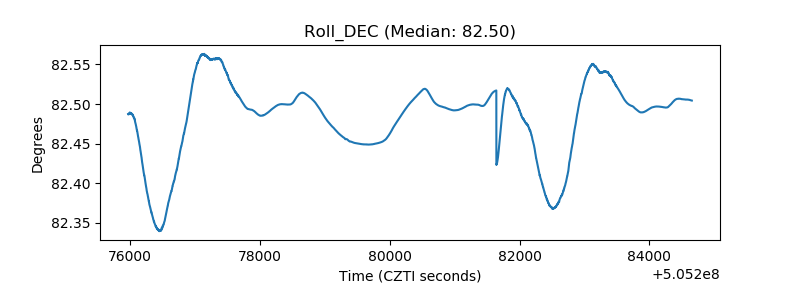 |
| _Roll_RA | 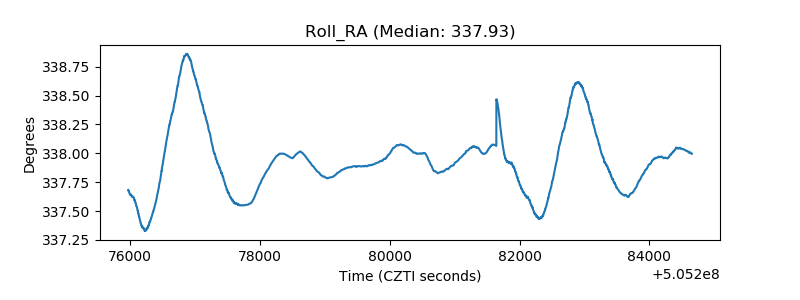 |
| Veto Counter | 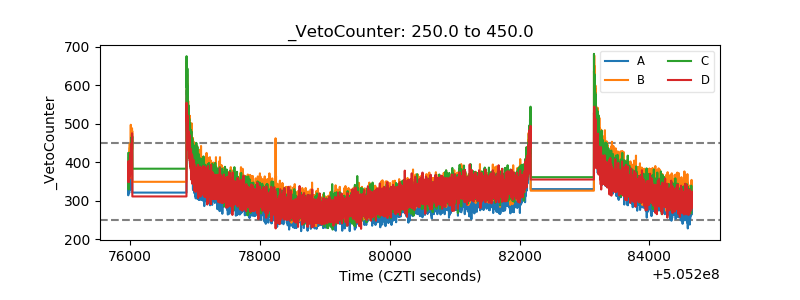 |