| Param | Original file | Final file |
|---|---|---|
| Filename | modeM0/AS1A14_021T06_9000006538_55575cztM0_level2.fits | modeM0/AS1A14_021T06_9000006538_55575cztM0_level2_quad_clean.evt |
| Size (bytes) | 519,583,680 | 84,591,360 |
| Size | 495.5 MB | 80.7 MB |
| Events in quadrant A | 4,110,421 | 553,706 |
| Events in quadrant B | 2,580,152 | 606,255 |
| Events in quadrant C | 7,331,513 | 493,795 |
| Events in quadrant D | 4,744,989 | 487,390 |
| Mode M9 | |||
|---|---|---|---|
| Quadrant | BADHDUFLAG | Total packets | Discarded packets |
| A | 0 | 11 | 0 |
| B | 0 | 11 | 0 |
| C | 0 | 11 | 0 |
| D | 0 | 11 | 0 |
| Mode M0 | |||
|---|---|---|---|
| Quadrant | BADHDUFLAG | Total packets | Discarded packets |
| A | 0 | 16377 | 1 |
| B | 0 | 12398 | 1 |
| C | 0 | 26052 | 1 |
| D | 0 | 18387 | 1 |
| Mode SS | |||
|---|---|---|---|
| Quadrant | BADHDUFLAG | Total packets | Discarded packets |
| A | 0 | 122 | 0 |
| B | 0 | 122 | 0 |
| C | 0 | 122 | 0 |
| D | 0 | 122 | 0 |
| Quadrant | Total seconds | Saturated seconds | Saturation percentage |
|---|---|---|---|
| A | 6016 | 195 | 3.241356% |
| B | 6017 | 54 | 0.897457% |
| C | 6017 | 656 | 10.902443% |
| D | 6017 | 304 | 5.052352% |
Noise dominated data is calculated using 1-second bins in cleaned event files. If a bin has >2000 counts, and if more than 50% of those come from <1% of pixels, then it is considered to be noise-dominated and hence unusable.
| Quadrant | # 1 sec bins | Bins with >0 counts | Bins with >2000 counts | High rate bins dominated by noise | Noise dominated (total time) | Noise dominated (detector-on time) | Marked lightcurve |
|---|---|---|---|---|---|---|---|
| A | 7116 | 6018 | 186 | 186 | 2.61% | 3.09% | 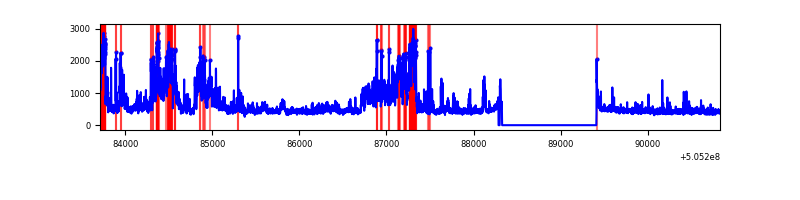 |
| B | 7117 | 6019 | 11 | 11 | 0.15% | 0.18% | 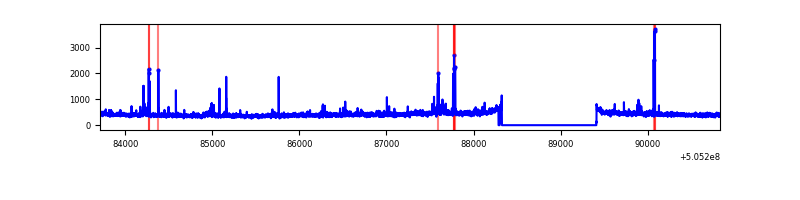 |
| C | 7117 | 6019 | 863 | 863 | 12.13% | 14.34% | 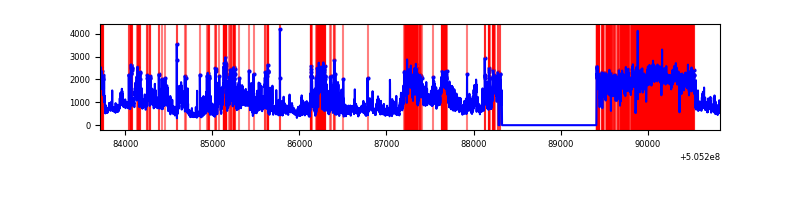 |
| D | 7117 | 6019 | 322 | 322 | 4.52% | 5.35% | 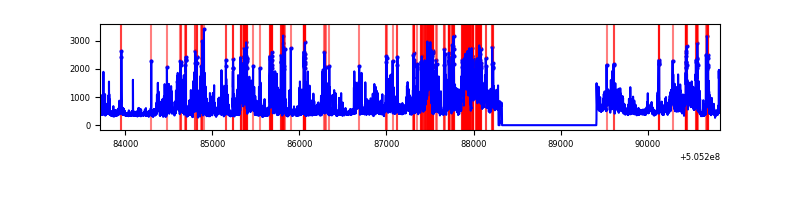 |
Top three noisy pixels from each quadrant. If the there are fewer than three noisy pixels in the level2.evt file, extra rows are filled as -1
| Pixel properties | Quadrant properties | ||||||
|---|---|---|---|---|---|---|---|
| Quadrant | DetID | PixID | Counts | Sigma | Mean | Median | Sigma |
| A | 12 | 115 | 1347533 | 8895.91 | 611 | 597 | 151.4 |
| A | 0 | 8 | 148384 | 976.07 | 611 | 597 | 151.4 |
| A | 15 | 32 | 139708 | 918.77 | 611 | 597 | 151.4 |
| B | 4 | 169 | 38030 | 290.33 | 607 | 585 | 129.0 |
| B | 4 | 67 | 33490 | 255.13 | 607 | 585 | 129.0 |
| B | 5 | 172 | 31681 | 241.1 | 607 | 585 | 129.0 |
| C | 9 | 38 | 4899568 | 31393.93 | 574 | 567 | 156.0 |
| C | 15 | 200 | 48707 | 308.49 | 574 | 567 | 156.0 |
| C | 12 | 252 | 39729 | 250.96 | 574 | 567 | 156.0 |
| D | 11 | 129 | 2285289 | 13706.59 | 582 | 554 | 166.7 |
| D | 2 | 249 | 51428 | 305.2 | 582 | 554 | 166.7 |
| D | 5 | 173 | 47888 | 283.97 | 582 | 554 | 166.7 |
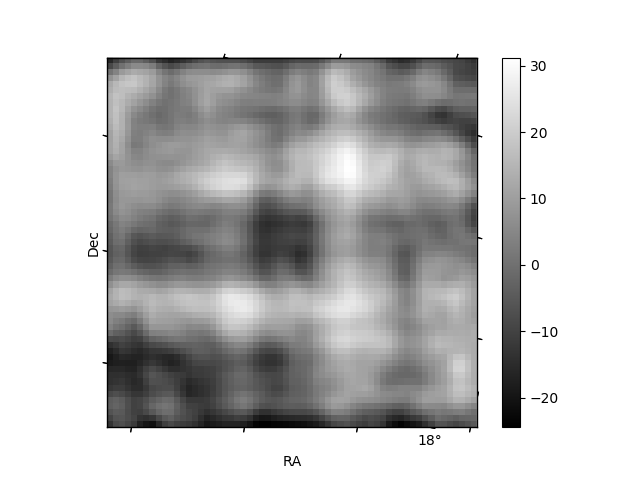
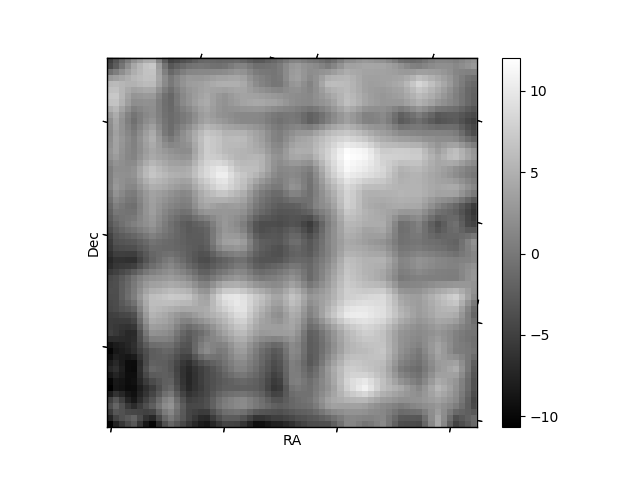
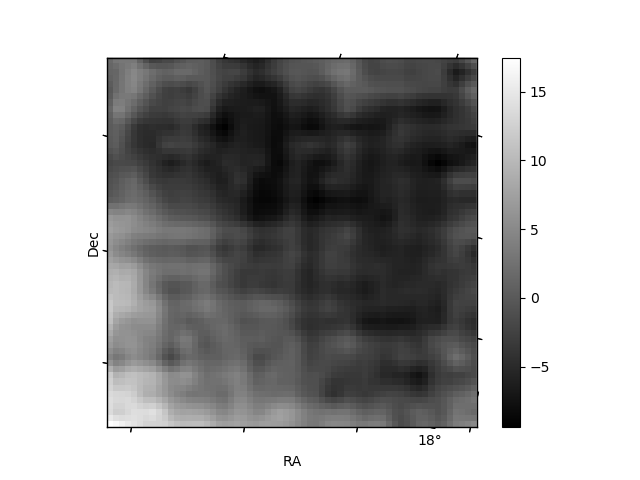
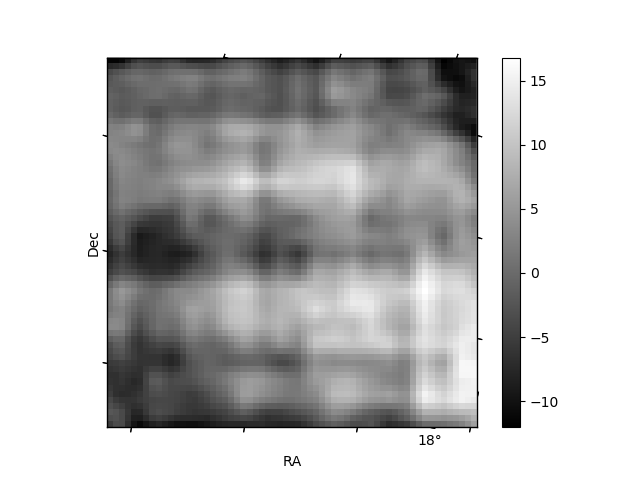
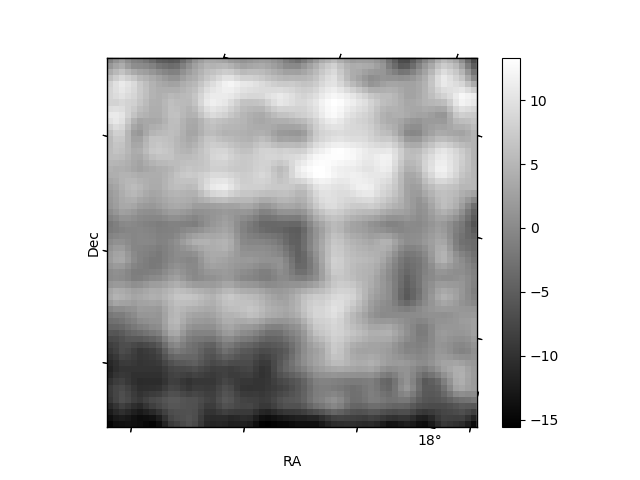
Histogram calculated using DETX and DETY for each event in the final _common_clean file
| Quadrant A | 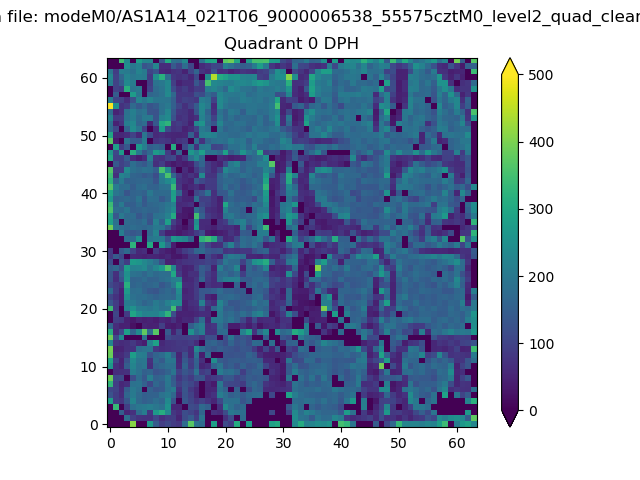 |
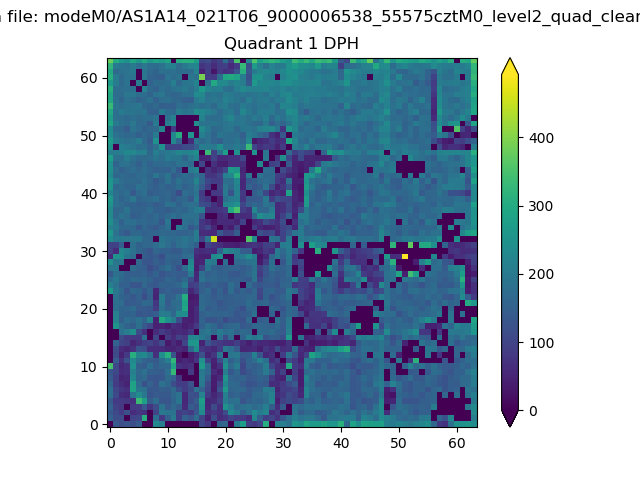 |
Quadrant B |
|---|---|---|---|
| Quadrant D | 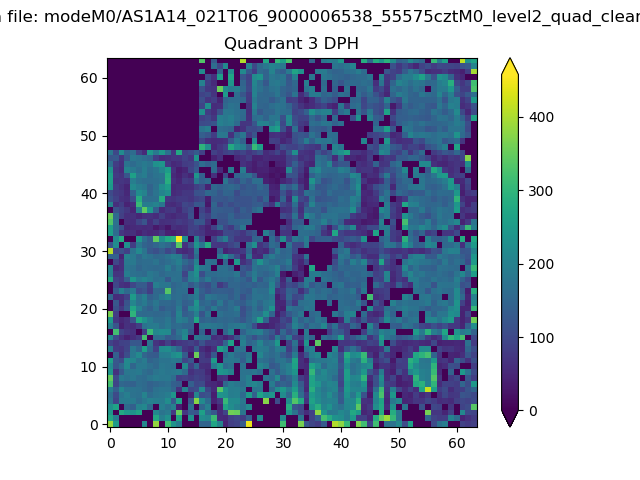 |
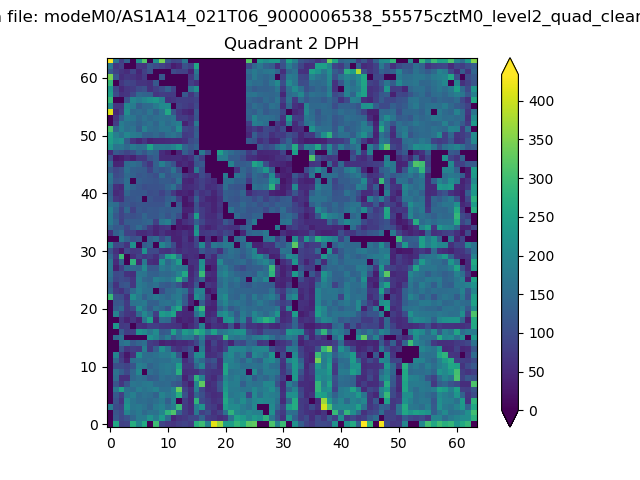 |
Quadrant C |
| Plot type | Count rate plots | Images |
|---|---|---|
| Comparison with Poisson distribution Blue bars denote a histogram of data divided into 1 sec bins. Red curve is a Poisson curve with rate = median count rate of data. |
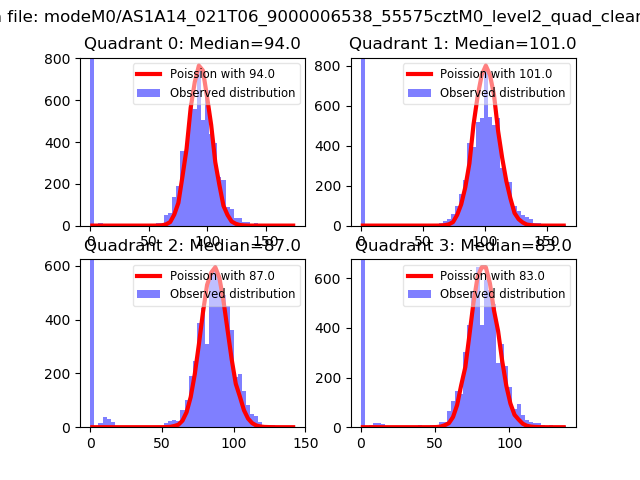 |
 |
| Quadrant-wise count rates Data is divided into 100 sec bins |
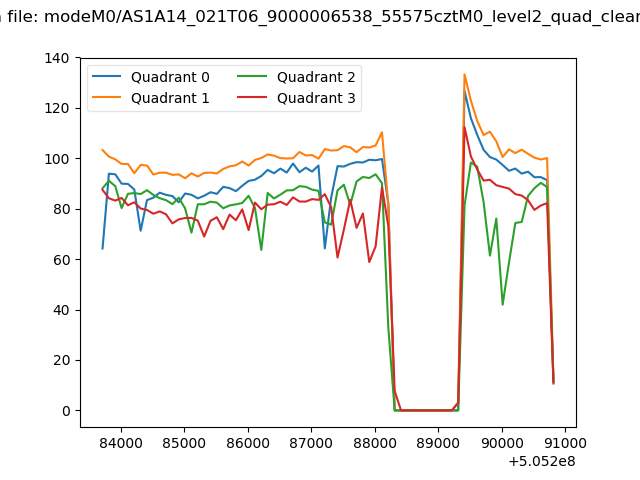 |
|
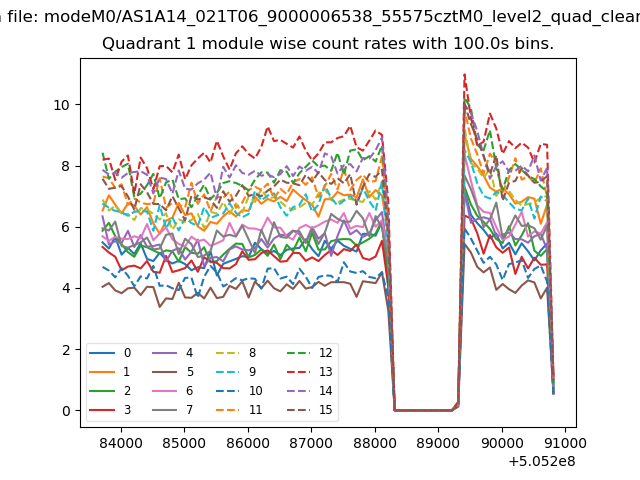
| Module-wise count rates for Quadrant A Data is divided into 100 sec bins |
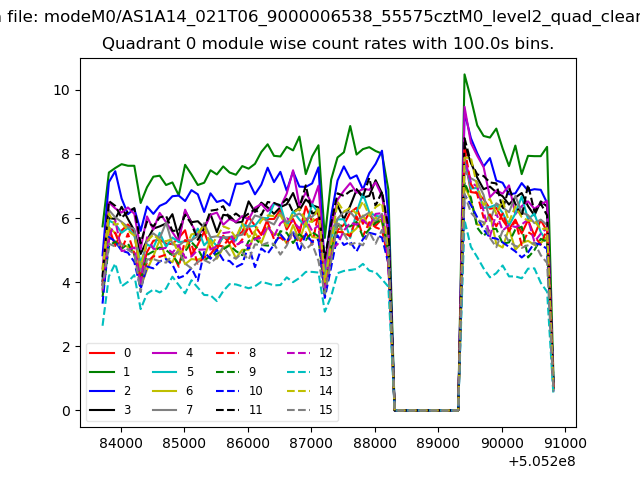 |
 |
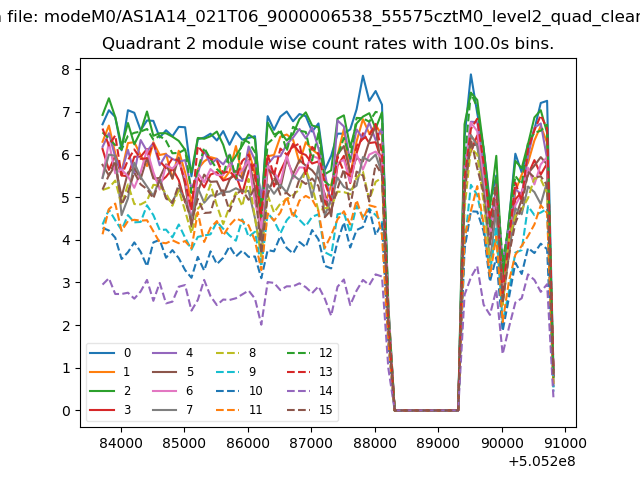
| Module-wise count rates for Quadrant B Data is divided into 100 sec bins |
 |
 |
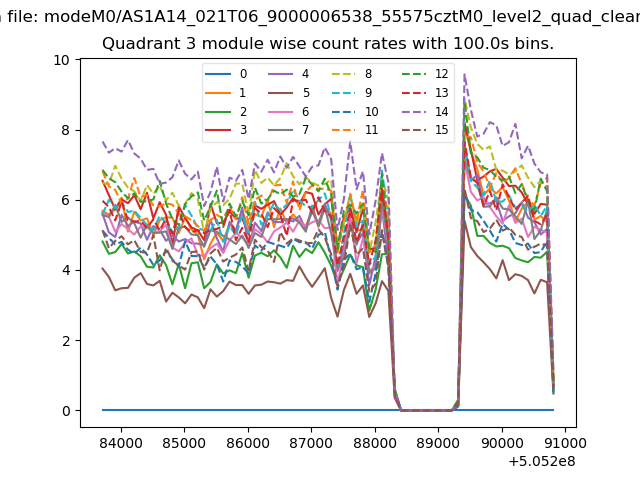
| Module-wise count rates for Quadrant C Data is divided into 100 sec bins |
 |
 |
| Module-wise count rates for Quadrant D Data is divided into 100 sec bins |
 |
 |
| Parameter | Plot |
|---|---|
| CZT HV Monitor | 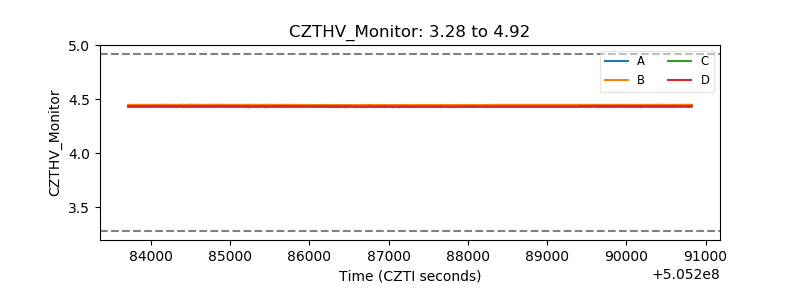 |
| D_VDD | 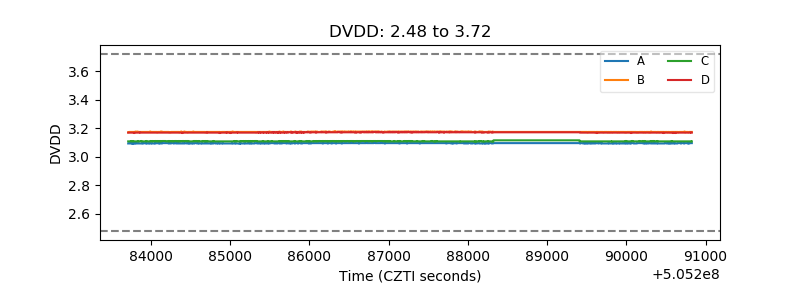 |
| Temperature 1 | 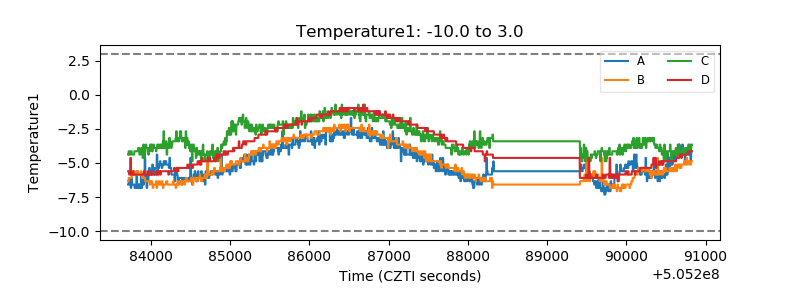 |
| Veto HV Monitor | 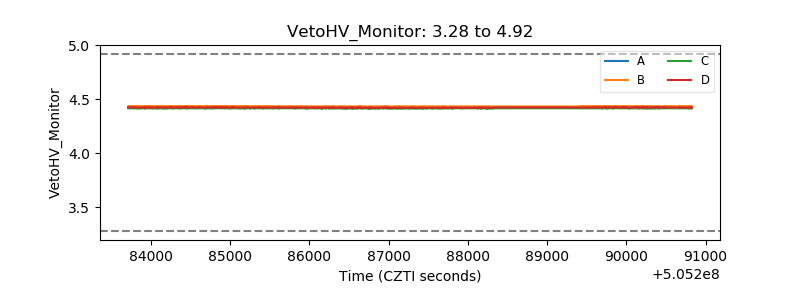 |
| Veto LLD | 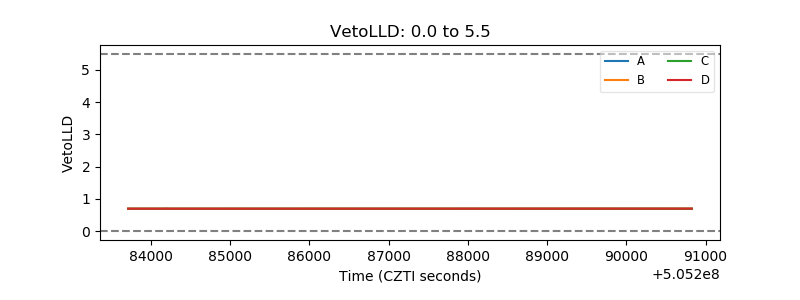 |
| Alpha Counter | 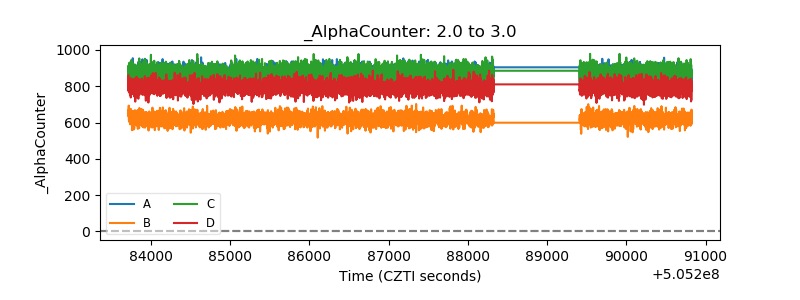 |
| _CPM_Rate | 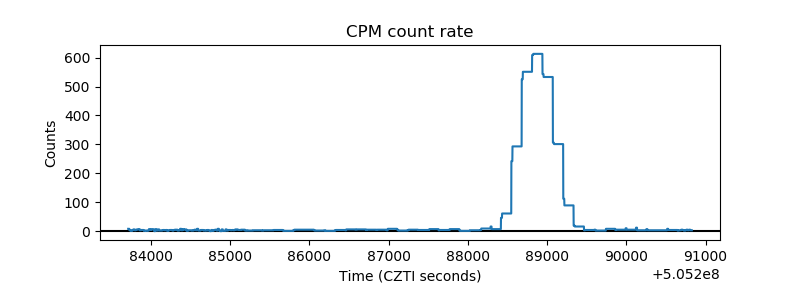 |
| CZT Counter | 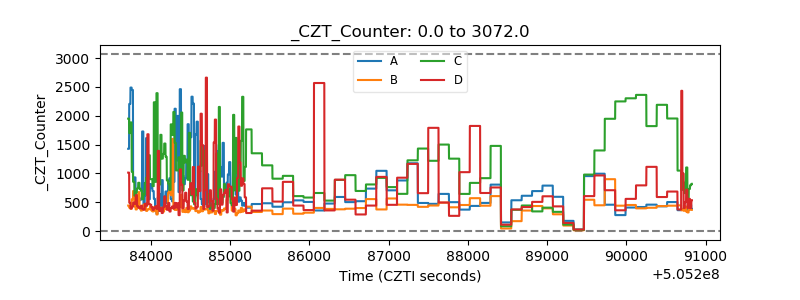 |
| +2.5 Volts monitor | 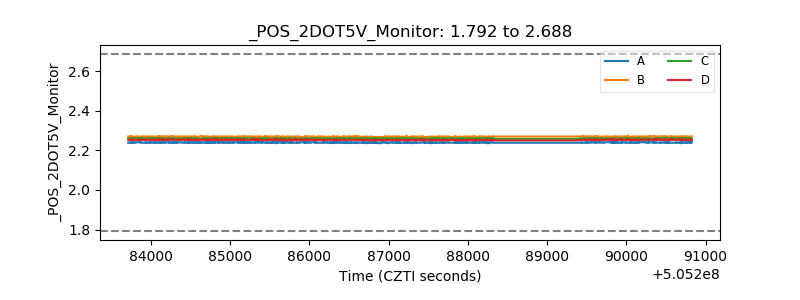 |
| +5 Volts monitor | 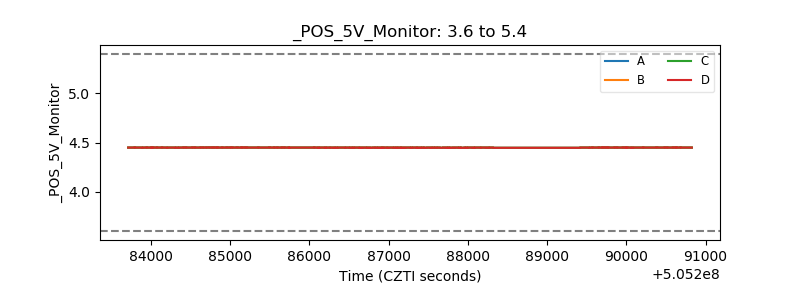 |
| _ROLL_ROT | 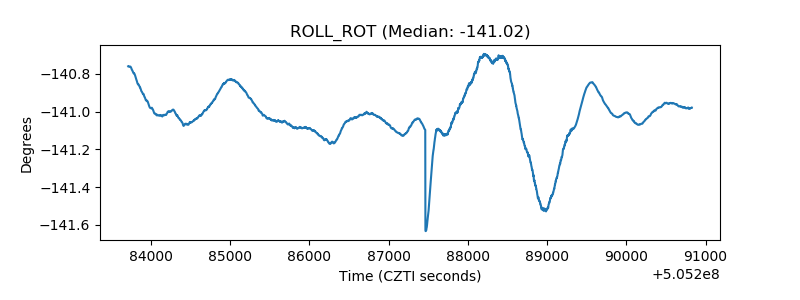 |
| _Roll_DEC | 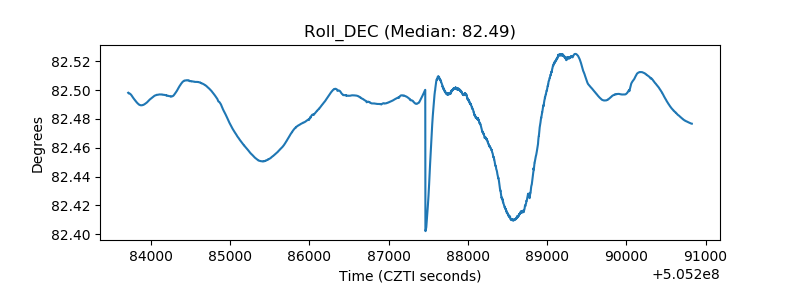 |
| _Roll_RA | 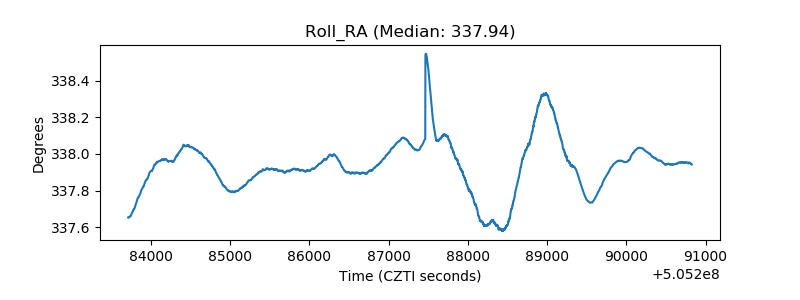 |
| Veto Counter | 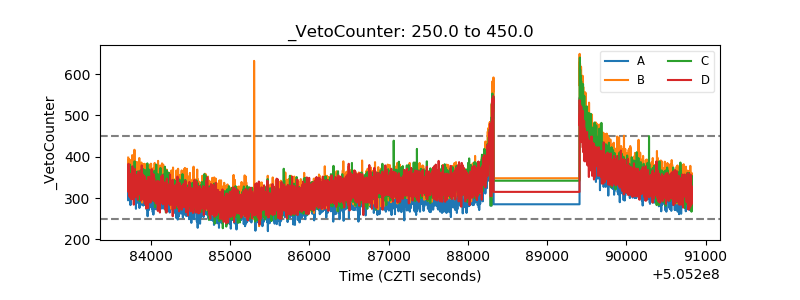 |