| Param | Original file | Final file |
|---|---|---|
| Filename | modeM0/AS1A14_021T06_9000006538_55578cztM0_level2.fits | modeM0/AS1A14_021T06_9000006538_55578cztM0_level2_quad_clean.evt |
| Size (bytes) | 546,788,160 | 85,553,280 |
| Size | 521.5 MB | 81.6 MB |
| Events in quadrant A | 5,800,234 | 544,553 |
| Events in quadrant B | 2,713,563 | 642,902 |
| Events in quadrant C | 7,009,624 | 448,819 |
| Events in quadrant D | 4,232,689 | 519,183 |
| Mode M9 | |||
|---|---|---|---|
| Quadrant | BADHDUFLAG | Total packets | Discarded packets |
| A | 0 | 10 | 0 |
| B | 0 | 10 | 0 |
| C | 0 | 10 | 0 |
| D | 0 | 10 | 0 |
| Mode M0 | |||
|---|---|---|---|
| Quadrant | BADHDUFLAG | Total packets | Discarded packets |
| A | 0 | 21595 | 6 |
| B | 0 | 12816 | 2 |
| C | 0 | 25317 | 44 |
| D | 0 | 16997 | 2 |
| Mode SS | |||
|---|---|---|---|
| Quadrant | BADHDUFLAG | Total packets | Discarded packets |
| A | 0 | 126 | 0 |
| B | 0 | 126 | 0 |
| C | 0 | 126 | 0 |
| D | 0 | 126 | 0 |
| Quadrant | Total seconds | Saturated seconds | Saturation percentage |
|---|---|---|---|
| A | 6236 | 739 | 11.850545% |
| B | 6237 | 68 | 1.090268% |
| C | 6228 | 1447 | 23.233783% |
| D | 6238 | 247 | 3.959602% |
Noise dominated data is calculated using 1-second bins in cleaned event files. If a bin has >2000 counts, and if more than 50% of those come from <1% of pixels, then it is considered to be noise-dominated and hence unusable.
| Quadrant | # 1 sec bins | Bins with >0 counts | Bins with >2000 counts | High rate bins dominated by noise | Noise dominated (total time) | Noise dominated (detector-on time) | Marked lightcurve |
|---|---|---|---|---|---|---|---|
| A | 7272 | 6239 | 715 | 715 | 9.83% | 11.46% | 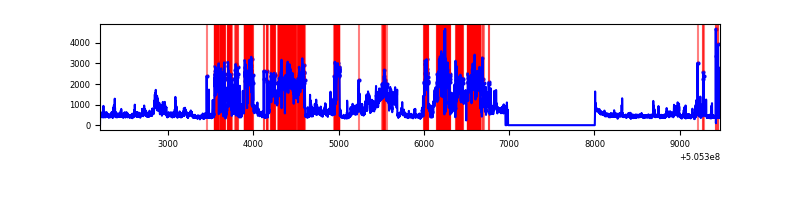 |
| B | 7272 | 6239 | 0 | 0 | 0.00% | 0.00% | 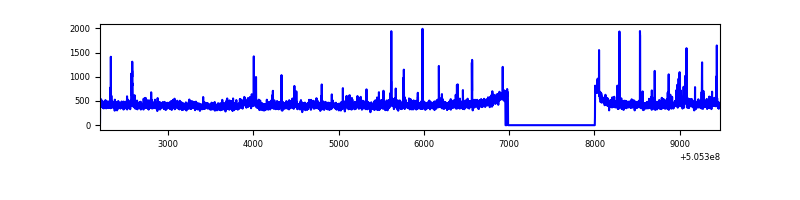 |
| C | 7272 | 6235 | 1225 | 1225 | 16.85% | 19.65% | 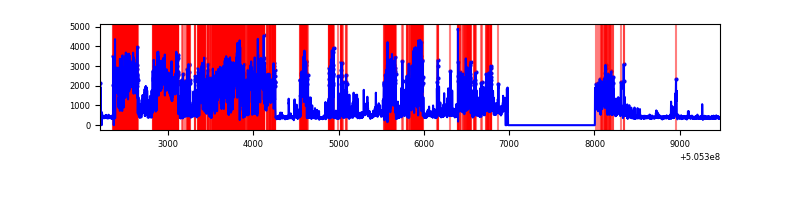 |
| D | 7273 | 6240 | 166 | 166 | 2.28% | 2.66% | 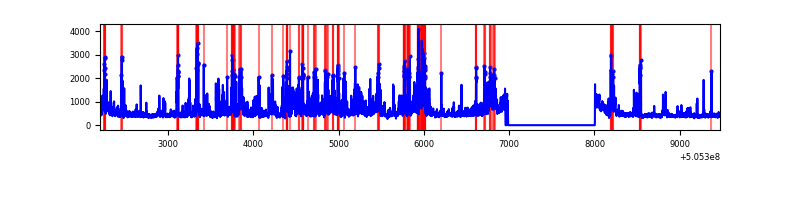 |
Top three noisy pixels from each quadrant. If the there are fewer than three noisy pixels in the level2.evt file, extra rows are filled as -1
| Pixel properties | Quadrant properties | ||||||
|---|---|---|---|---|---|---|---|
| Quadrant | DetID | PixID | Counts | Sigma | Mean | Median | Sigma |
| A | 15 | 32 | 2517242 | 15944.13 | 631 | 614 | 157.8 |
| A | 12 | 115 | 612258 | 3875.08 | 631 | 614 | 157.8 |
| A | 0 | 8 | 126434 | 797.13 | 631 | 614 | 157.8 |
| B | 7 | 0 | 61715 | 448.75 | 639 | 616 | 136.2 |
| B | 4 | 169 | 46124 | 334.24 | 639 | 616 | 136.2 |
| B | 10 | 247 | 19329 | 137.44 | 639 | 616 | 136.2 |
| C | 9 | 38 | 4393180 | 27958.31 | 565 | 557 | 157.1 |
| C | 6 | 223 | 124623 | 789.66 | 565 | 557 | 157.1 |
| C | 13 | 3 | 103771 | 656.94 | 565 | 557 | 157.1 |
| D | 11 | 129 | 1240461 | 7057.34 | 621 | 593 | 175.7 |
| D | 2 | 62 | 206208 | 1170.36 | 621 | 593 | 175.7 |
| D | 2 | 153 | 172006 | 975.68 | 621 | 593 | 175.7 |
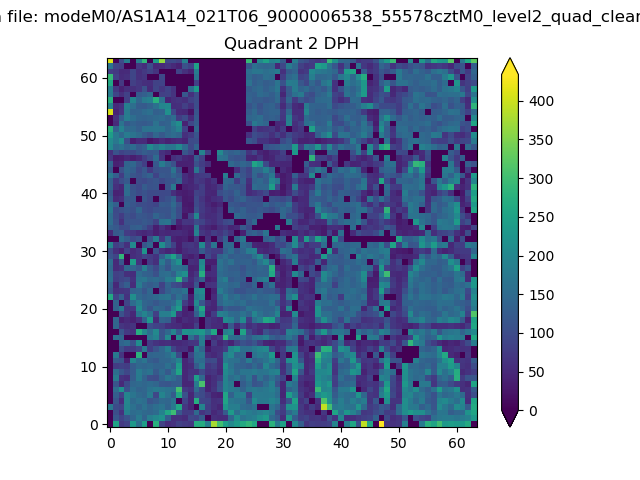
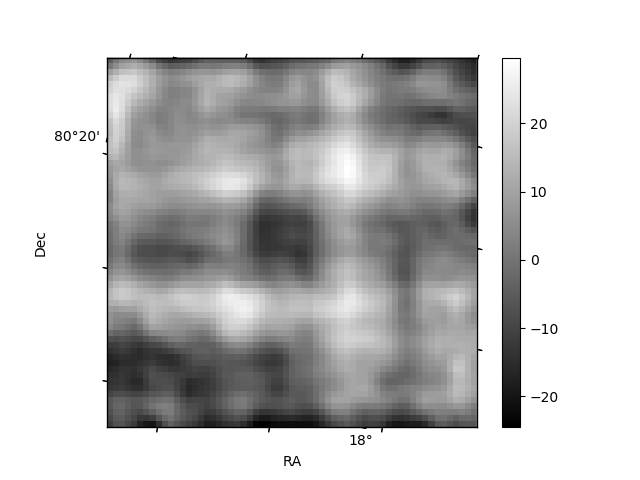
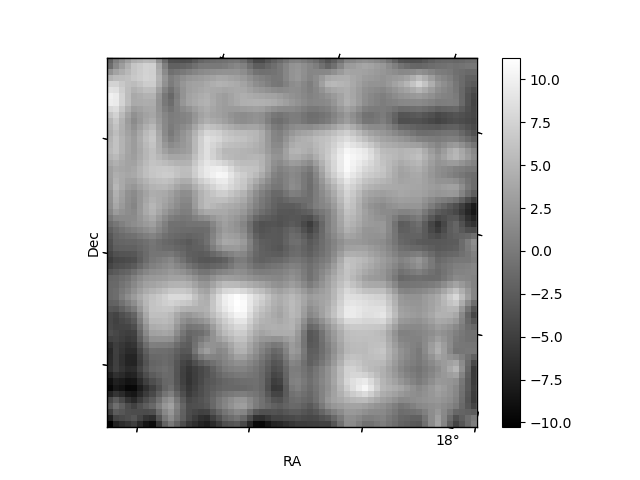
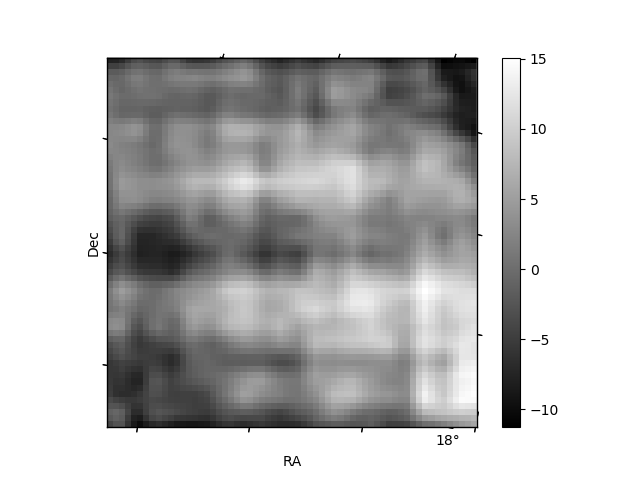
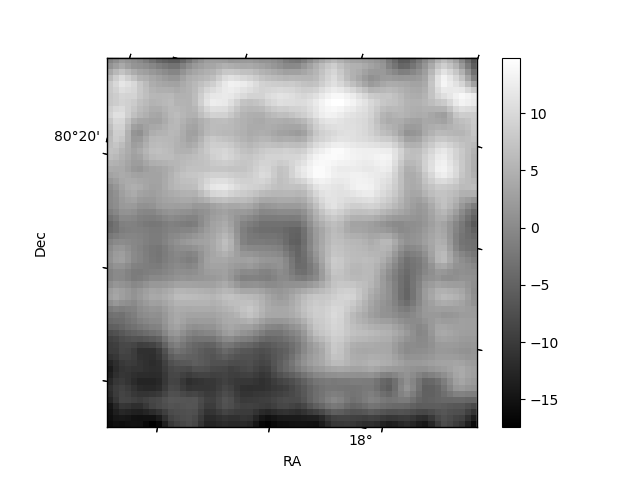
Histogram calculated using DETX and DETY for each event in the final _common_clean file
| Quadrant A | 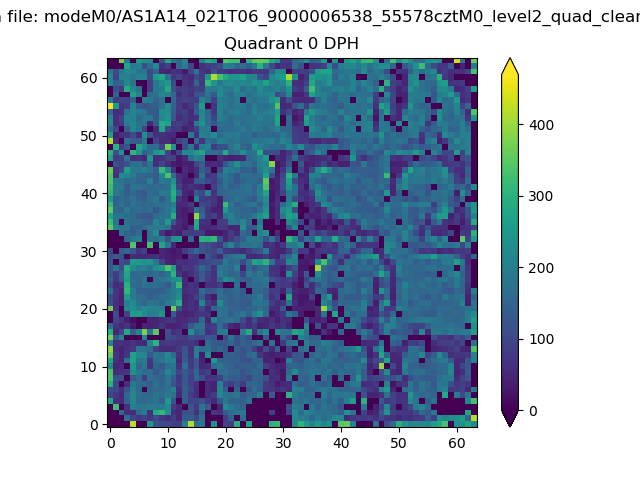 |
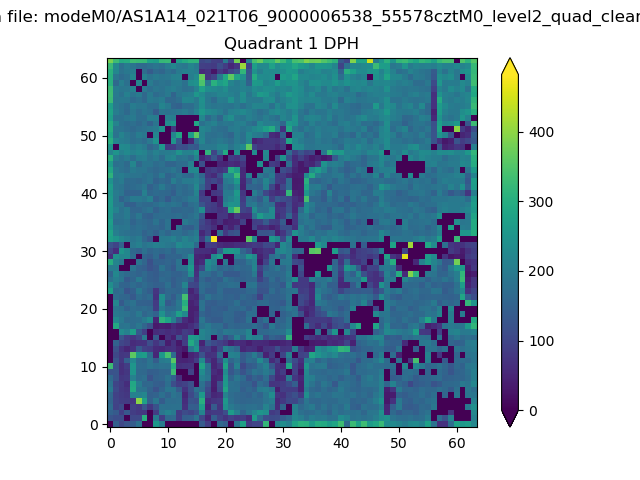 |
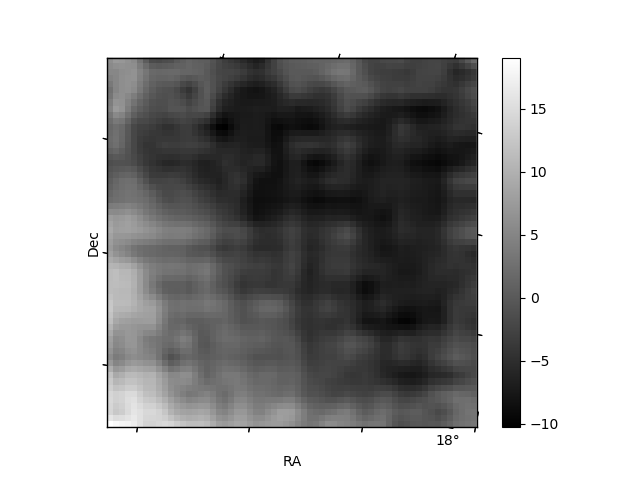
Quadrant B |
|---|---|---|---|
| Quadrant D | 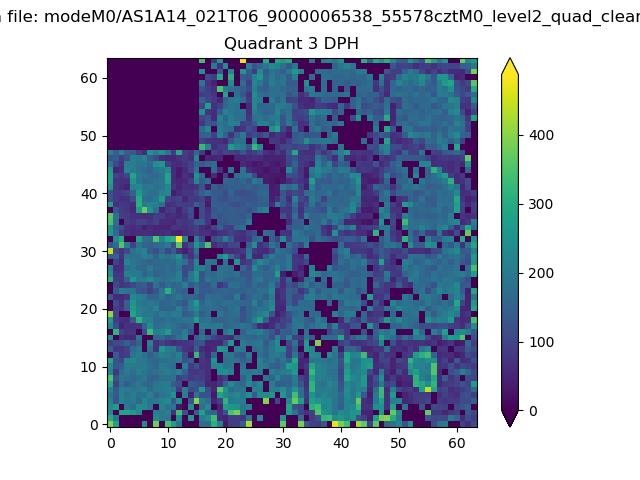 |
 |
Quadrant C |
| Plot type | Count rate plots | Images |
|---|---|---|
| Comparison with Poisson distribution Blue bars denote a histogram of data divided into 1 sec bins. Red curve is a Poisson curve with rate = median count rate of data. |
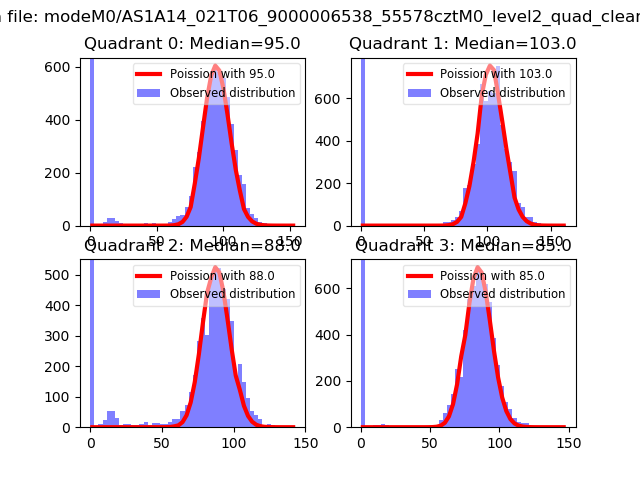 |
 |
| Quadrant-wise count rates Data is divided into 100 sec bins |
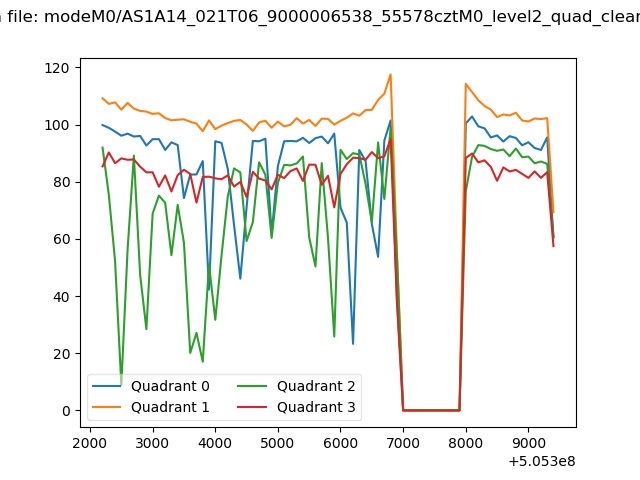 |
|
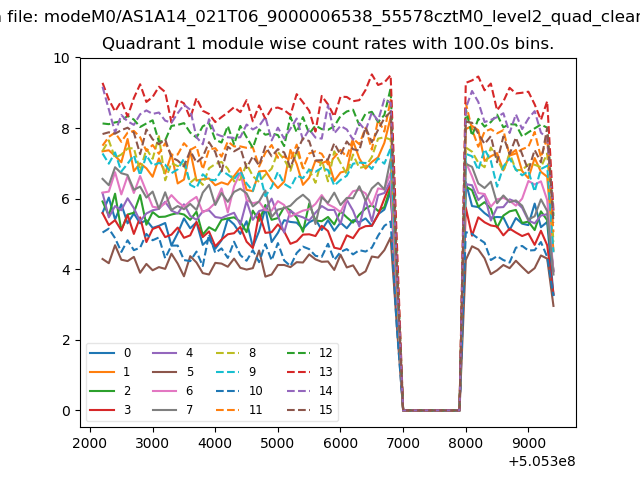
| Module-wise count rates for Quadrant A Data is divided into 100 sec bins |
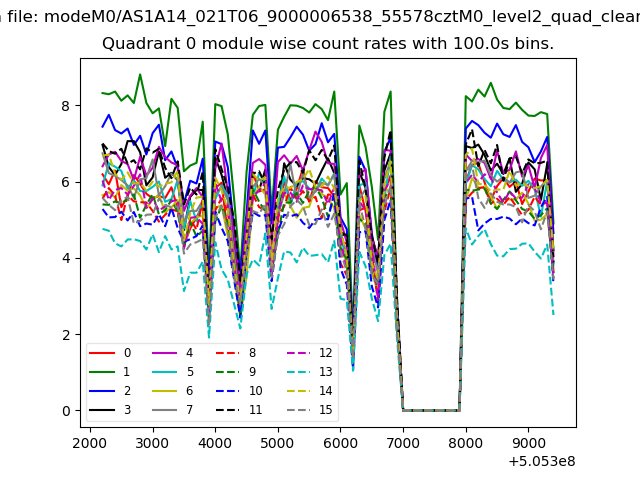 |
 |
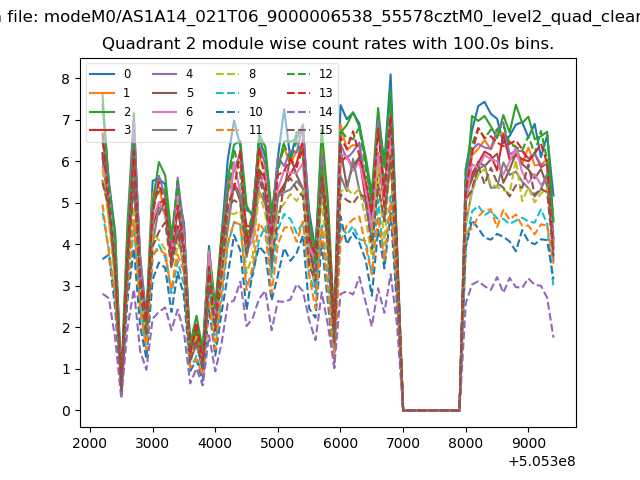
| Module-wise count rates for Quadrant B Data is divided into 100 sec bins |
 |
 |
| Module-wise count rates for Quadrant C Data is divided into 100 sec bins |
 |
 |
| Module-wise count rates for Quadrant D Data is divided into 100 sec bins |
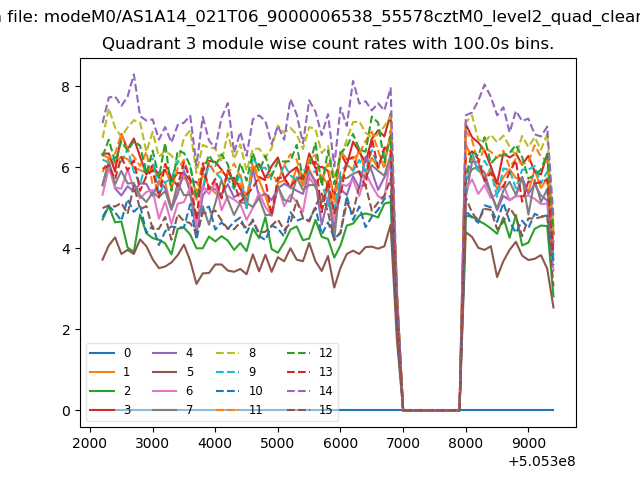 |
 |
| Parameter | Plot |
|---|---|
| CZT HV Monitor | 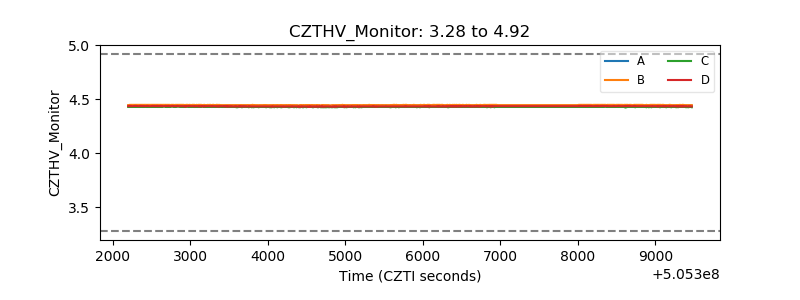 |
| D_VDD | 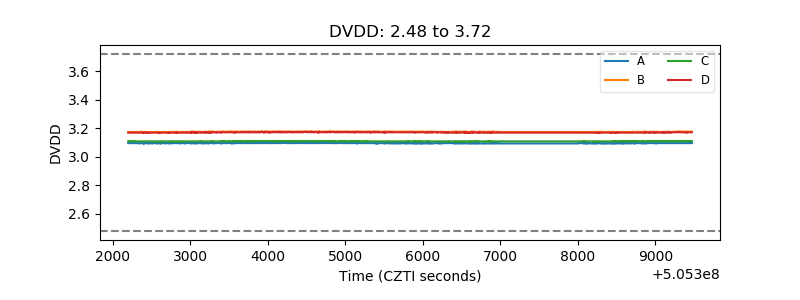 |
| Temperature 1 | 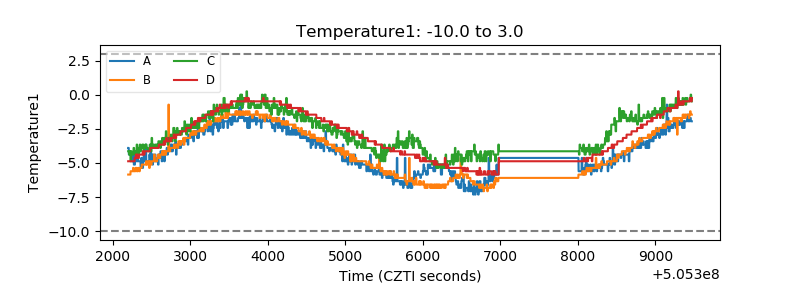 |
| Veto HV Monitor | 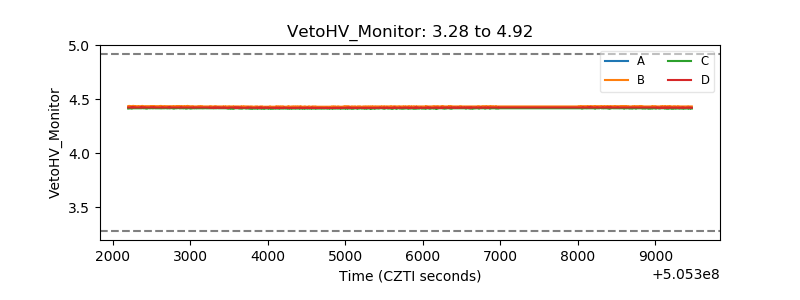 |
| Veto LLD | 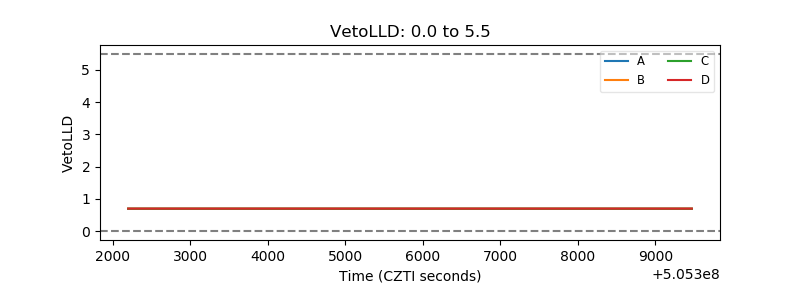 |
| Alpha Counter | 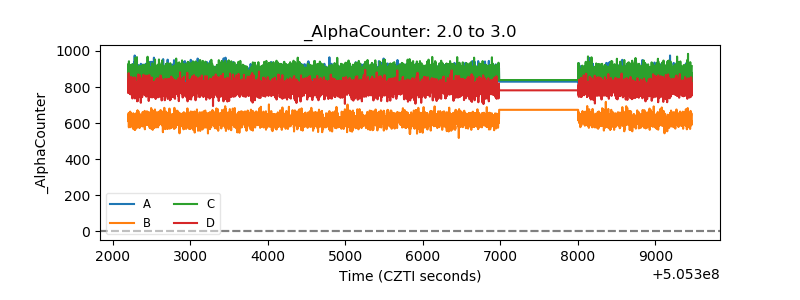 |
| _CPM_Rate | 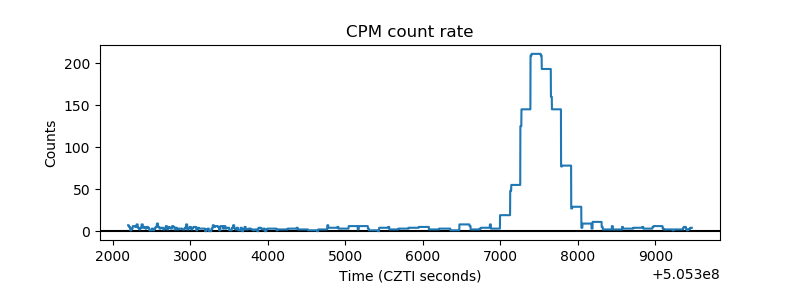 |
| CZT Counter | 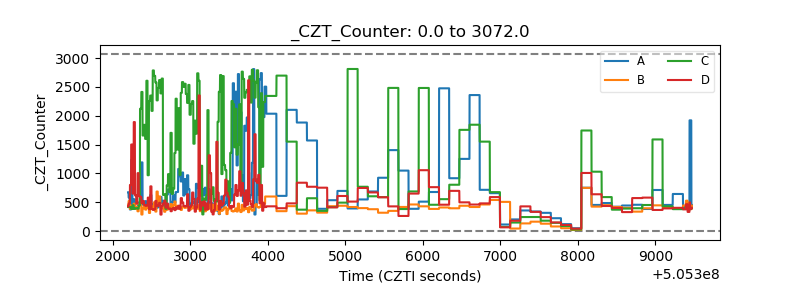 |
| +2.5 Volts monitor | 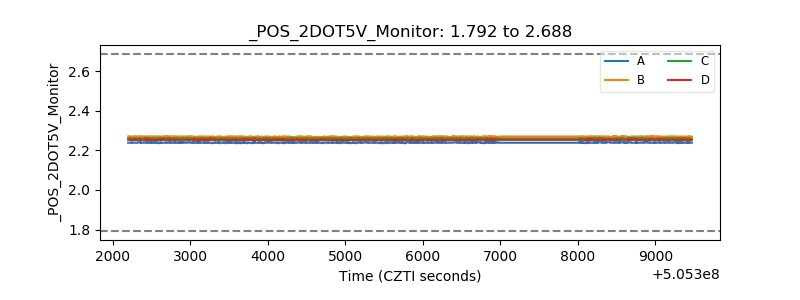 |
| +5 Volts monitor | 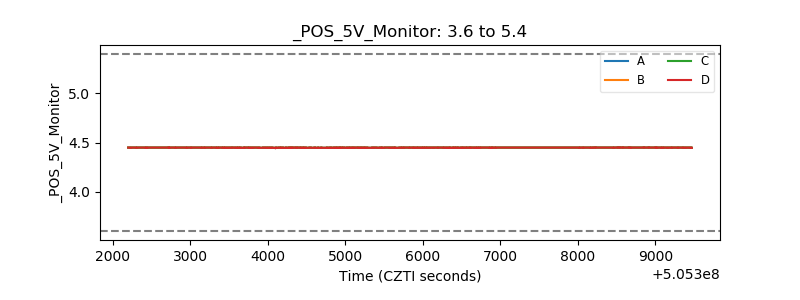 |
| _ROLL_ROT | 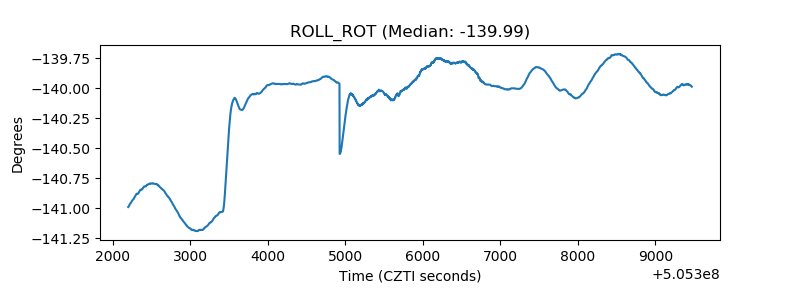 |
| _Roll_DEC | 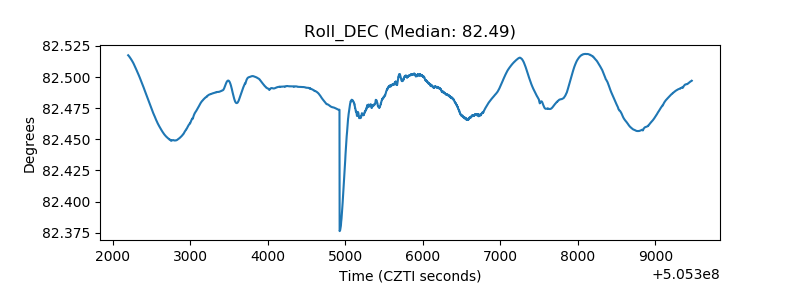 |
| _Roll_RA | 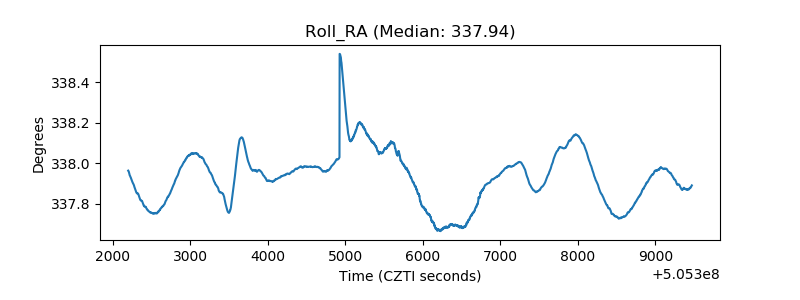 |
| Veto Counter | 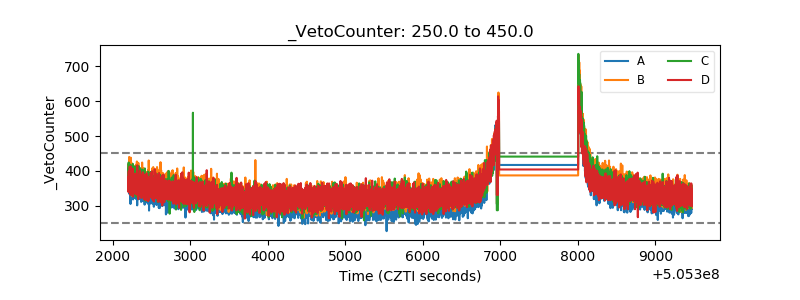 |