| Param | Original file | Final file |
|---|---|---|
| Filename | modeM0/AS1A14_021T06_9000006538_55580cztM0_level2.fits | modeM0/AS1A14_021T06_9000006538_55580cztM0_level2_quad_clean.evt |
| Size (bytes) | 510,874,560 | 100,284,480 |
| Size | 487.2 MB | 95.6 MB |
| Events in quadrant A | 6,167,518 | 635,425 |
| Events in quadrant B | 3,290,573 | 713,563 |
| Events in quadrant C | 3,615,561 | 619,688 |
| Events in quadrant D | 5,281,072 | 568,352 |
| Mode M9 | |||
|---|---|---|---|
| Quadrant | BADHDUFLAG | Total packets | Discarded packets |
| A | 0 | 3 | 0 |
| B | 0 | 3 | 0 |
| C | 0 | 3 | 0 |
| D | 0 | 3 | 0 |
| Mode M0 | |||
|---|---|---|---|
| Quadrant | BADHDUFLAG | Total packets | Discarded packets |
| A | 0 | 23379 | 2 |
| B | 0 | 15135 | 2 |
| C | 0 | 16222 | 2 |
| D | 0 | 20829 | 2 |
| Mode SS | |||
|---|---|---|---|
| Quadrant | BADHDUFLAG | Total packets | Discarded packets |
| A | 0 | 148 | 0 |
| B | 0 | 148 | 0 |
| C | 0 | 148 | 0 |
| D | 0 | 148 | 0 |
| Quadrant | Total seconds | Saturated seconds | Saturation percentage |
|---|---|---|---|
| A | 7159 | 521 | 7.277553% |
| B | 7160 | 78 | 1.089385% |
| C | 7160 | 167 | 2.332402% |
| D | 7160 | 495 | 6.913408% |
Noise dominated data is calculated using 1-second bins in cleaned event files. If a bin has >2000 counts, and if more than 50% of those come from <1% of pixels, then it is considered to be noise-dominated and hence unusable.
| Quadrant | # 1 sec bins | Bins with >0 counts | Bins with >2000 counts | High rate bins dominated by noise | Noise dominated (total time) | Noise dominated (detector-on time) | Marked lightcurve |
|---|---|---|---|---|---|---|---|
| A | 7559 | 7161 | 435 | 435 | 5.75% | 6.07% | 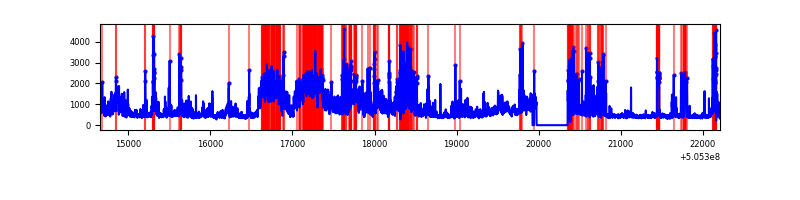 |
| B | 7560 | 7162 | 12 | 12 | 0.16% | 0.17% | 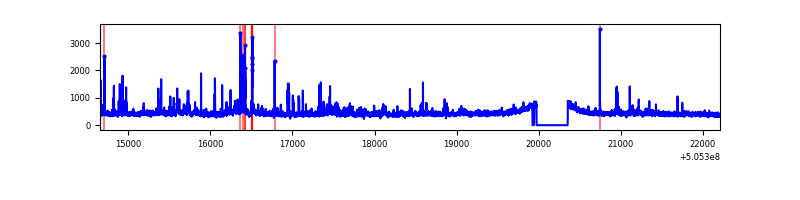 |
| C | 7560 | 7162 | 100 | 100 | 1.32% | 1.40% | 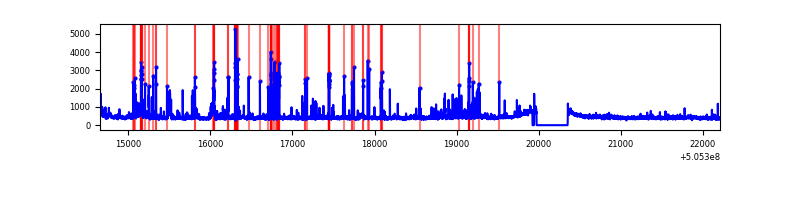 |
| D | 7560 | 7162 | 375 | 375 | 4.96% | 5.24% | 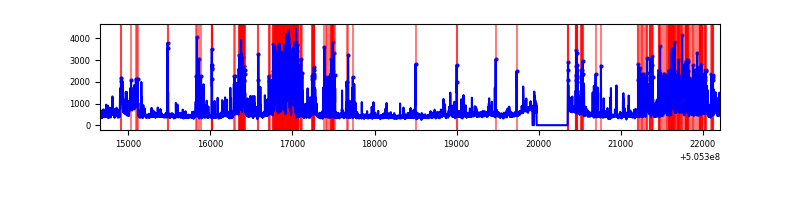 |
Top three noisy pixels from each quadrant. If the there are fewer than three noisy pixels in the level2.evt file, extra rows are filled as -1
| Pixel properties | Quadrant properties | ||||||
|---|---|---|---|---|---|---|---|
| Quadrant | DetID | PixID | Counts | Sigma | Mean | Median | Sigma |
| A | 15 | 32 | 1573715 | 8794.68 | 722 | 704 | 178.9 |
| A | 12 | 115 | 1559857 | 8717.2 | 722 | 704 | 178.9 |
| A | 0 | 8 | 126668 | 704.26 | 722 | 704 | 178.9 |
| B | 4 | 169 | 90181 | 576.87 | 728 | 702 | 155.1 |
| B | 10 | 247 | 88616 | 566.78 | 728 | 702 | 155.1 |
| B | 0 | 199 | 78783 | 503.39 | 728 | 702 | 155.1 |
| C | 9 | 38 | 500260 | 2546.13 | 715 | 705 | 196.2 |
| C | 12 | 252 | 82750 | 418.17 | 715 | 705 | 196.2 |
| C | 12 | 250 | 68751 | 346.81 | 715 | 705 | 196.2 |
| D | 15 | 125 | 1161062 | 5754.11 | 706 | 671 | 201.7 |
| D | 11 | 129 | 669619 | 3317.16 | 706 | 671 | 201.7 |
| D | 2 | 249 | 139218 | 687.02 | 706 | 671 | 201.7 |
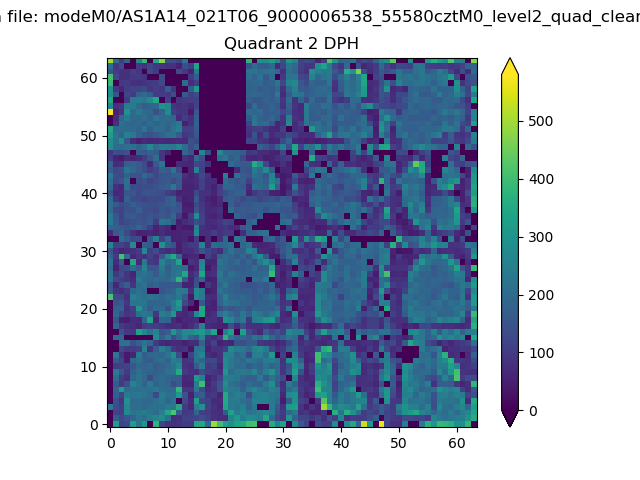
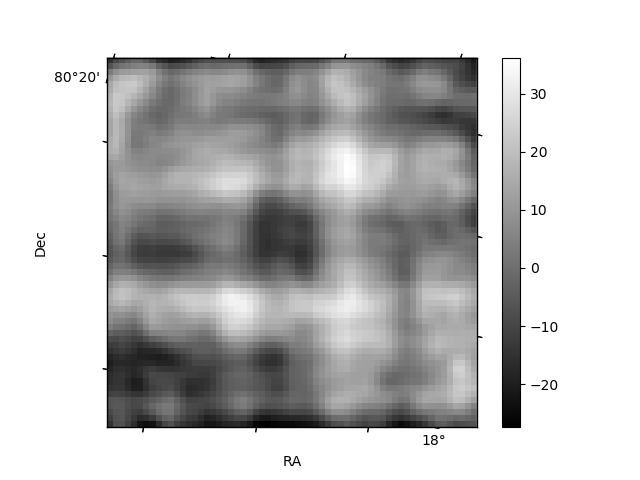
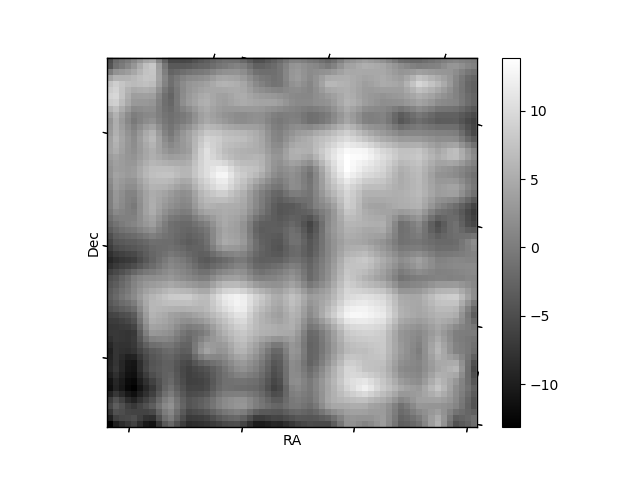
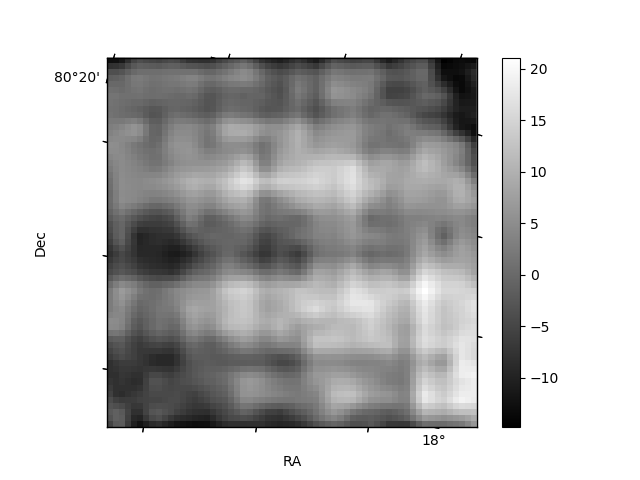
Histogram calculated using DETX and DETY for each event in the final _common_clean file
| Quadrant A | 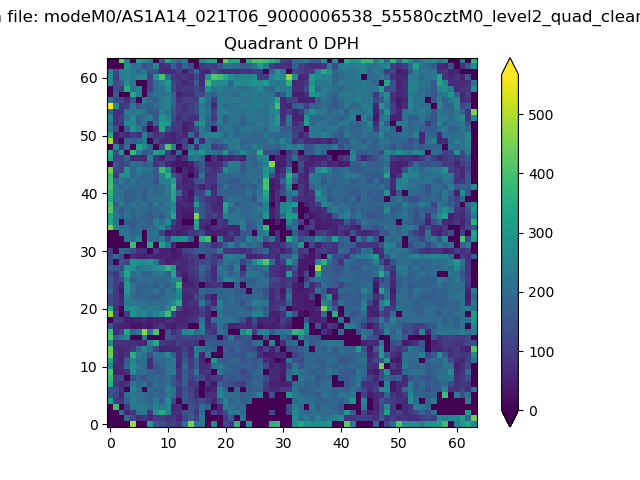 |
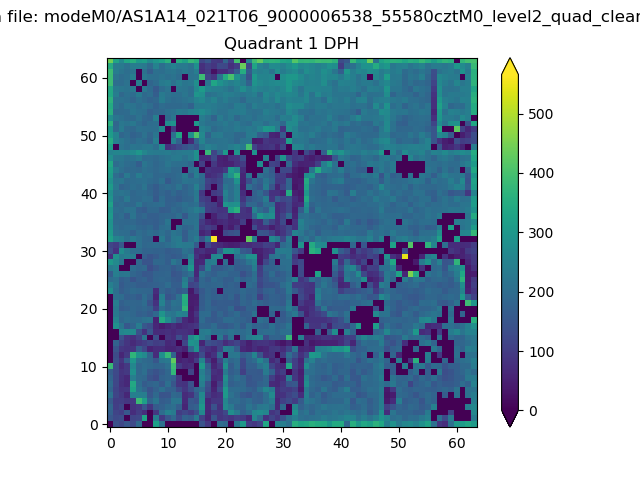 |
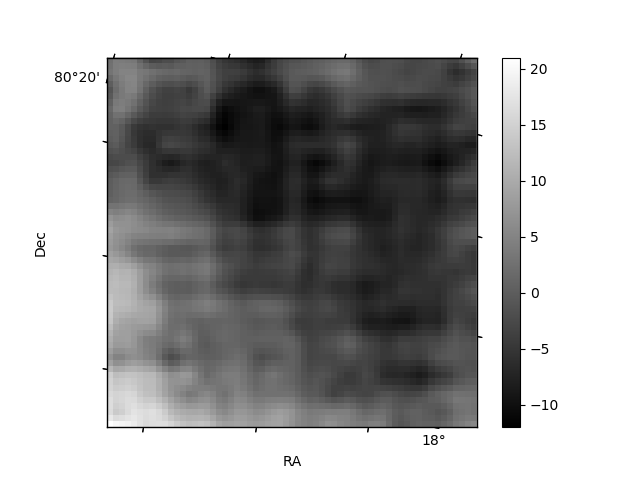
Quadrant B |
|---|---|---|---|
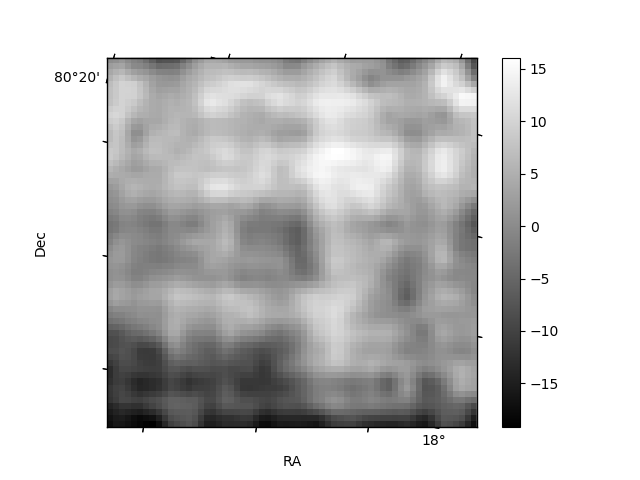
| Quadrant D | 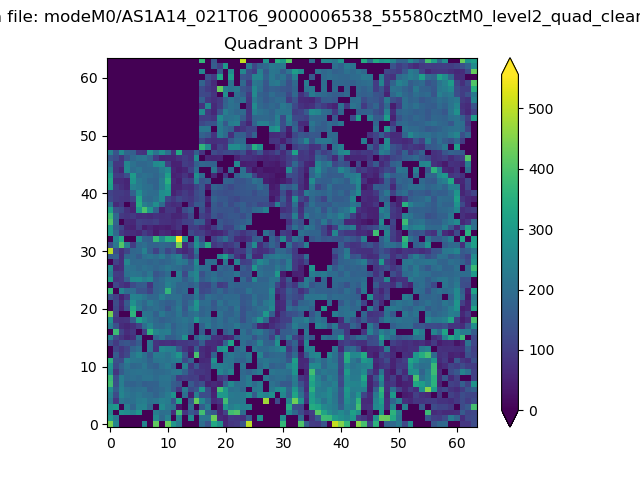 |
 |
Quadrant C |
| Plot type | Count rate plots | Images |
|---|---|---|
| Comparison with Poisson distribution Blue bars denote a histogram of data divided into 1 sec bins. Red curve is a Poisson curve with rate = median count rate of data. |
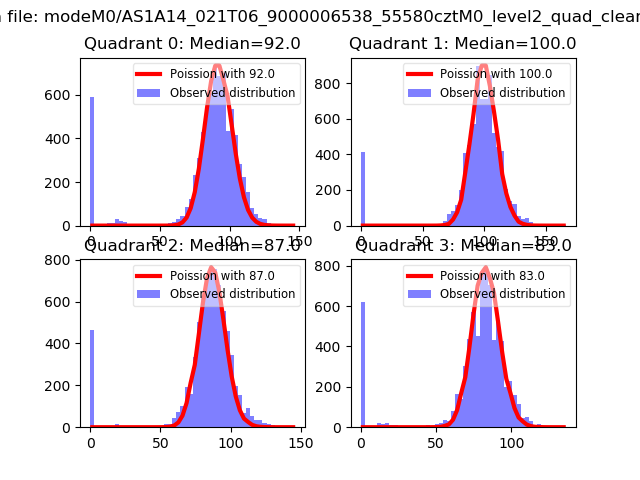 |
 |
| Quadrant-wise count rates Data is divided into 100 sec bins |
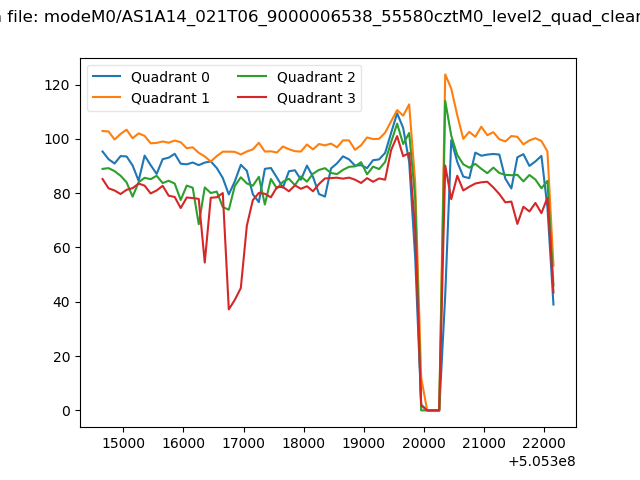 |
|
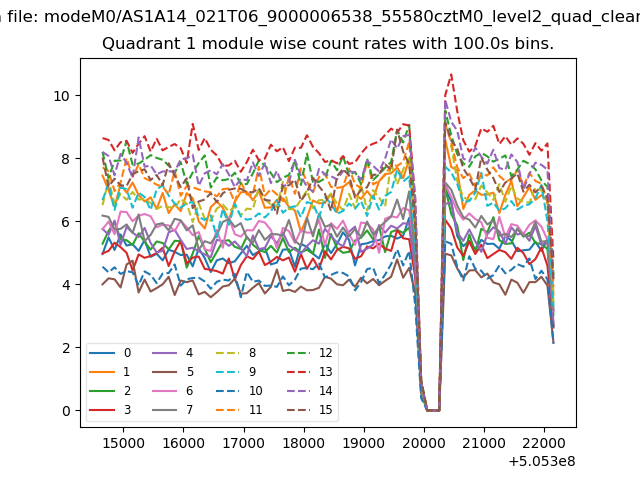
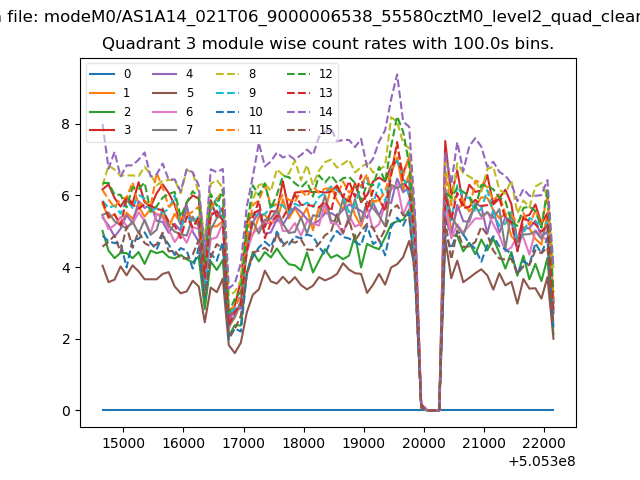
| Module-wise count rates for Quadrant A Data is divided into 100 sec bins |
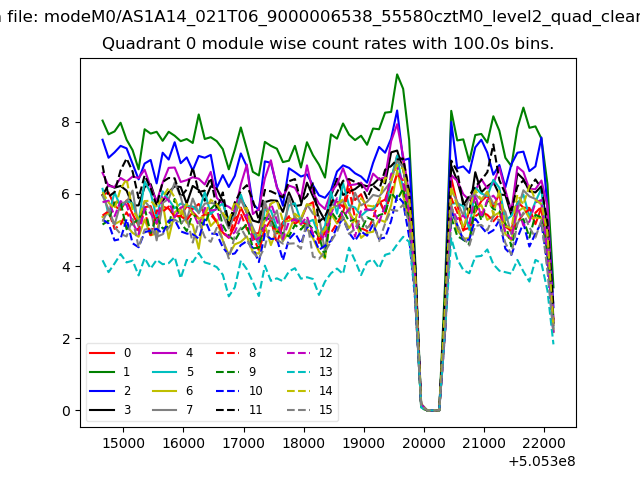 |
 |
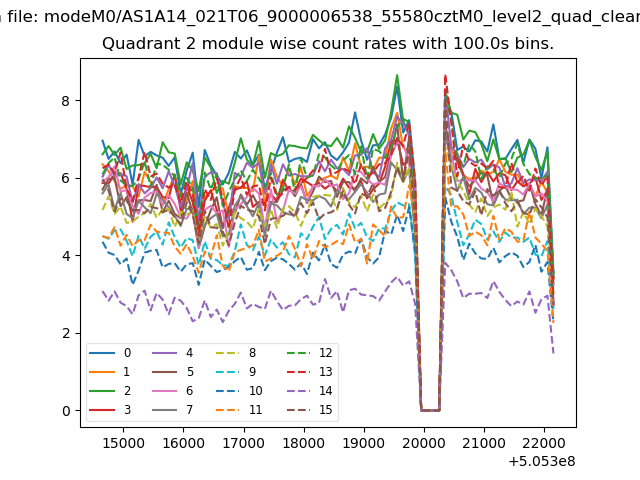
| Module-wise count rates for Quadrant B Data is divided into 100 sec bins |
 |
 |
| Module-wise count rates for Quadrant C Data is divided into 100 sec bins |
 |
 |
| Module-wise count rates for Quadrant D Data is divided into 100 sec bins |
 |
 |
| Parameter | Plot |
|---|---|
| CZT HV Monitor | 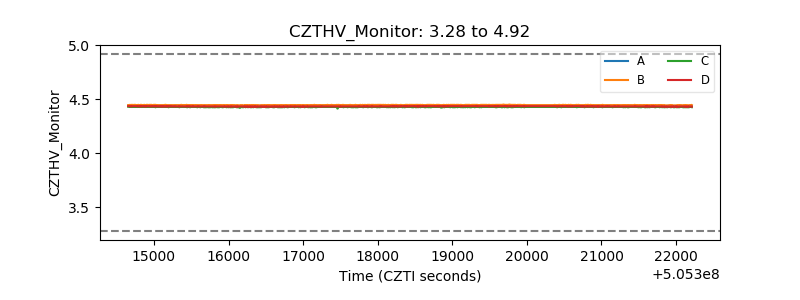 |
| D_VDD | 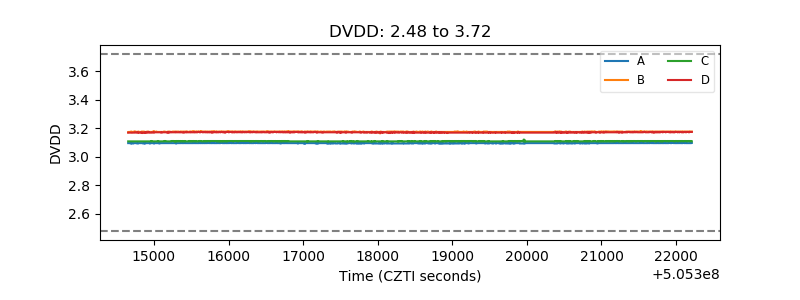 |
| Temperature 1 | 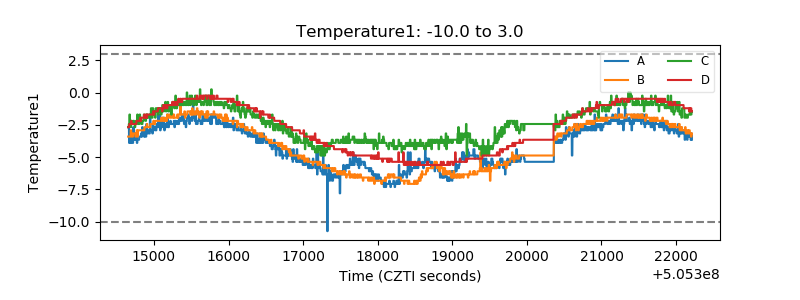 |
| Veto HV Monitor | 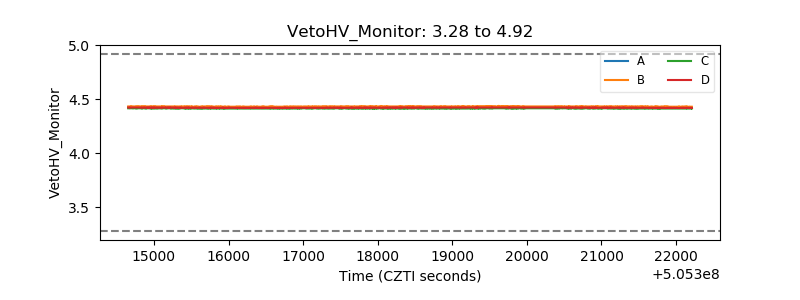 |
| Veto LLD | 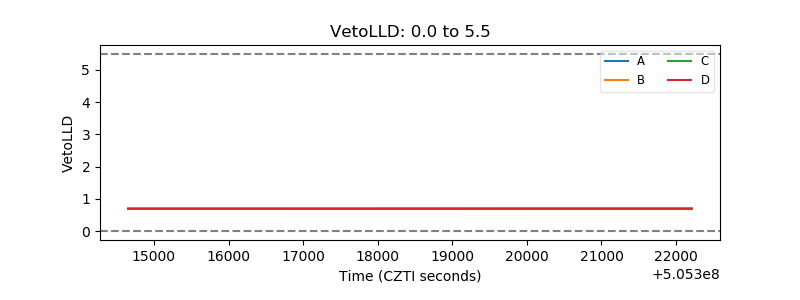 |
| Alpha Counter | 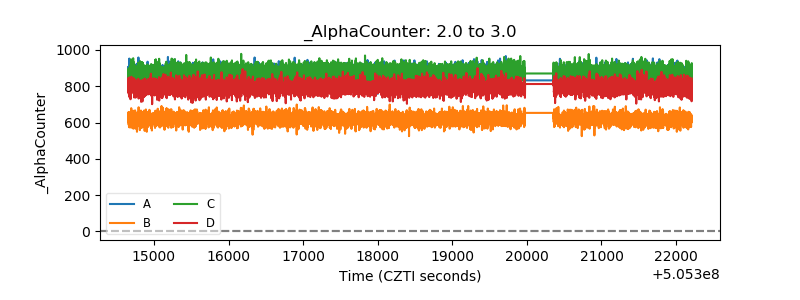 |
| _CPM_Rate | 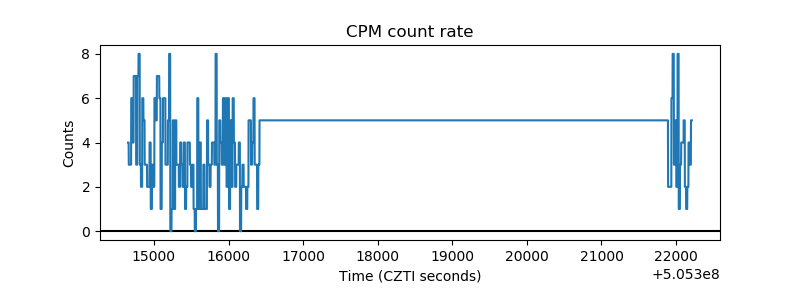 |
| CZT Counter | 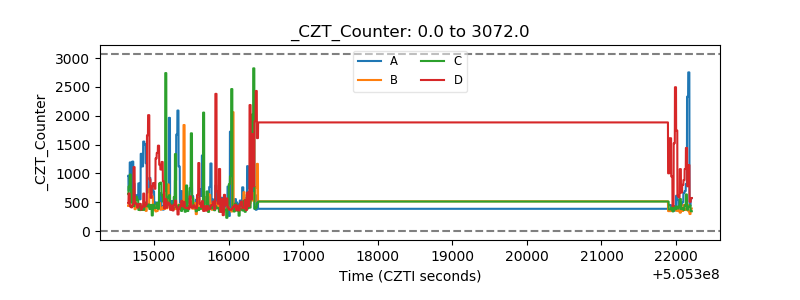 |
| +2.5 Volts monitor | 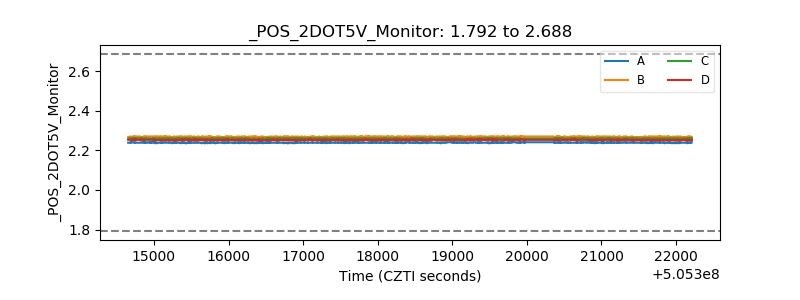 |
| +5 Volts monitor | 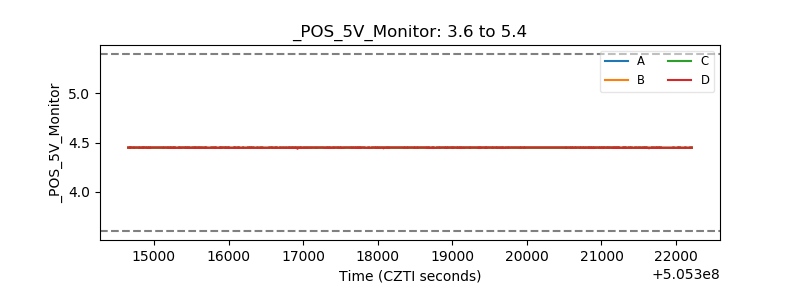 |
| _ROLL_ROT | 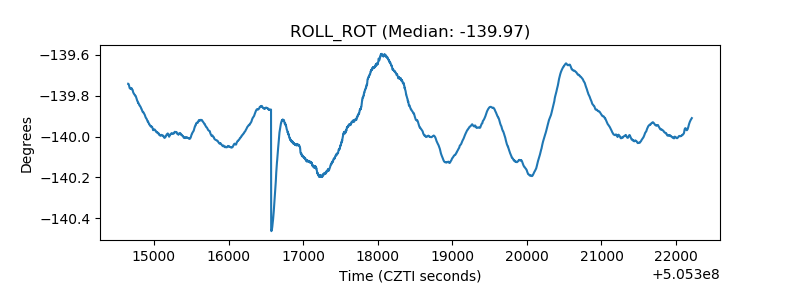 |
| _Roll_DEC | 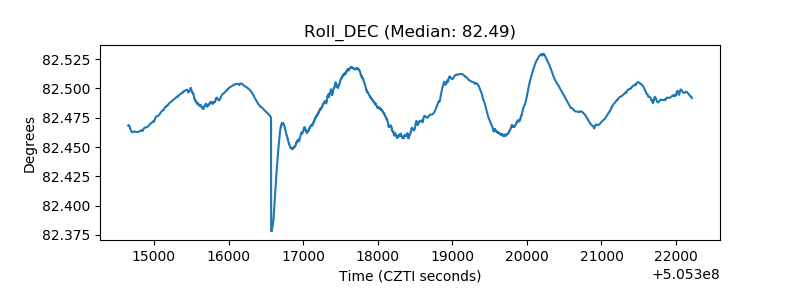 |
| _Roll_RA | 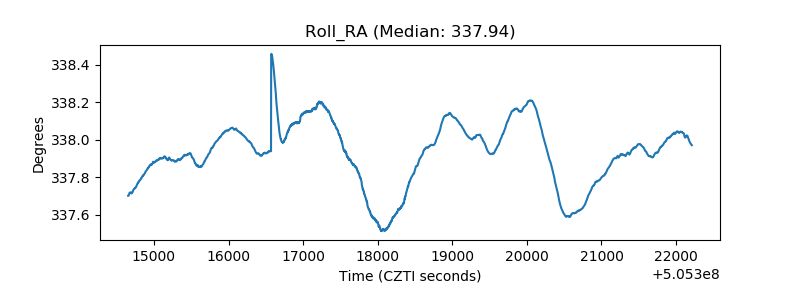 |
| Veto Counter | 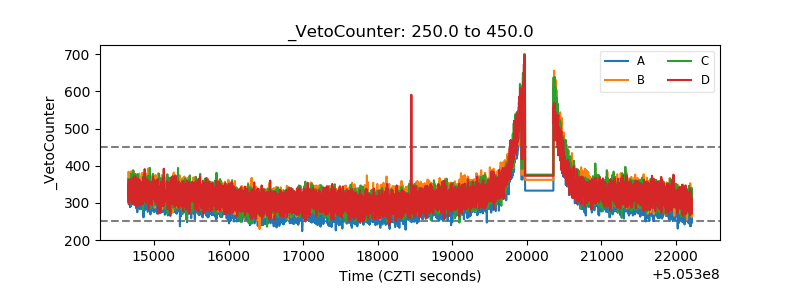 |