| Param | Original file | Final file |
|---|---|---|
| Filename | modeM0/AS1A14_021T06_9000006538_55581cztM0_level2.fits | modeM0/AS1A14_021T06_9000006538_55581cztM0_level2_quad_clean.evt |
| Size (bytes) | 495,616,320 | 104,929,920 |
| Size | 472.7 MB | 100.1 MB |
| Events in quadrant A | 4,967,681 | 674,258 |
| Events in quadrant B | 3,329,270 | 744,430 |
| Events in quadrant C | 4,403,305 | 632,987 |
| Events in quadrant D | 5,065,357 | 605,347 |
| Mode M0 | |||
|---|---|---|---|
| Quadrant | BADHDUFLAG | Total packets | Discarded packets |
| A | 0 | 20153 | 0 |
| B | 0 | 15561 | 0 |
| C | 0 | 19062 | 0 |
| D | 0 | 20485 | 5 |
| Mode SS | |||
|---|---|---|---|
| Quadrant | BADHDUFLAG | Total packets | Discarded packets |
| A | 0 | 150 | 0 |
| B | 0 | 150 | 0 |
| C | 0 | 150 | 0 |
| D | 0 | 150 | 0 |
| Quadrant | Total seconds | Saturated seconds | Saturation percentage |
|---|---|---|---|
| A | 7473 | 318 | 4.255319% |
| B | 7473 | 20 | 0.267630% |
| C | 7474 | 258 | 3.451967% |
| D | 7472 | 284 | 3.800857% |
Noise dominated data is calculated using 1-second bins in cleaned event files. If a bin has >2000 counts, and if more than 50% of those come from <1% of pixels, then it is considered to be noise-dominated and hence unusable.
| Quadrant | # 1 sec bins | Bins with >0 counts | Bins with >2000 counts | High rate bins dominated by noise | Noise dominated (total time) | Noise dominated (detector-on time) | Marked lightcurve |
|---|---|---|---|---|---|---|---|
| A | 7473 | 7473 | 264 | 264 | 3.53% | 3.53% | 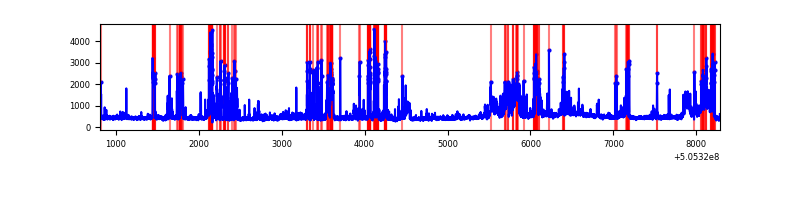 |
| B | 7473 | 7473 | 8 | 8 | 0.11% | 0.11% | 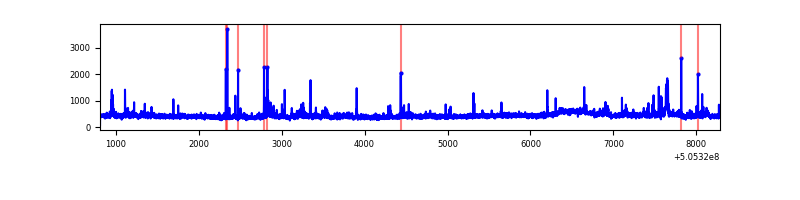 |
| C | 7474 | 7474 | 245 | 245 | 3.28% | 3.28% | 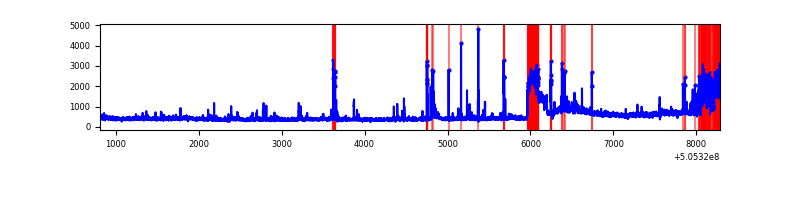 |
| D | 7474 | 7473 | 252 | 252 | 3.37% | 3.37% | 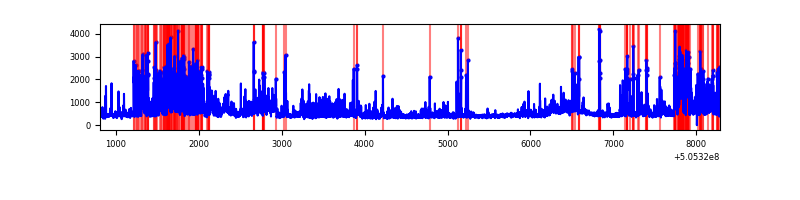 |
Top three noisy pixels from each quadrant. If the there are fewer than three noisy pixels in the level2.evt file, extra rows are filled as -1
| Pixel properties | Quadrant properties | ||||||
|---|---|---|---|---|---|---|---|
| Quadrant | DetID | PixID | Counts | Sigma | Mean | Median | Sigma |
| A | 15 | 32 | 830346 | 4396.24 | 760 | 740 | 188.7 |
| A | 0 | 8 | 550131 | 2911.32 | 760 | 740 | 188.7 |
| A | 12 | 115 | 473073 | 2502.98 | 760 | 740 | 188.7 |
| B | 4 | 169 | 160757 | 982.8 | 761 | 730 | 162.8 |
| B | 0 | 199 | 44037 | 265.97 | 761 | 730 | 162.8 |
| B | 10 | 247 | 33371 | 200.46 | 761 | 730 | 162.8 |
| C | 13 | 3 | 1138520 | 5567.79 | 742 | 731 | 204.4 |
| C | 12 | 2 | 103711 | 503.93 | 742 | 731 | 204.4 |
| C | 6 | 223 | 87541 | 424.8 | 742 | 731 | 204.4 |
| D | 11 | 129 | 826985 | 3940.55 | 740 | 705 | 209.7 |
| D | 15 | 125 | 766448 | 3651.85 | 740 | 705 | 209.7 |
| D | 11 | 224 | 191535 | 910.07 | 740 | 705 | 209.7 |
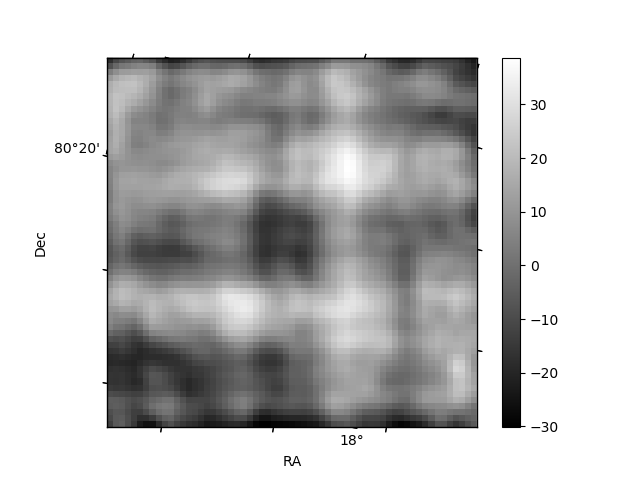
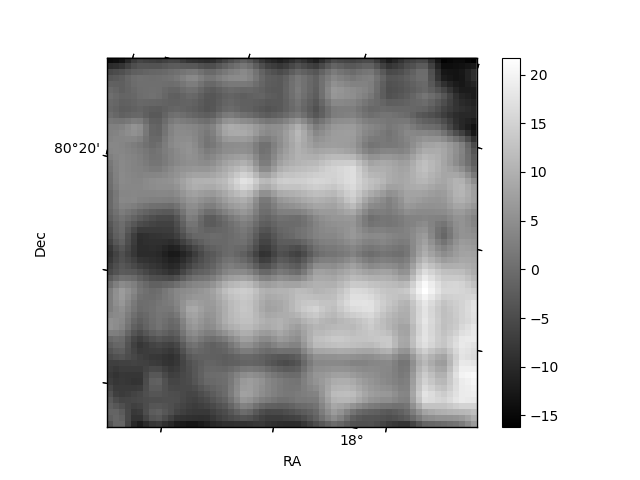
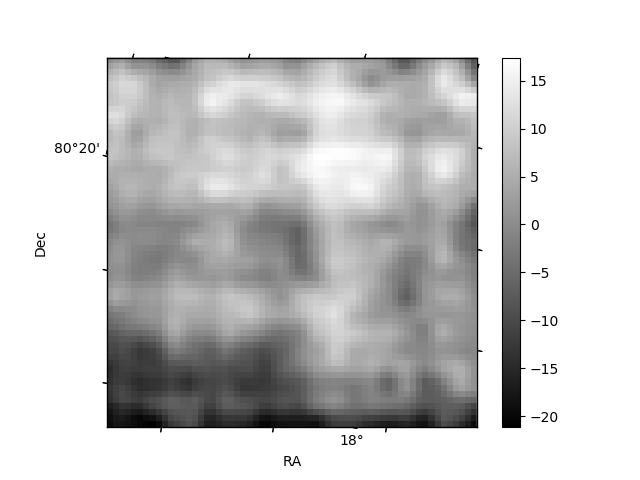
Histogram calculated using DETX and DETY for each event in the final _common_clean file
| Quadrant A | 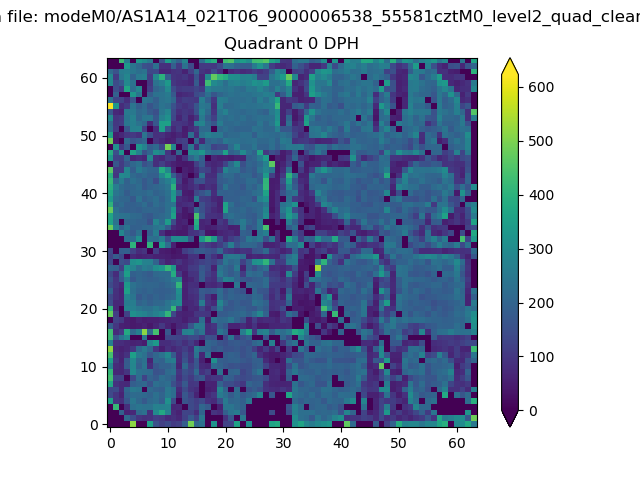 |
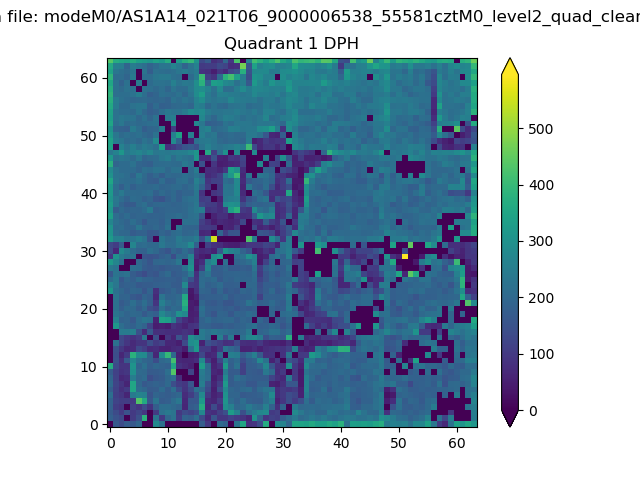 |
Quadrant B |
|---|---|---|---|
| Quadrant D | 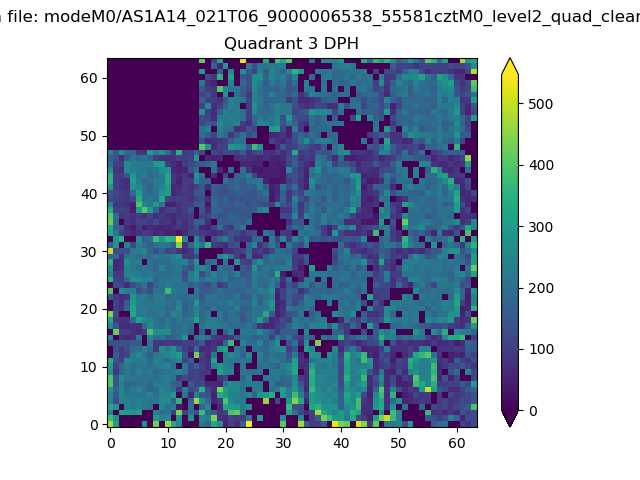 |
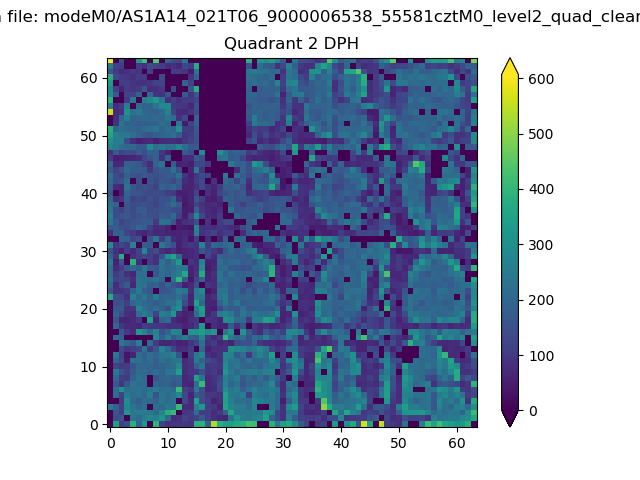 |
Quadrant C |
| Plot type | Count rate plots | Images |
|---|---|---|
| Comparison with Poisson distribution Blue bars denote a histogram of data divided into 1 sec bins. Red curve is a Poisson curve with rate = median count rate of data. |
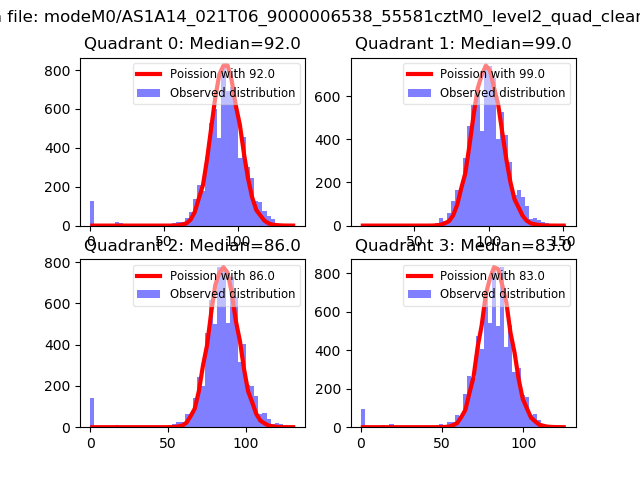 |
 |
| Quadrant-wise count rates Data is divided into 100 sec bins |
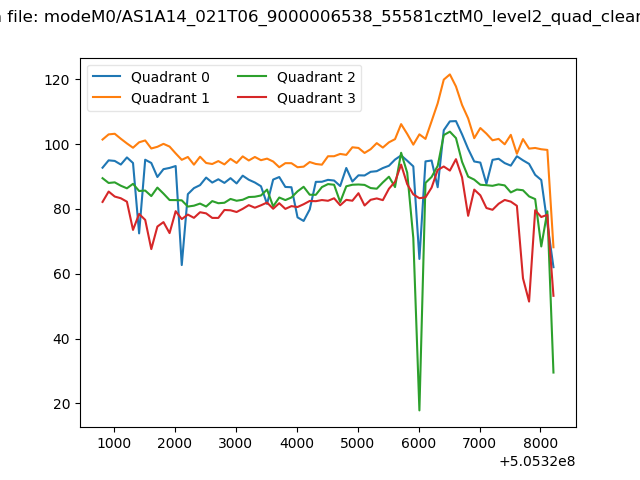 |
|
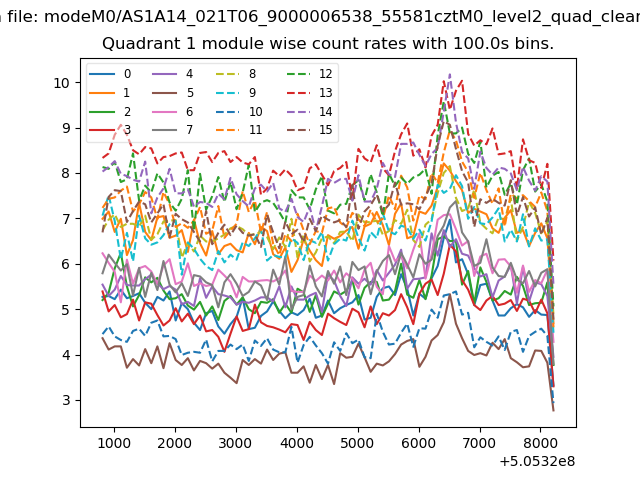
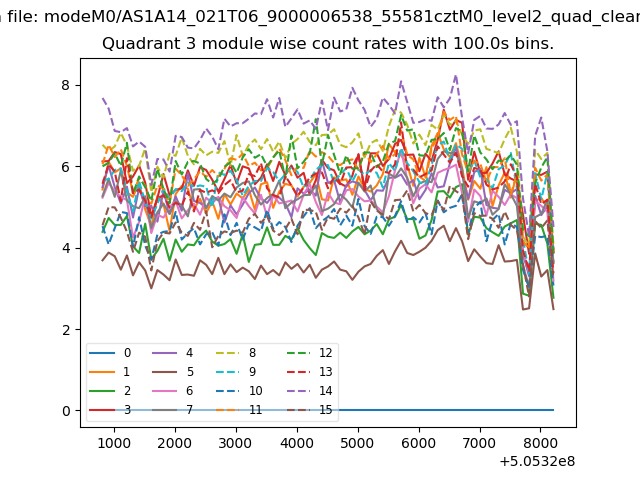
| Module-wise count rates for Quadrant A Data is divided into 100 sec bins |
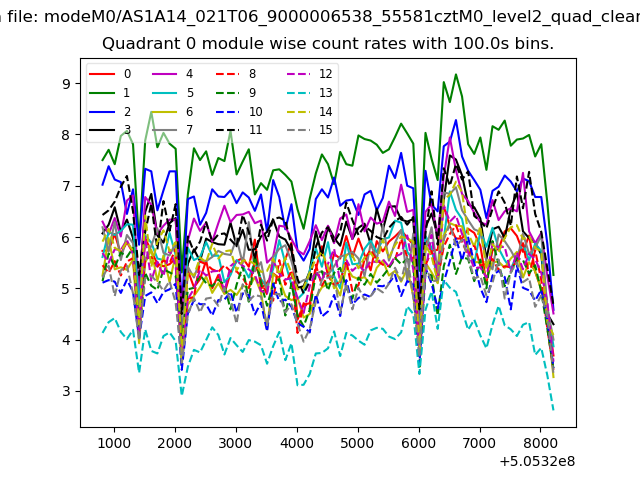 |
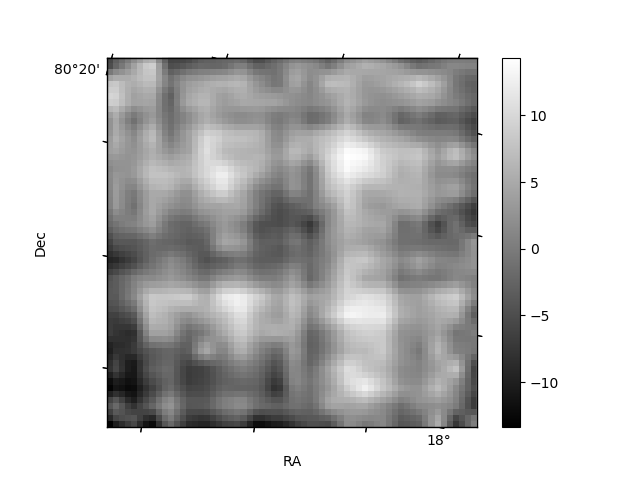 |
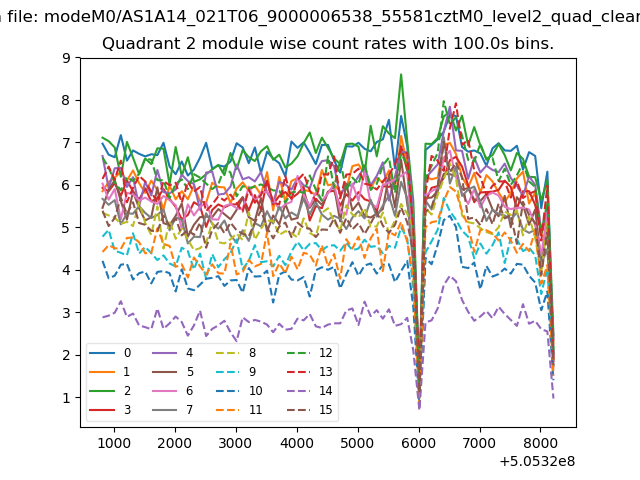
| Module-wise count rates for Quadrant B Data is divided into 100 sec bins |
 |
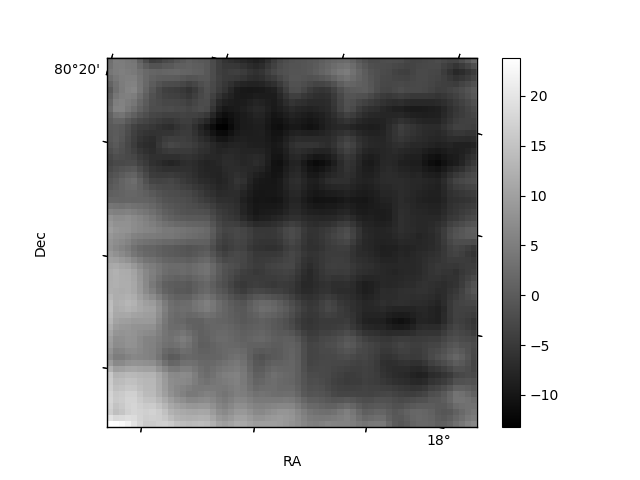 |
| Module-wise count rates for Quadrant C Data is divided into 100 sec bins |
 |
 |
| Module-wise count rates for Quadrant D Data is divided into 100 sec bins |
 |
 |
| Parameter | Plot |
|---|---|
| CZT HV Monitor | 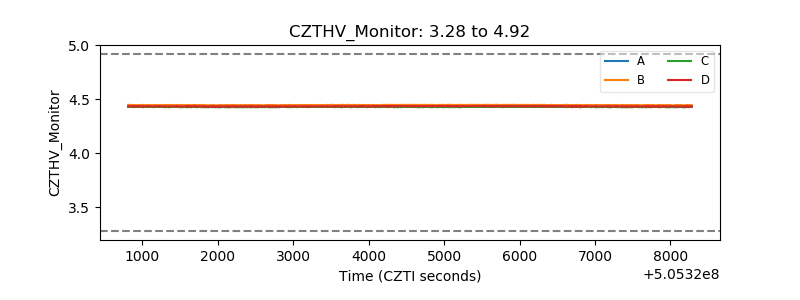 |
| D_VDD | 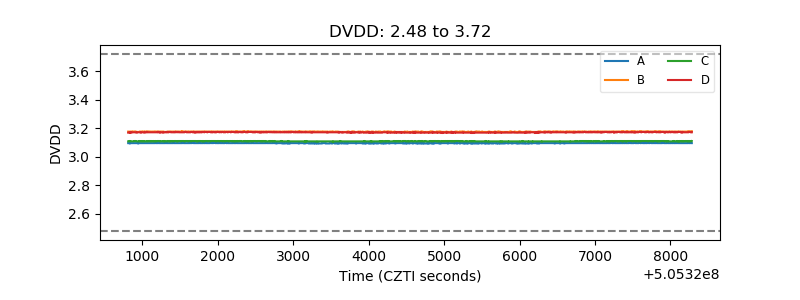 |
| Temperature 1 | 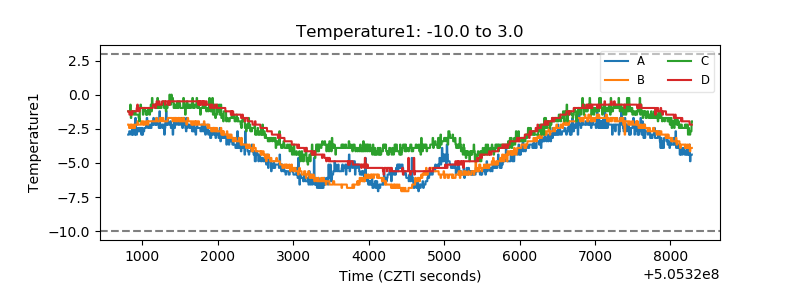 |
| Veto HV Monitor | 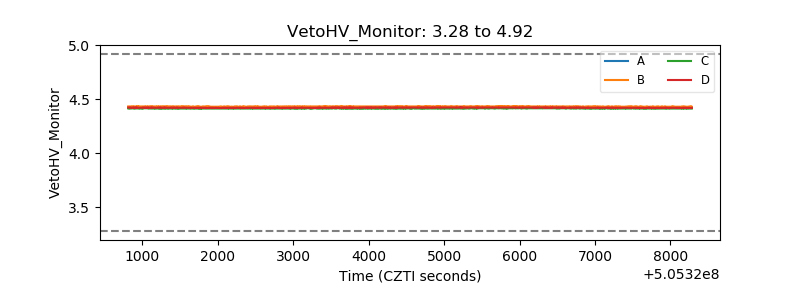 |
| Veto LLD | 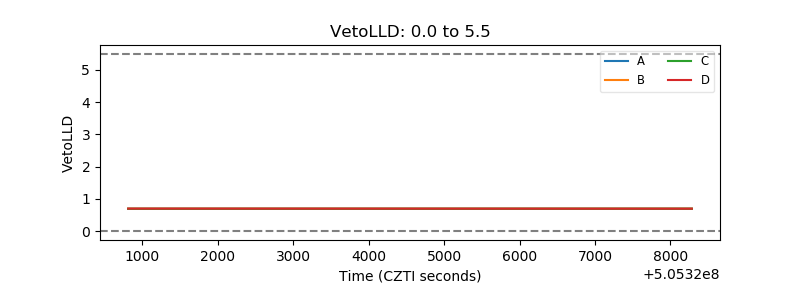 |
| Alpha Counter | 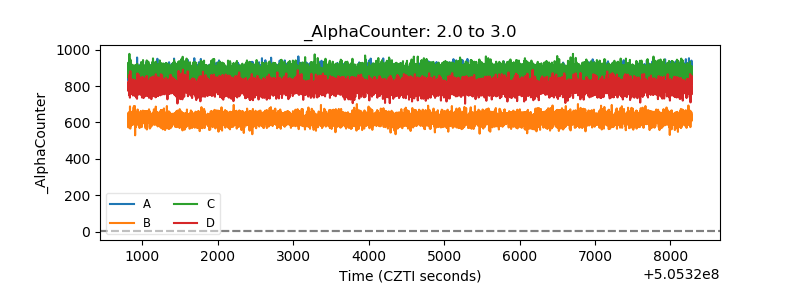 |
| _CPM_Rate | 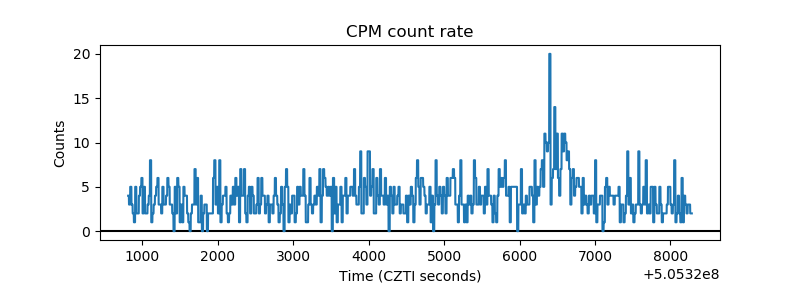 |
| CZT Counter | 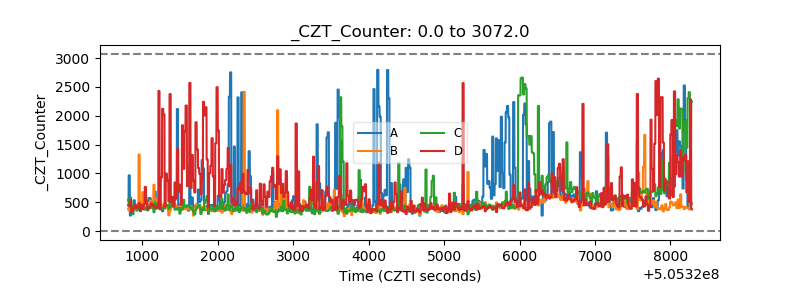 |
| +2.5 Volts monitor | 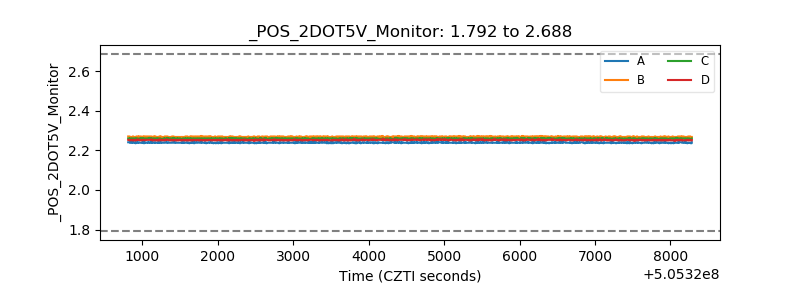 |
| +5 Volts monitor | 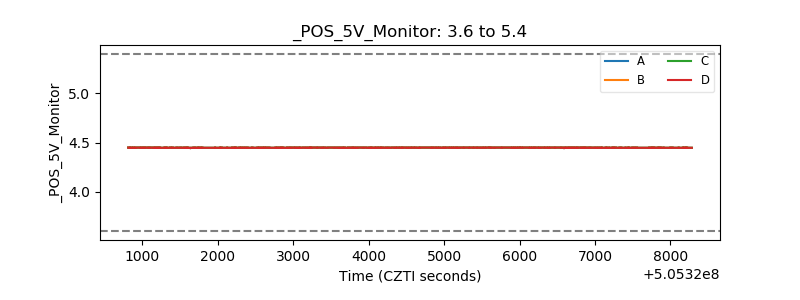 |
| _ROLL_ROT | 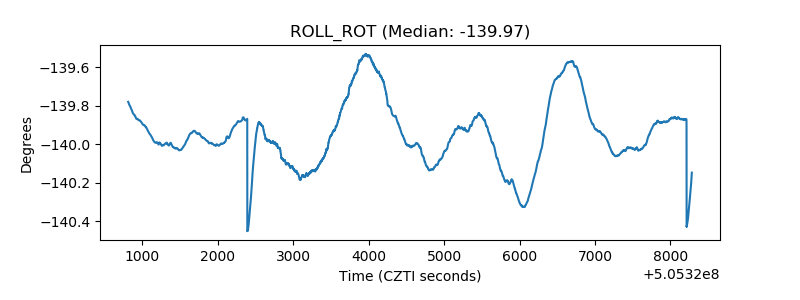 |
| _Roll_DEC | 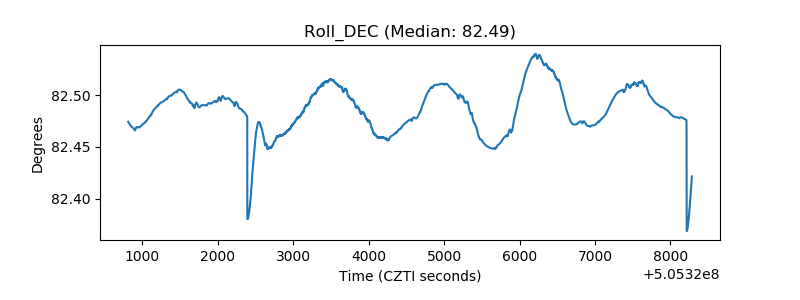 |
| _Roll_RA | 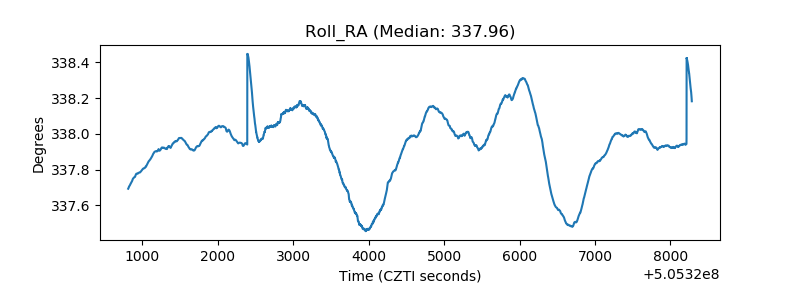 |
| Veto Counter | 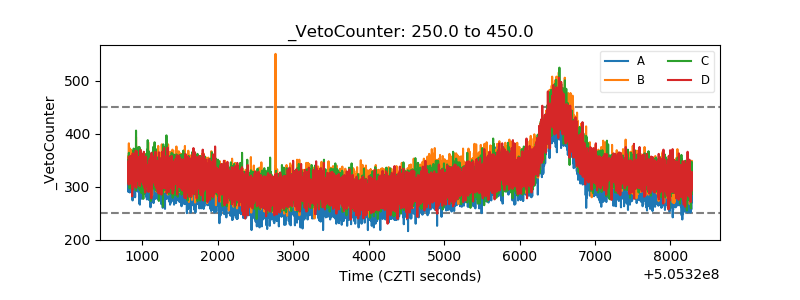 |