| Param | Original file | Final file |
|---|---|---|
| Filename | modeM0/AS1A14_021T06_9000006538_55582cztM0_level2.fits | modeM0/AS1A14_021T06_9000006538_55582cztM0_level2_quad_clean.evt |
| Size (bytes) | 493,467,840 | 105,120,000 |
| Size | 470.6 MB | 100.3 MB |
| Events in quadrant A | 4,281,965 | 686,994 |
| Events in quadrant B | 3,656,038 | 742,191 |
| Events in quadrant C | 5,027,573 | 620,892 |
| Events in quadrant D | 4,716,902 | 609,693 |
| Mode M0 | |||
|---|---|---|---|
| Quadrant | BADHDUFLAG | Total packets | Discarded packets |
| A | 0 | 17988 | 0 |
| B | 0 | 16513 | 0 |
| C | 0 | 20514 | 0 |
| D | 0 | 19558 | 0 |
| Mode SS | |||
|---|---|---|---|
| Quadrant | BADHDUFLAG | Total packets | Discarded packets |
| A | 0 | 150 | 0 |
| B | 0 | 150 | 0 |
| C | 0 | 150 | 0 |
| D | 0 | 150 | 0 |
| Quadrant | Total seconds | Saturated seconds | Saturation percentage |
|---|---|---|---|
| A | 7518 | 134 | 1.782389% |
| B | 7518 | 30 | 0.399042% |
| C | 7519 | 430 | 5.718846% |
| D | 7519 | 226 | 3.005719% |
Noise dominated data is calculated using 1-second bins in cleaned event files. If a bin has >2000 counts, and if more than 50% of those come from <1% of pixels, then it is considered to be noise-dominated and hence unusable.
| Quadrant | # 1 sec bins | Bins with >0 counts | Bins with >2000 counts | High rate bins dominated by noise | Noise dominated (total time) | Noise dominated (detector-on time) | Marked lightcurve |
|---|---|---|---|---|---|---|---|
| A | 7518 | 7518 | 107 | 107 | 1.42% | 1.42% | 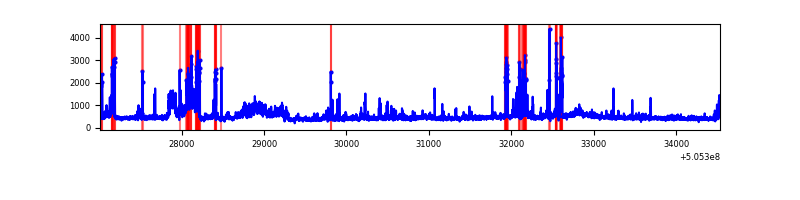 |
| B | 7518 | 7518 | 14 | 14 | 0.19% | 0.19% | 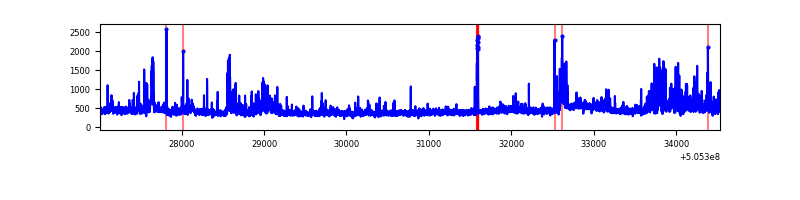 |
| C | 7519 | 7519 | 395 | 395 | 5.25% | 5.25% | 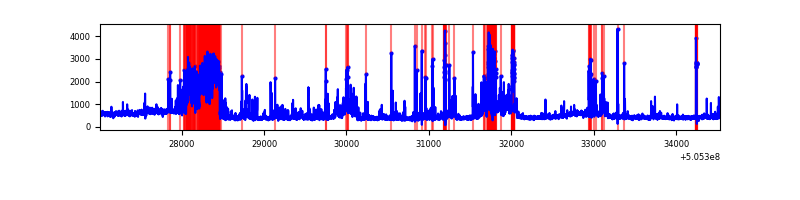 |
| D | 7519 | 7519 | 194 | 194 | 2.58% | 2.58% | 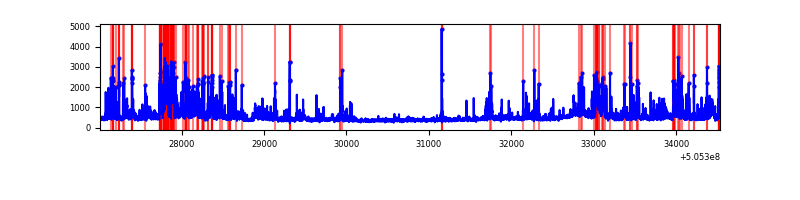 |
Top three noisy pixels from each quadrant. If the there are fewer than three noisy pixels in the level2.evt file, extra rows are filled as -1
| Pixel properties | Quadrant properties | ||||||
|---|---|---|---|---|---|---|---|
| Quadrant | DetID | PixID | Counts | Sigma | Mean | Median | Sigma |
| A | 12 | 115 | 527942 | 2791.13 | 765 | 746 | 188.9 |
| A | 0 | 8 | 429201 | 2268.37 | 765 | 746 | 188.9 |
| A | 8 | 249 | 142462 | 750.29 | 765 | 746 | 188.9 |
| B | 5 | 236 | 391416 | 2389.01 | 759 | 728 | 163.5 |
| B | 4 | 169 | 120734 | 733.82 | 759 | 728 | 163.5 |
| B | 0 | 199 | 48979 | 295.05 | 759 | 728 | 163.5 |
| C | 13 | 3 | 953843 | 4748.1 | 731 | 723 | 200.7 |
| C | 12 | 2 | 730840 | 3637.18 | 731 | 723 | 200.7 |
| C | 6 | 223 | 200182 | 993.63 | 731 | 723 | 200.7 |
| D | 11 | 129 | 1051025 | 4956.5 | 743 | 707 | 211.9 |
| D | 15 | 125 | 258610 | 1217.06 | 743 | 707 | 211.9 |
| D | 2 | 62 | 84178 | 393.9 | 743 | 707 | 211.9 |
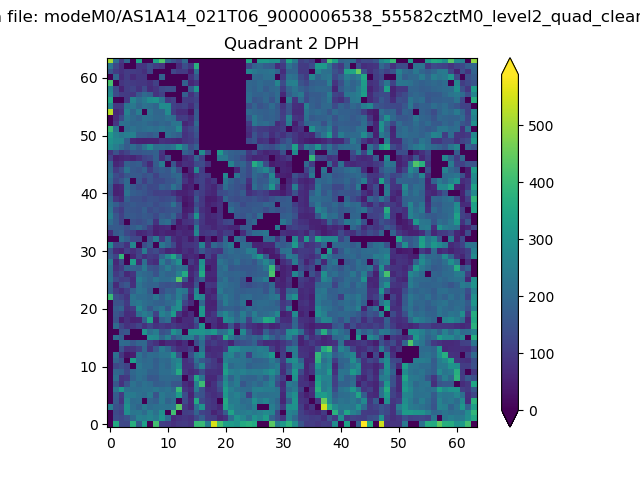
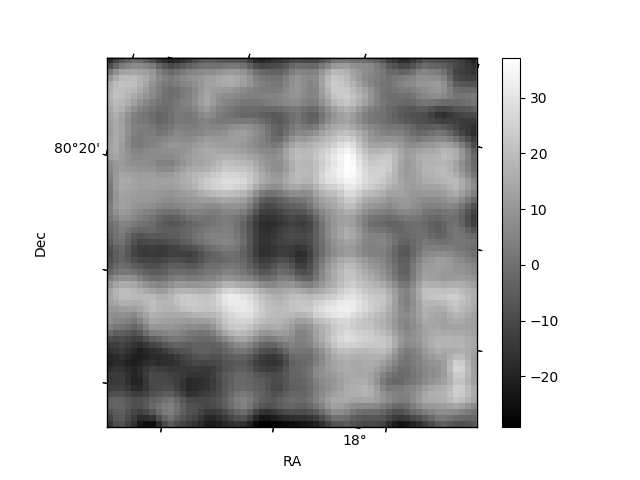
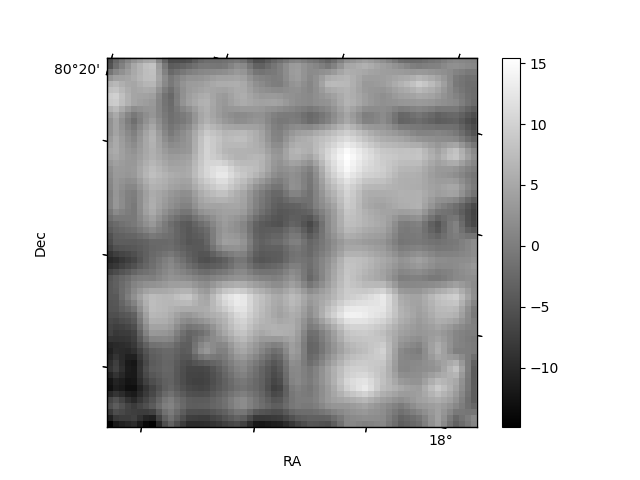
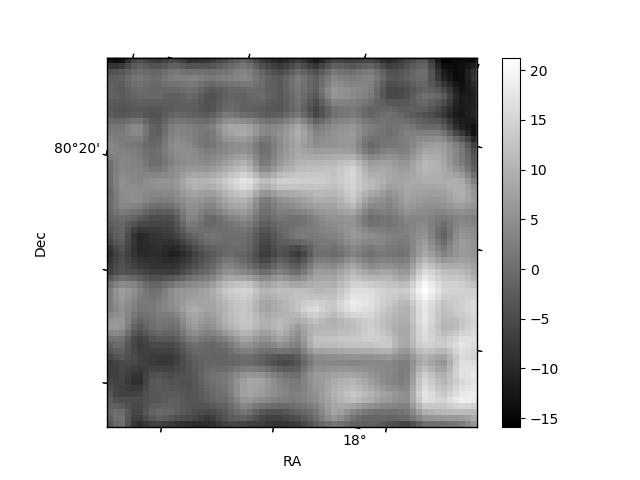
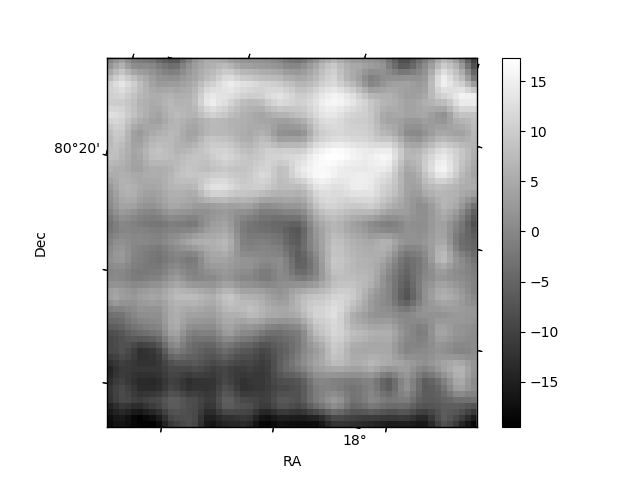
Histogram calculated using DETX and DETY for each event in the final _common_clean file
| Quadrant A | 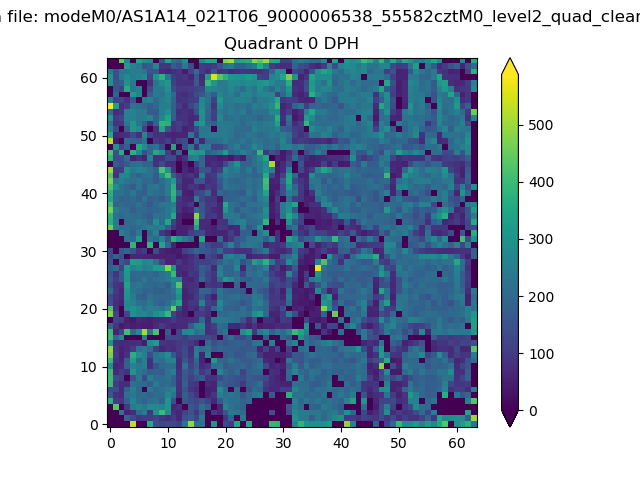 |
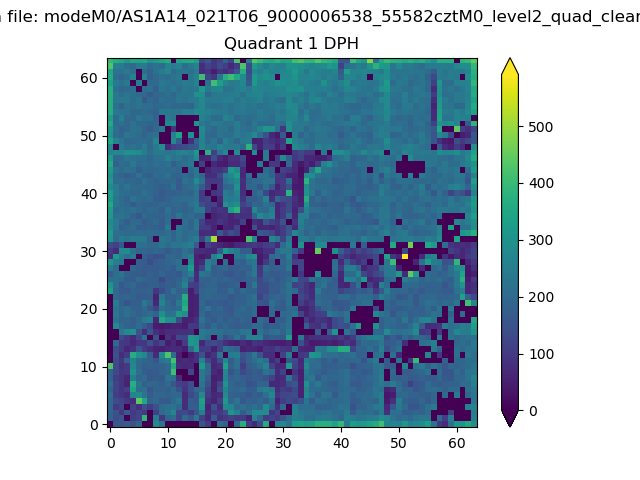 |
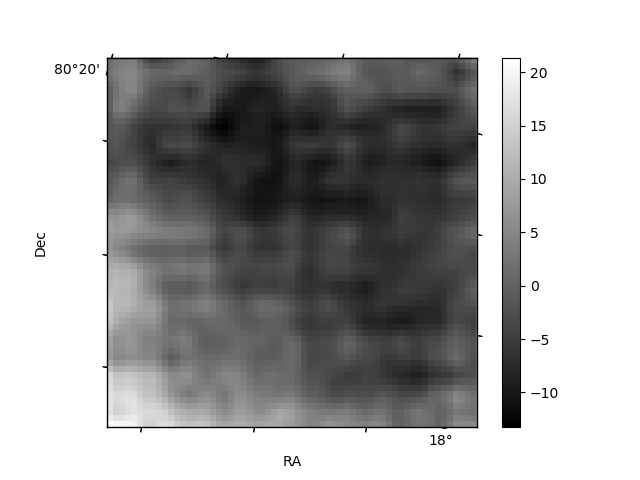
Quadrant B |
|---|---|---|---|
| Quadrant D | 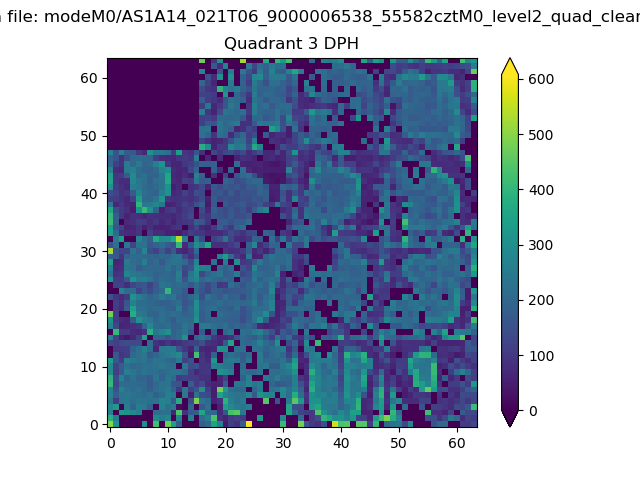 |
 |
Quadrant C |
| Plot type | Count rate plots | Images |
|---|---|---|
| Comparison with Poisson distribution Blue bars denote a histogram of data divided into 1 sec bins. Red curve is a Poisson curve with rate = median count rate of data. |
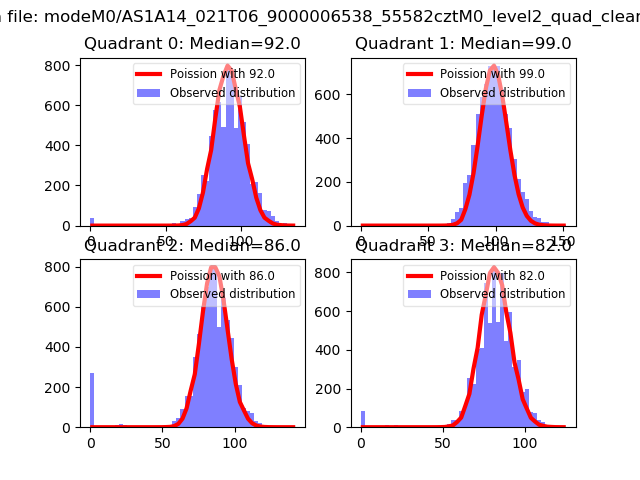 |
 |
| Quadrant-wise count rates Data is divided into 100 sec bins |
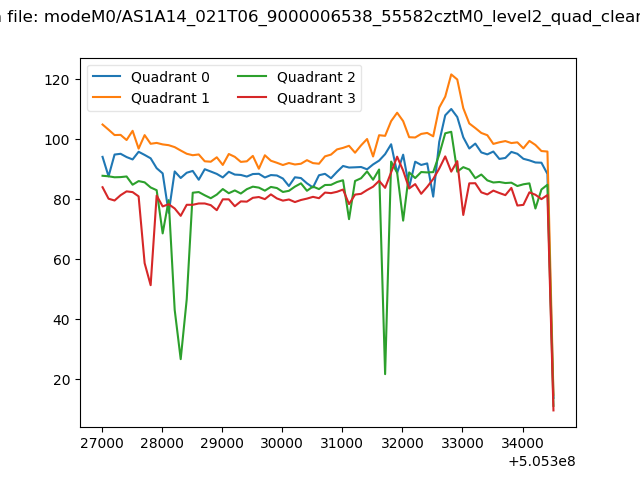 |
|
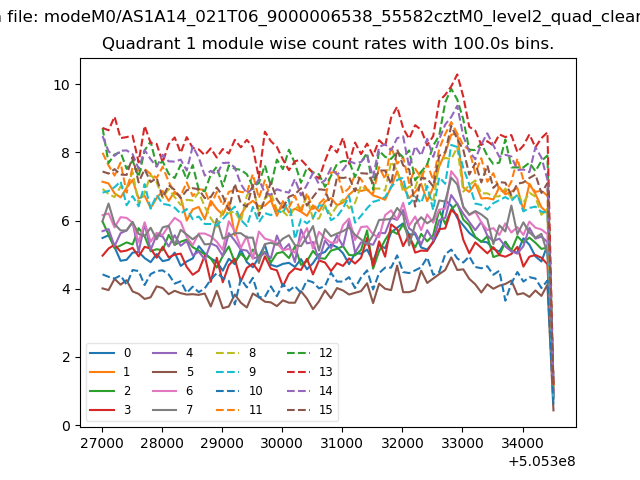
| Module-wise count rates for Quadrant A Data is divided into 100 sec bins |
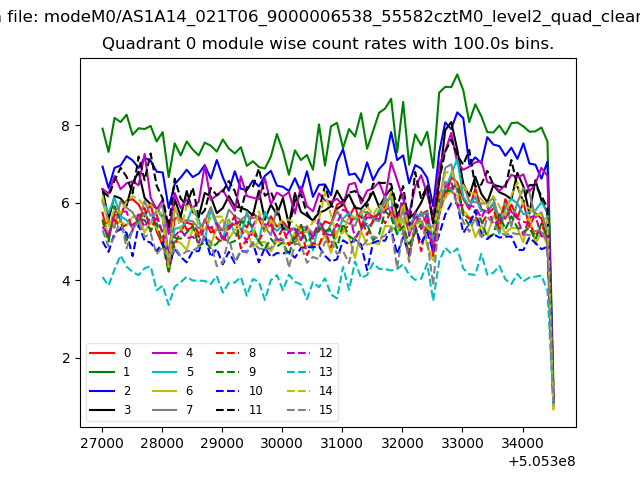 |
 |
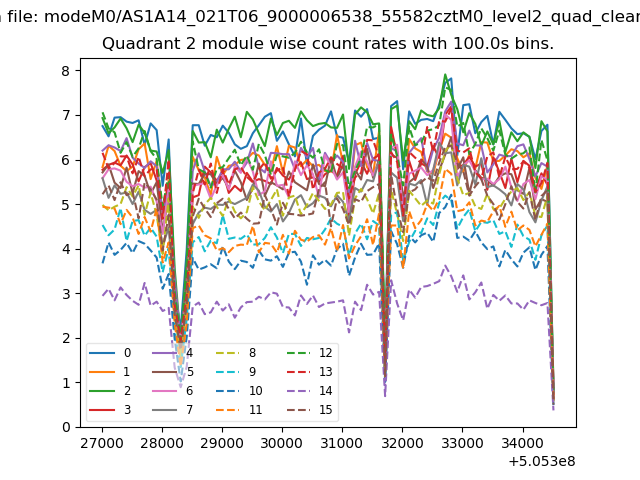
| Module-wise count rates for Quadrant B Data is divided into 100 sec bins |
 |
 |
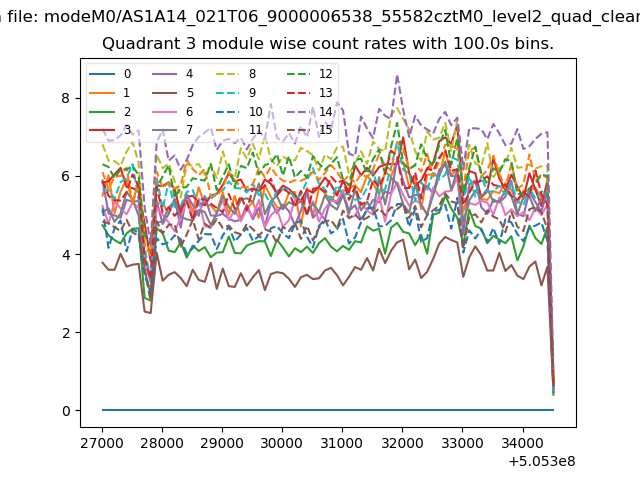
| Module-wise count rates for Quadrant C Data is divided into 100 sec bins |
 |
 |
| Module-wise count rates for Quadrant D Data is divided into 100 sec bins |
 |
 |
| Parameter | Plot |
|---|---|
| CZT HV Monitor | 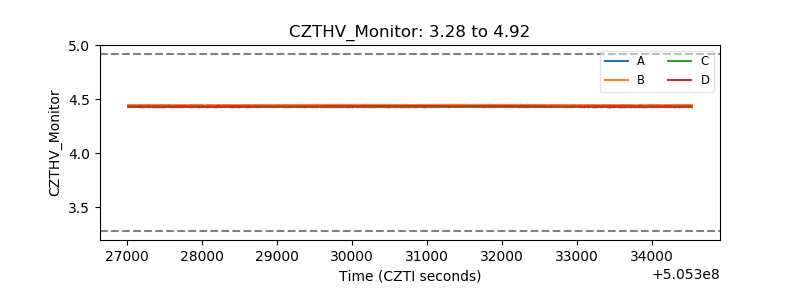 |
| D_VDD | 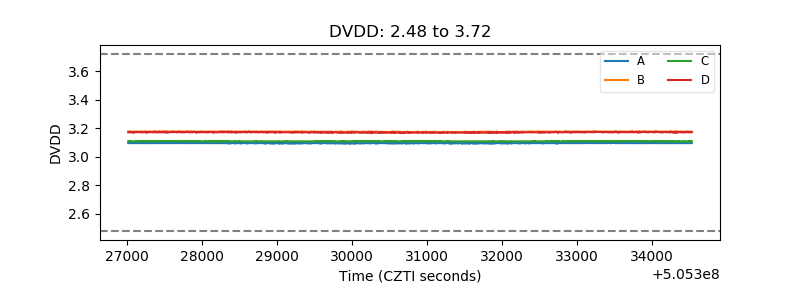 |
| Temperature 1 | 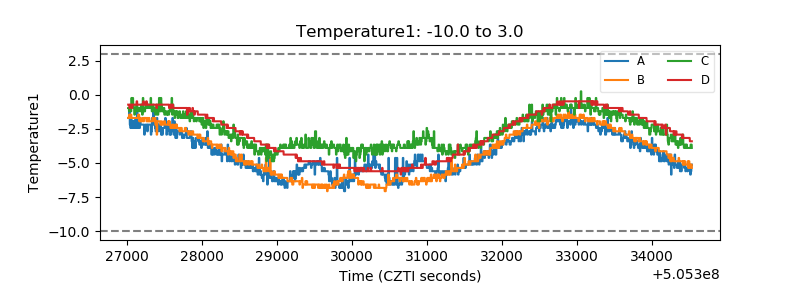 |
| Veto HV Monitor | 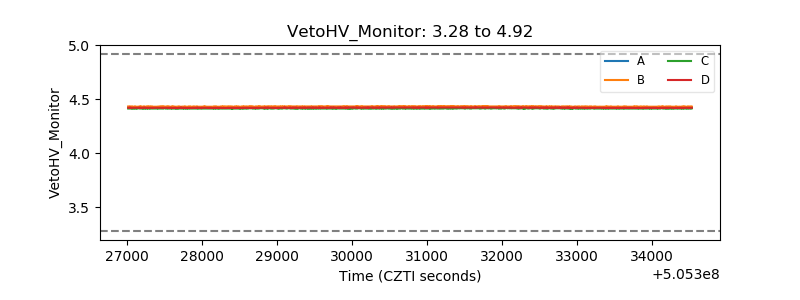 |
| Veto LLD | 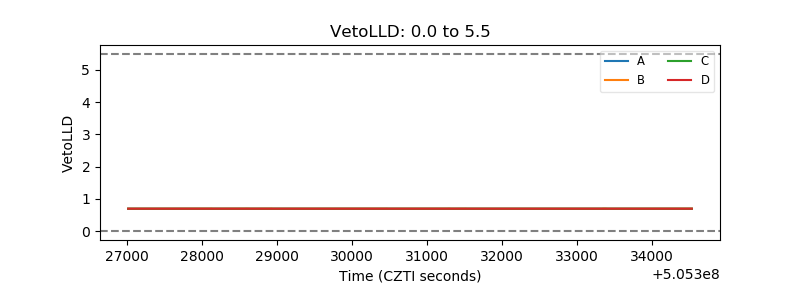 |
| Alpha Counter | 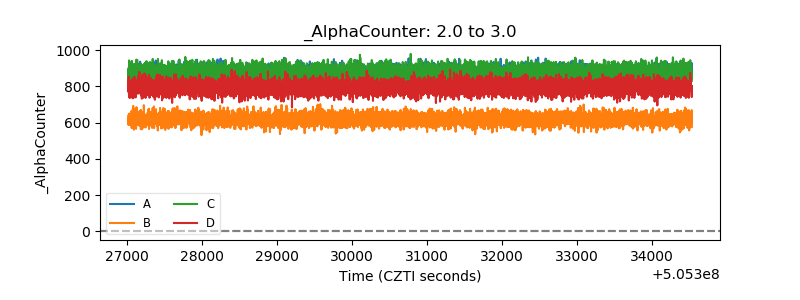 |
| _CPM_Rate | 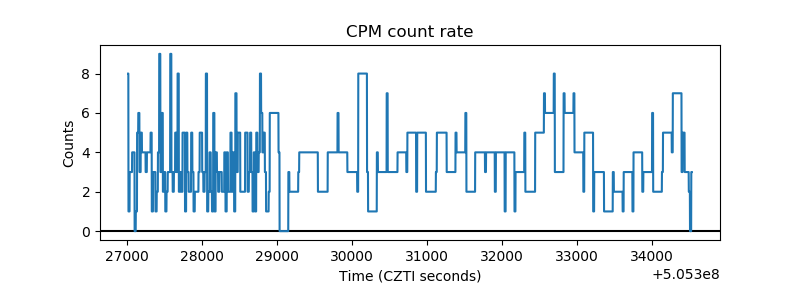 |
| CZT Counter | 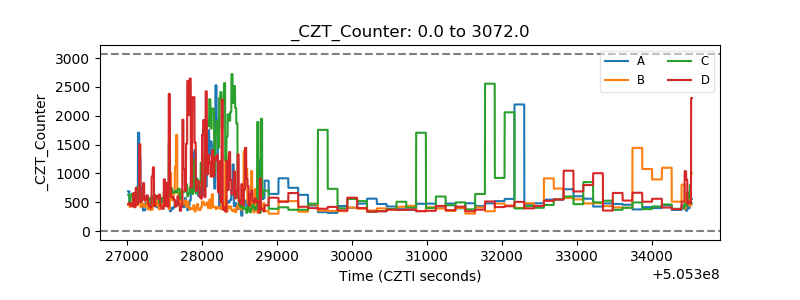 |
| +2.5 Volts monitor |  |
| +5 Volts monitor |  |
| _ROLL_ROT | 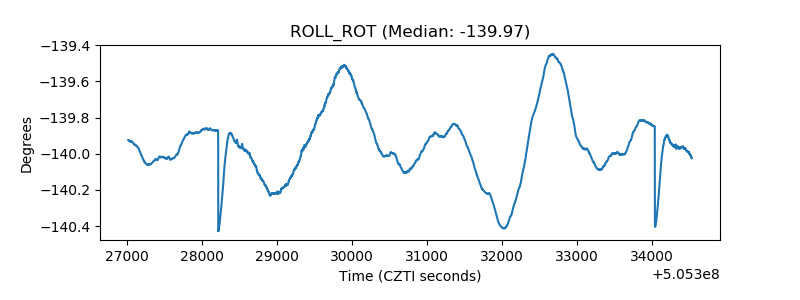 |
| _Roll_DEC | 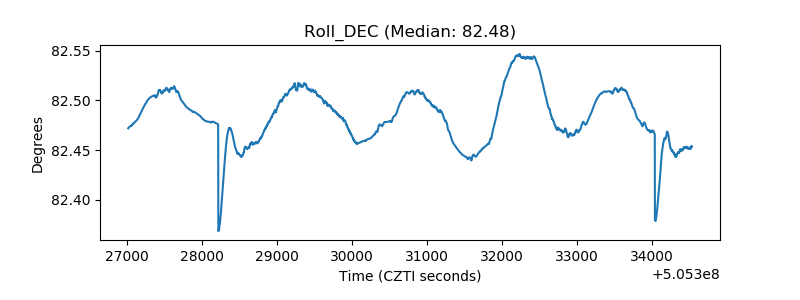 |
| _Roll_RA | 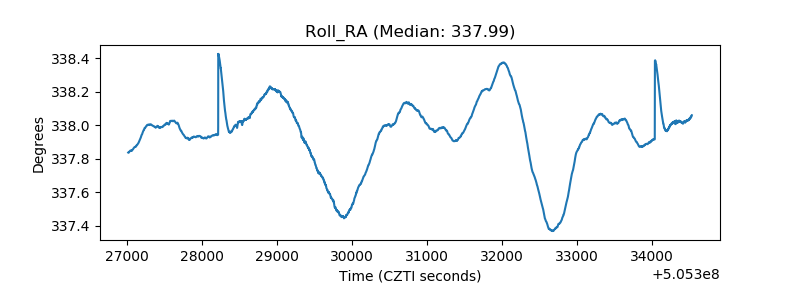 |
| Veto Counter | 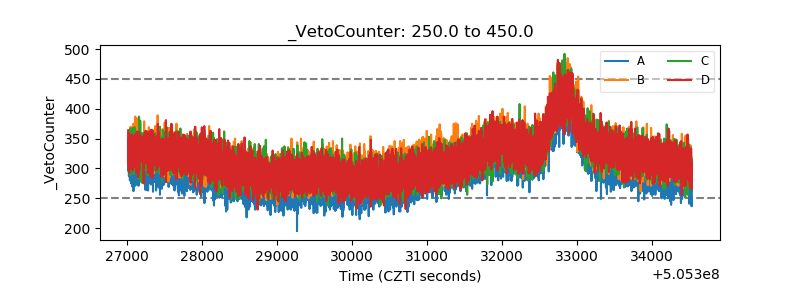 |