| Param | Original file | Final file |
|---|---|---|
| Filename | modeM0/AS1A14_021T06_9000006538_55585cztM0_level2.fits | modeM0/AS1A14_021T06_9000006538_55585cztM0_level2_quad_clean.evt |
| Size (bytes) | 584,472,960 | 126,250,560 |
| Size | 557.4 MB | 120.4 MB |
| Events in quadrant A | 4,456,252 | 831,443 |
| Events in quadrant B | 4,587,125 | 885,223 |
| Events in quadrant C | 6,111,567 | 738,927 |
| Events in quadrant D | 5,771,650 | 733,530 |
| Mode M0 | |||
|---|---|---|---|
| Quadrant | BADHDUFLAG | Total packets | Discarded packets |
| A | 0 | 20128 | 1 |
| B | 0 | 20693 | 3 |
| C | 0 | 25341 | 3 |
| D | 0 | 23889 | 0 |
| Mode SS | |||
|---|---|---|---|
| Quadrant | BADHDUFLAG | Total packets | Discarded packets |
| A | 0 | 184 | 0 |
| B | 0 | 184 | 0 |
| C | 0 | 184 | 0 |
| D | 0 | 184 | 0 |
| Quadrant | Total seconds | Saturated seconds | Saturation percentage |
|---|---|---|---|
| A | 9125 | 87 | 0.953425% |
| B | 9124 | 111 | 1.216572% |
| C | 9124 | 665 | 7.288470% |
| D | 9126 | 327 | 3.583169% |
Noise dominated data is calculated using 1-second bins in cleaned event files. If a bin has >2000 counts, and if more than 50% of those come from <1% of pixels, then it is considered to be noise-dominated and hence unusable.
| Quadrant | # 1 sec bins | Bins with >0 counts | Bins with >2000 counts | High rate bins dominated by noise | Noise dominated (total time) | Noise dominated (detector-on time) | Marked lightcurve |
|---|---|---|---|---|---|---|---|
| A | 9125 | 9125 | 51 | 51 | 0.56% | 0.56% | 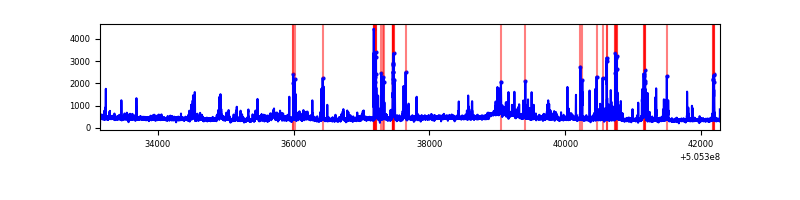 |
| B | 9126 | 9125 | 7 | 7 | 0.08% | 0.08% | 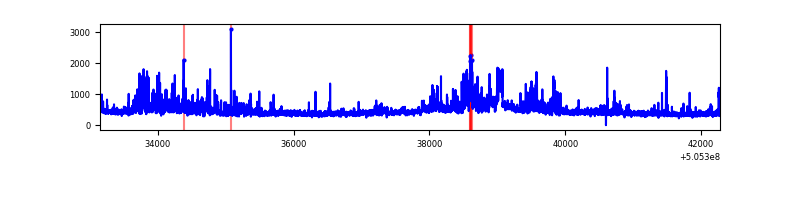 |
| C | 9126 | 9125 | 613 | 613 | 6.72% | 6.72% | 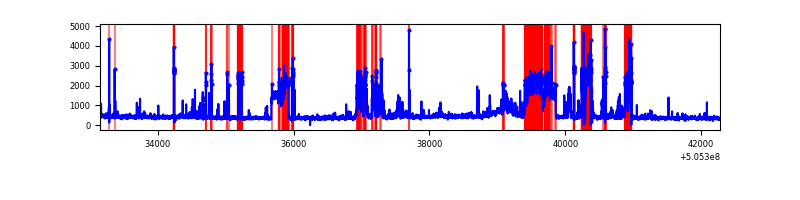 |
| D | 9126 | 9126 | 255 | 255 | 2.79% | 2.79% | 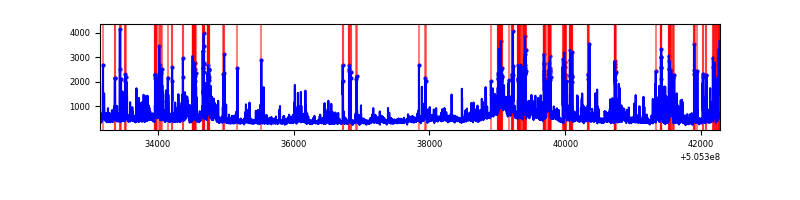 |
Top three noisy pixels from each quadrant. If the there are fewer than three noisy pixels in the level2.evt file, extra rows are filled as -1
| Pixel properties | Quadrant properties | ||||||
|---|---|---|---|---|---|---|---|
| Quadrant | DetID | PixID | Counts | Sigma | Mean | Median | Sigma |
| A | 0 | 8 | 394737 | 1714.52 | 921 | 894 | 229.7 |
| A | 8 | 249 | 324858 | 1410.32 | 921 | 894 | 229.7 |
| A | 4 | 3 | 64275 | 275.92 | 921 | 894 | 229.7 |
| B | 5 | 236 | 753622 | 3865.22 | 915 | 884 | 194.7 |
| B | 0 | 199 | 66967 | 339.33 | 915 | 884 | 194.7 |
| B | 4 | 169 | 50986 | 257.27 | 915 | 884 | 194.7 |
| C | 13 | 3 | 1627569 | 6809.13 | 879 | 871 | 238.9 |
| C | 12 | 2 | 408260 | 1705.27 | 879 | 871 | 238.9 |
| C | 9 | 237 | 351109 | 1466.05 | 879 | 871 | 238.9 |
| D | 11 | 129 | 821143 | 3271.02 | 890 | 851 | 250.8 |
| D | 2 | 249 | 264778 | 1052.44 | 890 | 851 | 250.8 |
| D | 15 | 125 | 216525 | 860.03 | 890 | 851 | 250.8 |
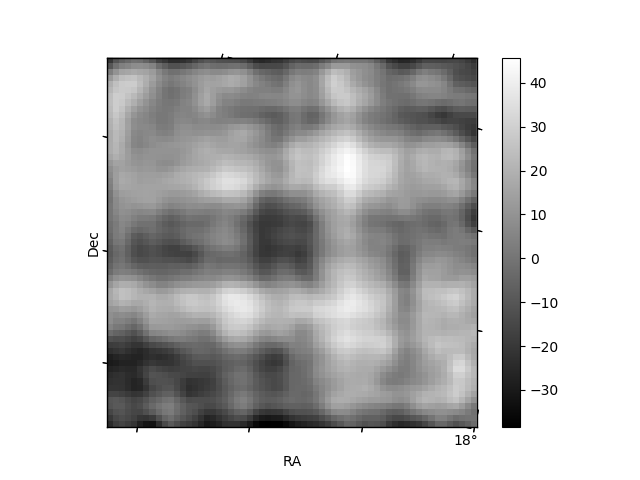
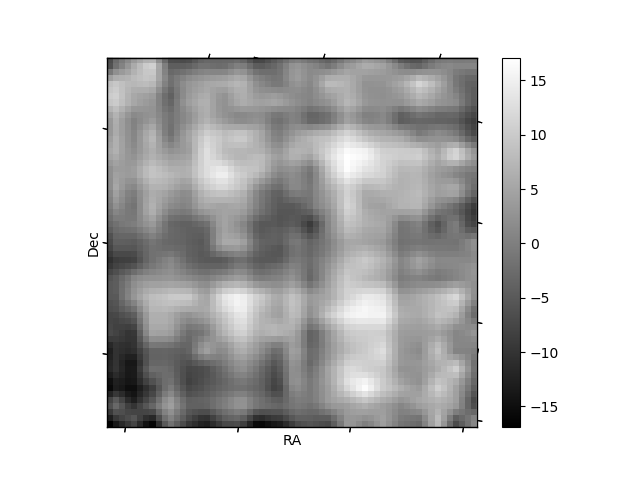
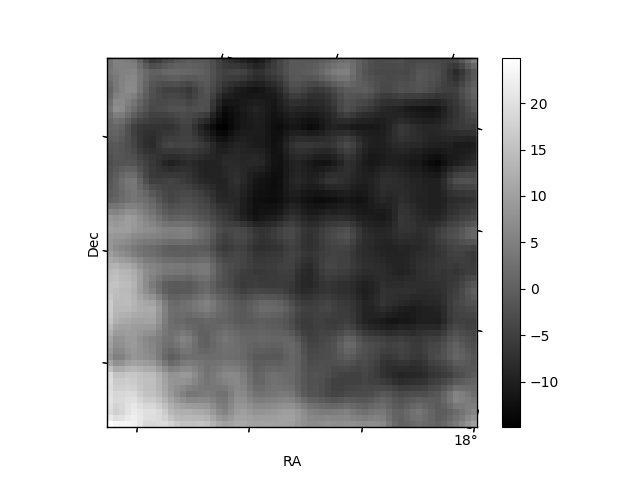
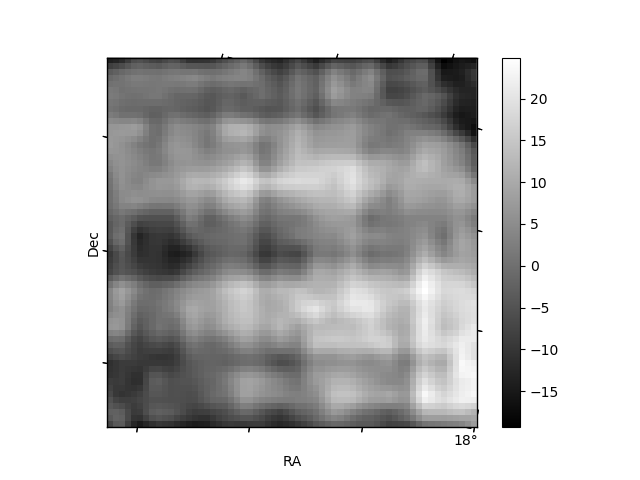
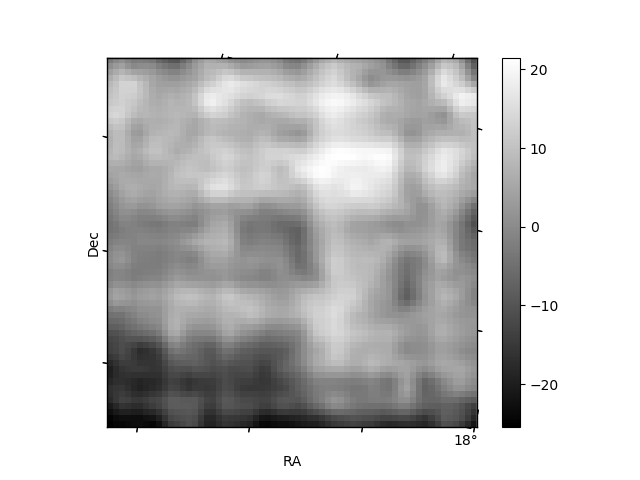
Histogram calculated using DETX and DETY for each event in the final _common_clean file
| Quadrant A | 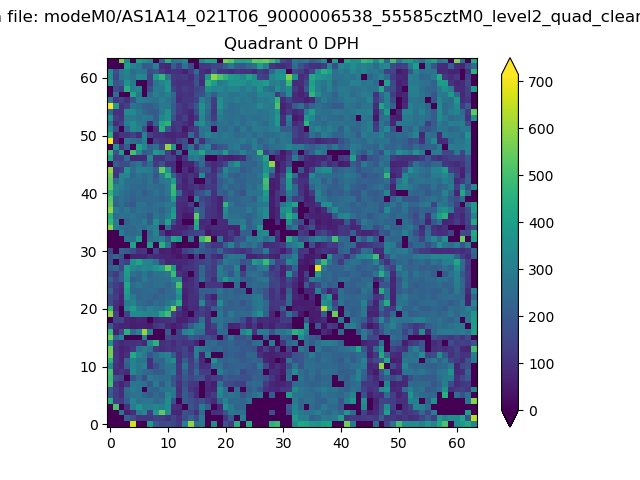 |
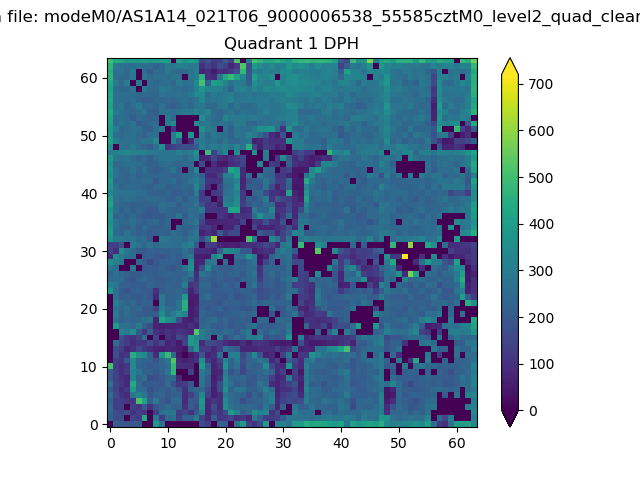 |
Quadrant B |
|---|---|---|---|
| Quadrant D | 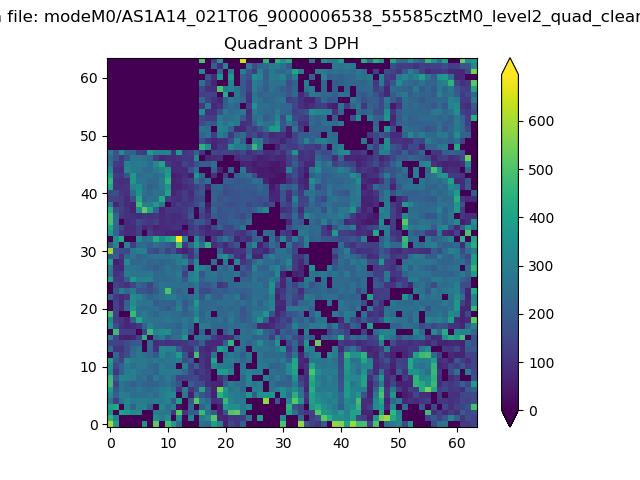 |
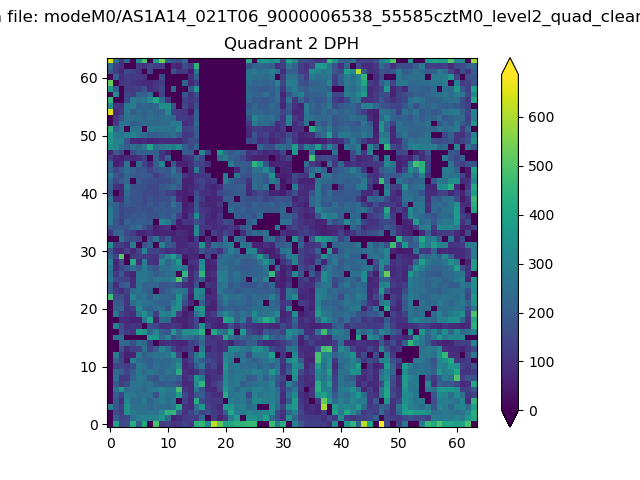 |
Quadrant C |
| Plot type | Count rate plots | Images |
|---|---|---|
| Comparison with Poisson distribution Blue bars denote a histogram of data divided into 1 sec bins. Red curve is a Poisson curve with rate = median count rate of data. |
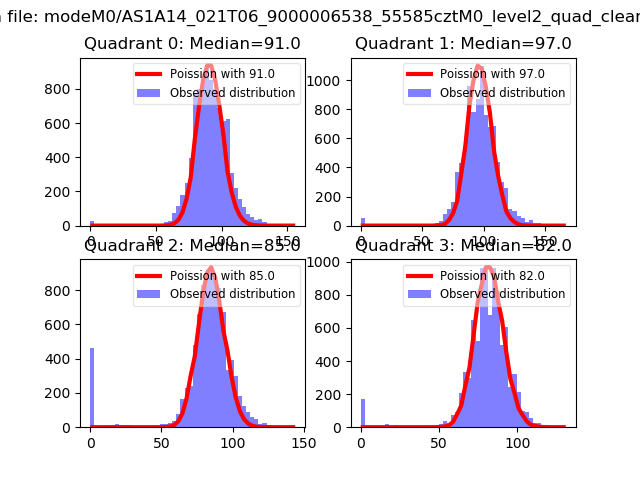 |
 |
| Quadrant-wise count rates Data is divided into 100 sec bins |
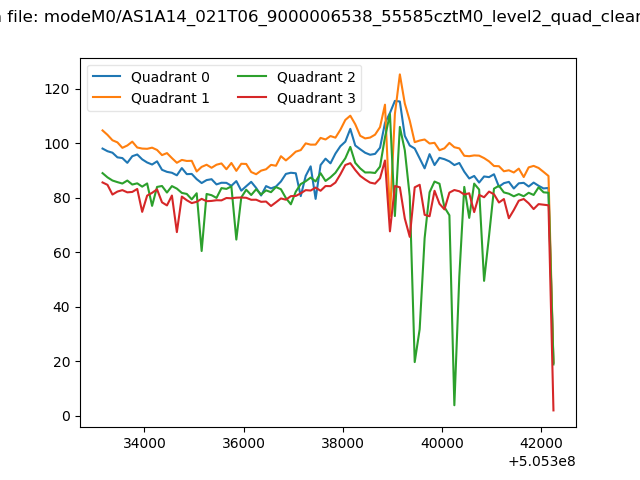 |
|
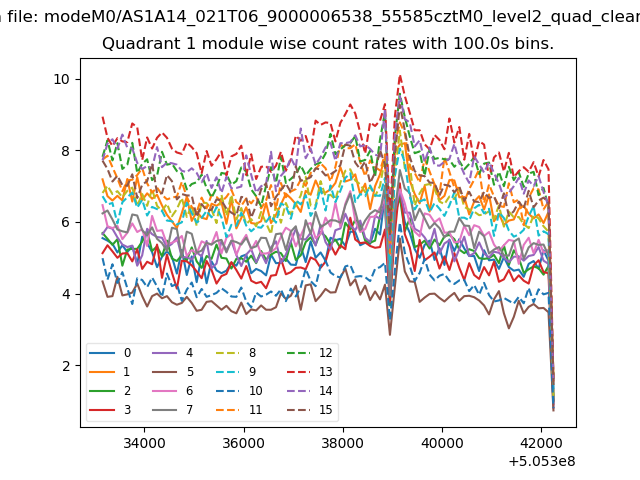
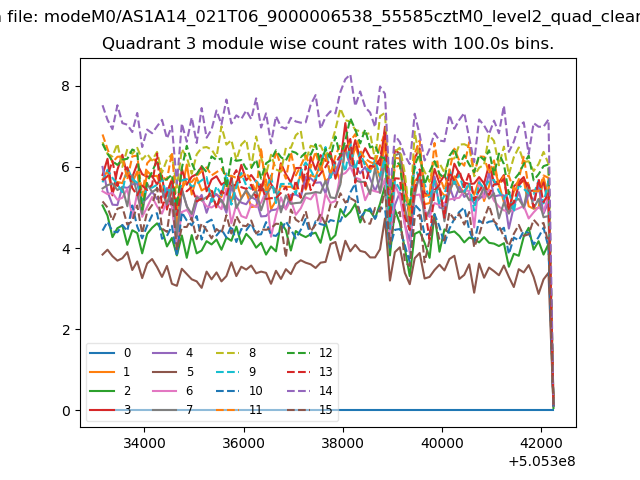
| Module-wise count rates for Quadrant A Data is divided into 100 sec bins |
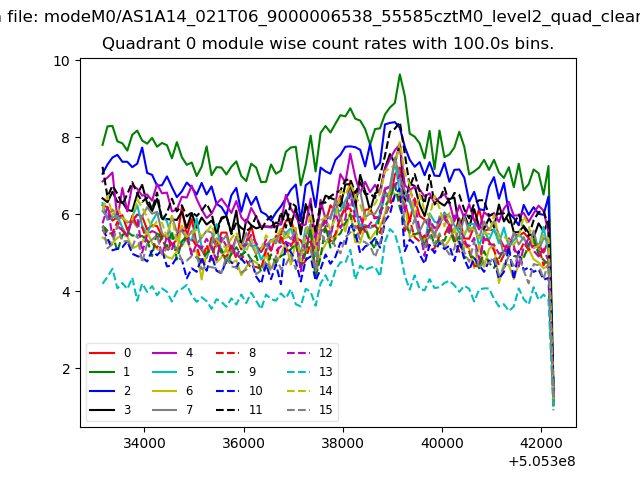 |
 |
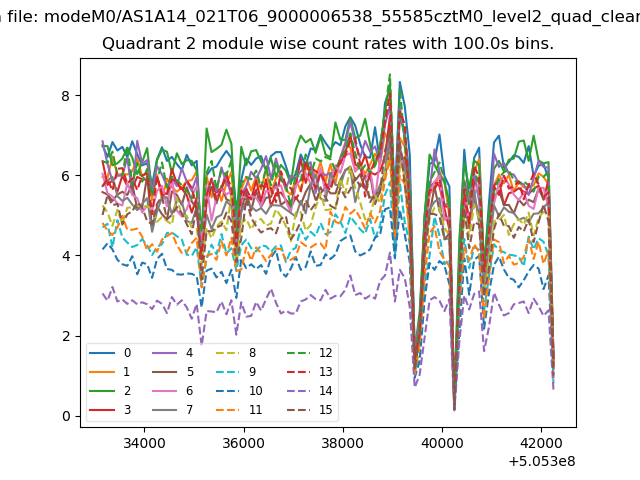
| Module-wise count rates for Quadrant B Data is divided into 100 sec bins |
 |
 |
| Module-wise count rates for Quadrant C Data is divided into 100 sec bins |
 |
 |
| Module-wise count rates for Quadrant D Data is divided into 100 sec bins |
 |
 |
| Parameter | Plot |
|---|---|
| CZT HV Monitor | 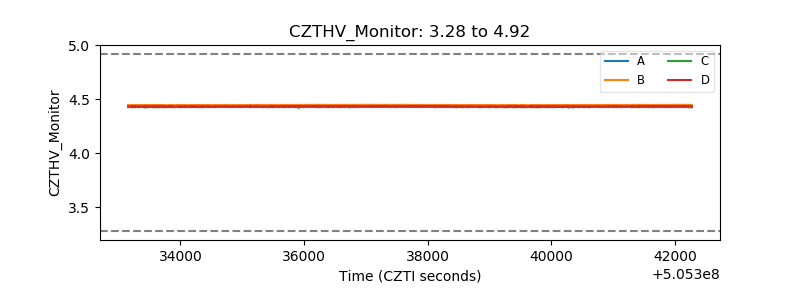 |
| D_VDD | 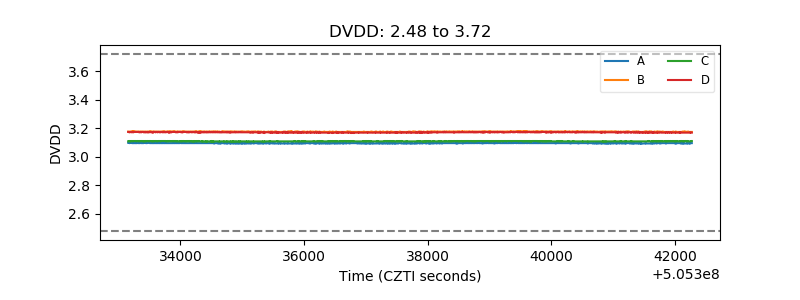 |
| Temperature 1 | 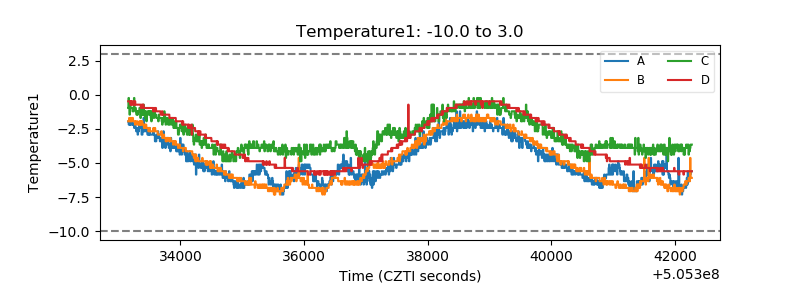 |
| Veto HV Monitor | 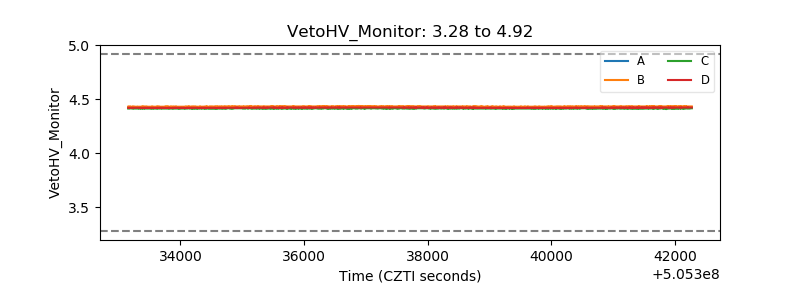 |
| Veto LLD | 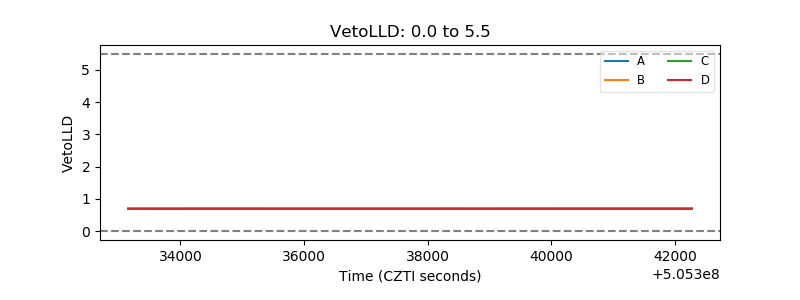 |
| Alpha Counter | 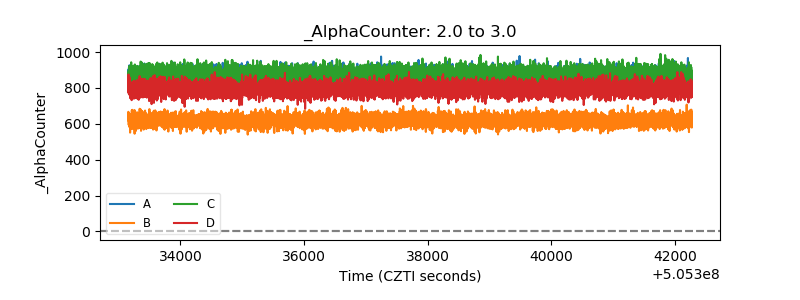 |
| _CPM_Rate | 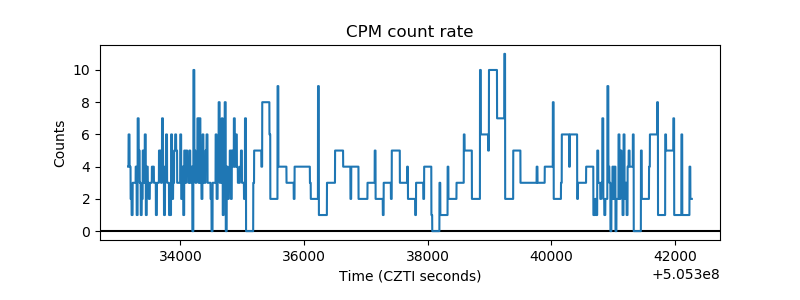 |
| CZT Counter | 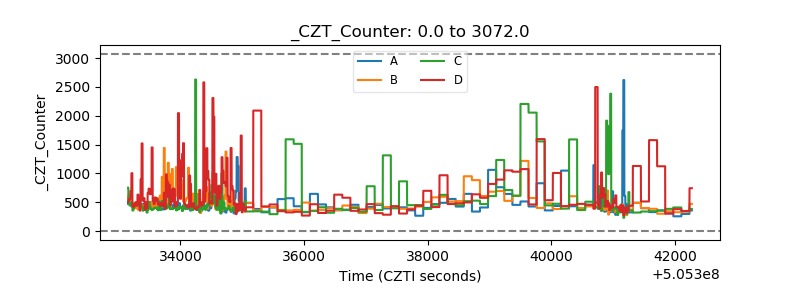 |
| +2.5 Volts monitor | 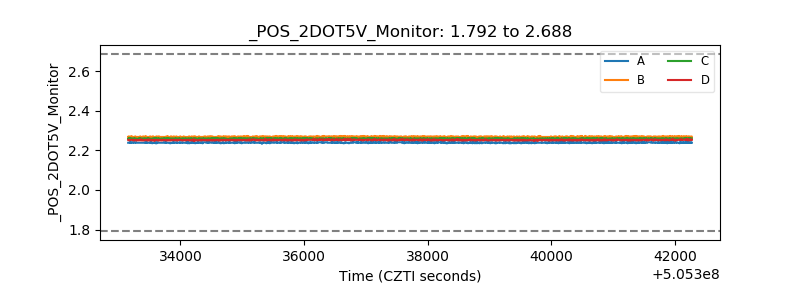 |
| +5 Volts monitor | 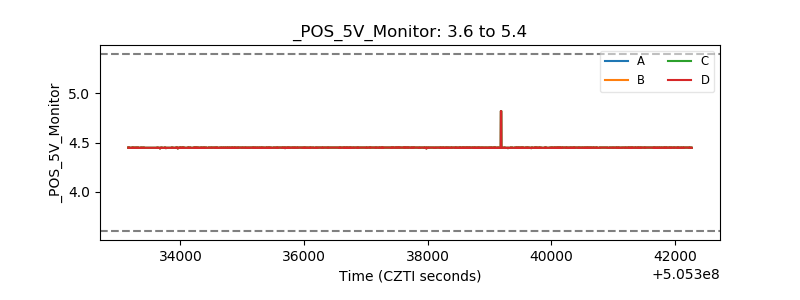 |
| _ROLL_ROT | 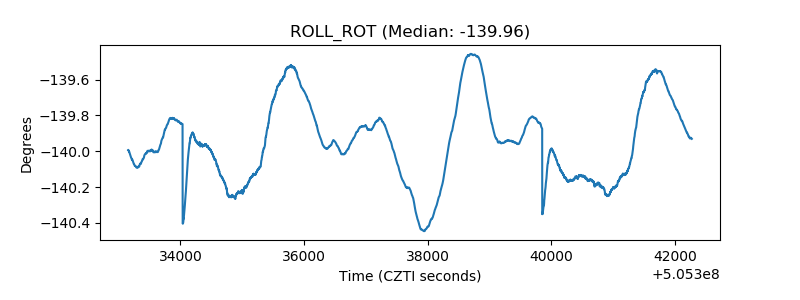 |
| _Roll_DEC | 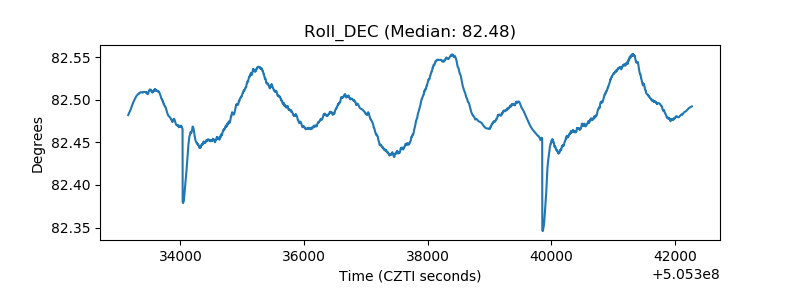 |
| _Roll_RA | 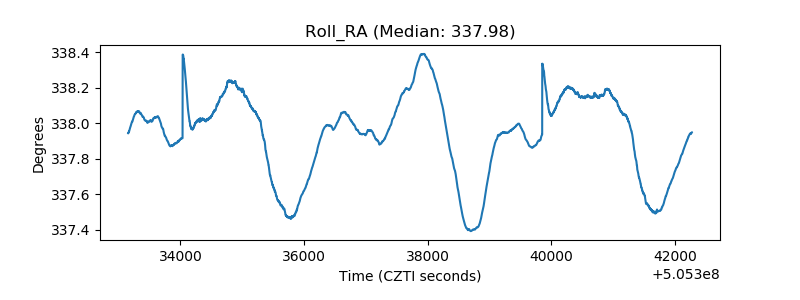 |
| Veto Counter | 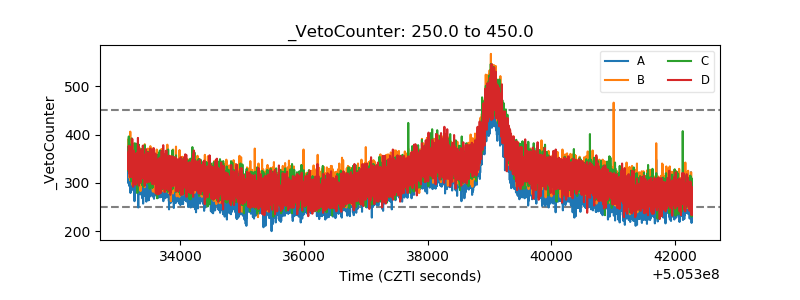 |