| Param | Original file | Final file |
|---|---|---|
| Filename | modeM0/AS1A14_021T06_9000006538_55587cztM0_level2.fits | modeM0/AS1A14_021T06_9000006538_55587cztM0_level2_quad_clean.evt |
| Size (bytes) | 422,959,680 | 99,555,840 |
| Size | 403.4 MB | 94.9 MB |
| Events in quadrant A | 4,837,118 | 615,921 |
| Events in quadrant B | 3,043,377 | 696,953 |
| Events in quadrant C | 3,280,766 | 622,051 |
| Events in quadrant D | 3,942,705 | 584,390 |
| Mode M9 | |||
|---|---|---|---|
| Quadrant | BADHDUFLAG | Total packets | Discarded packets |
| A | 0 | 16 | 0 |
| B | 0 | 16 | 0 |
| C | 0 | 16 | 0 |
| D | 0 | 16 | 0 |
| Mode M0 | |||
|---|---|---|---|
| Quadrant | BADHDUFLAG | Total packets | Discarded packets |
| A | 0 | 19624 | 2 |
| B | 0 | 14707 | 2 |
| C | 0 | 15470 | 2 |
| D | 0 | 16884 | 2 |
| Mode SS | |||
|---|---|---|---|
| Quadrant | BADHDUFLAG | Total packets | Discarded packets |
| A | 0 | 148 | 0 |
| B | 0 | 148 | 0 |
| C | 0 | 148 | 0 |
| D | 0 | 148 | 0 |
| Quadrant | Total seconds | Saturated seconds | Saturation percentage |
|---|---|---|---|
| A | 7103 | 416 | 5.856680% |
| B | 7102 | 53 | 0.746269% |
| C | 7103 | 78 | 1.098128% |
| D | 7103 | 134 | 1.886527% |
Noise dominated data is calculated using 1-second bins in cleaned event files. If a bin has >2000 counts, and if more than 50% of those come from <1% of pixels, then it is considered to be noise-dominated and hence unusable.
| Quadrant | # 1 sec bins | Bins with >0 counts | Bins with >2000 counts | High rate bins dominated by noise | Noise dominated (total time) | Noise dominated (detector-on time) | Marked lightcurve |
|---|---|---|---|---|---|---|---|
| A | 8783 | 7105 | 356 | 356 | 4.05% | 5.01% | 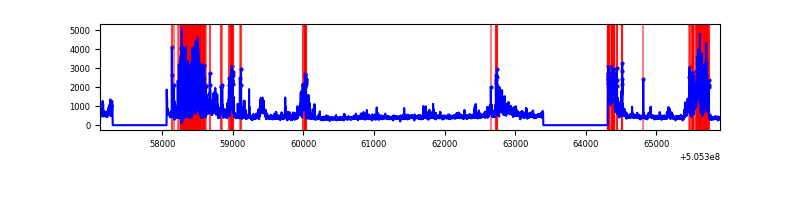 |
| B | 8782 | 7104 | 23 | 23 | 0.26% | 0.32% | 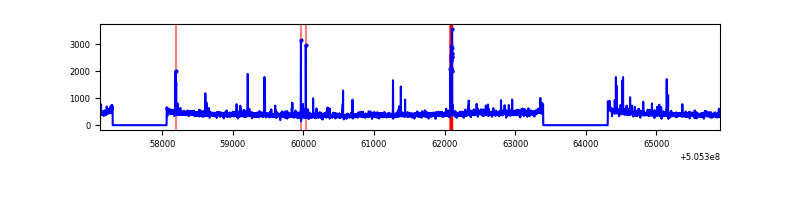 |
| C | 8783 | 7105 | 55 | 55 | 0.63% | 0.77% | 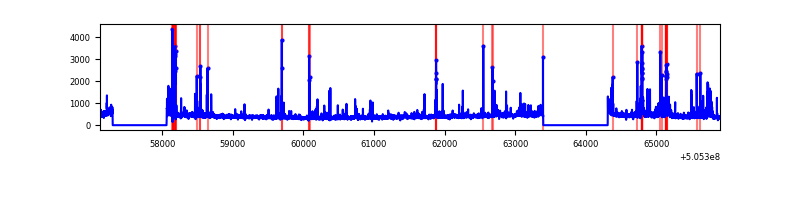 |
| D | 8783 | 7105 | 159 | 159 | 1.81% | 2.24% | 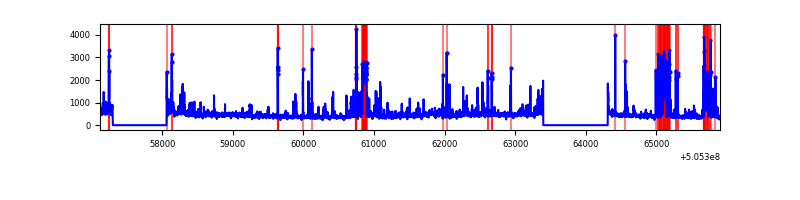 |
Top three noisy pixels from each quadrant. If the there are fewer than three noisy pixels in the level2.evt file, extra rows are filled as -1
| Pixel properties | Quadrant properties | ||||||
|---|---|---|---|---|---|---|---|
| Quadrant | DetID | PixID | Counts | Sigma | Mean | Median | Sigma |
| A | 12 | 115 | 1681185 | 9588.66 | 704 | 685 | 175.3 |
| A | 8 | 249 | 106660 | 604.68 | 704 | 685 | 175.3 |
| A | 0 | 8 | 98050 | 555.55 | 704 | 685 | 175.3 |
| B | 4 | 169 | 90782 | 585.45 | 717 | 690 | 153.9 |
| B | 0 | 182 | 30528 | 193.9 | 717 | 690 | 153.9 |
| B | 7 | 252 | 30050 | 190.79 | 717 | 690 | 153.9 |
| C | 13 | 3 | 142736 | 739.9 | 703 | 696 | 192.0 |
| C | 12 | 252 | 140591 | 728.72 | 703 | 696 | 192.0 |
| C | 6 | 223 | 92666 | 479.08 | 703 | 696 | 192.0 |
| D | 8 | 160 | 401886 | 2013.28 | 697 | 665 | 199.3 |
| D | 11 | 129 | 341693 | 1711.24 | 697 | 665 | 199.3 |
| D | 5 | 113 | 108263 | 539.91 | 697 | 665 | 199.3 |
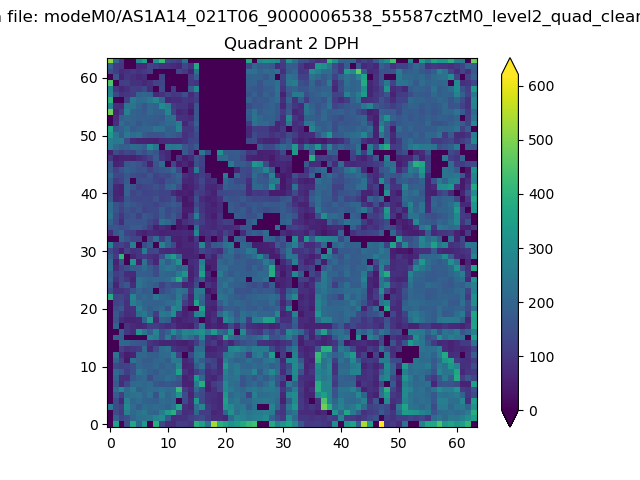
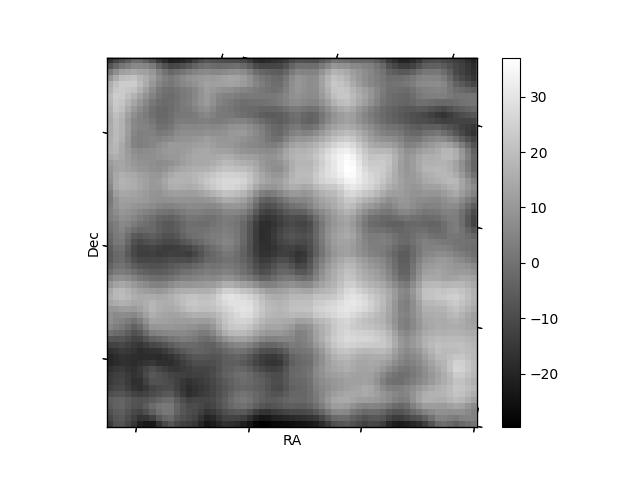
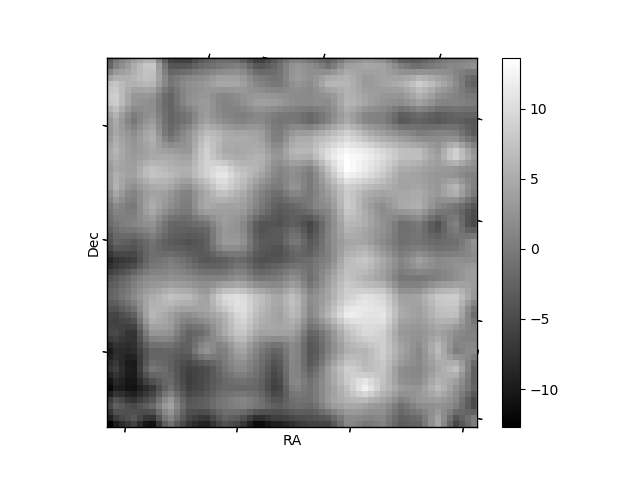
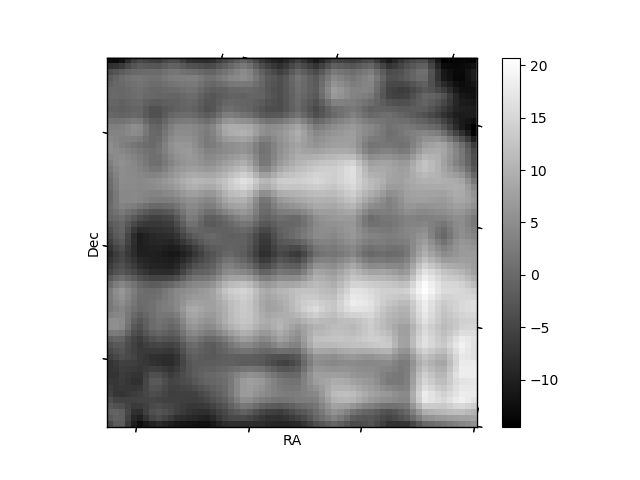
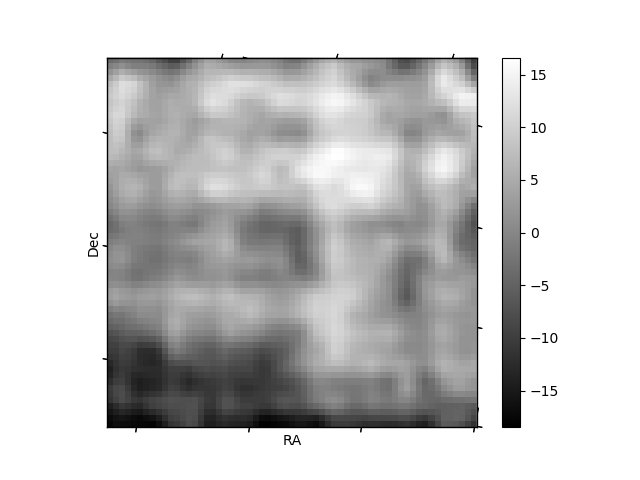
Histogram calculated using DETX and DETY for each event in the final _common_clean file
| Quadrant A | 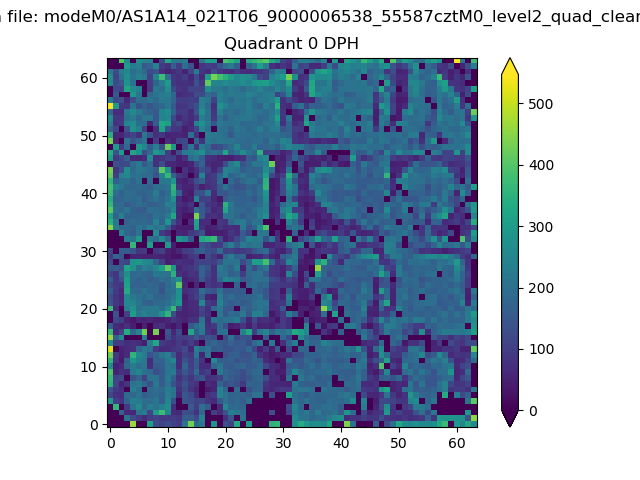 |
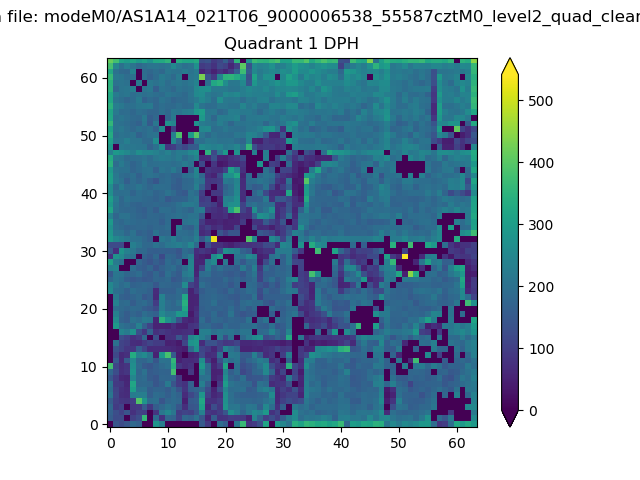 |
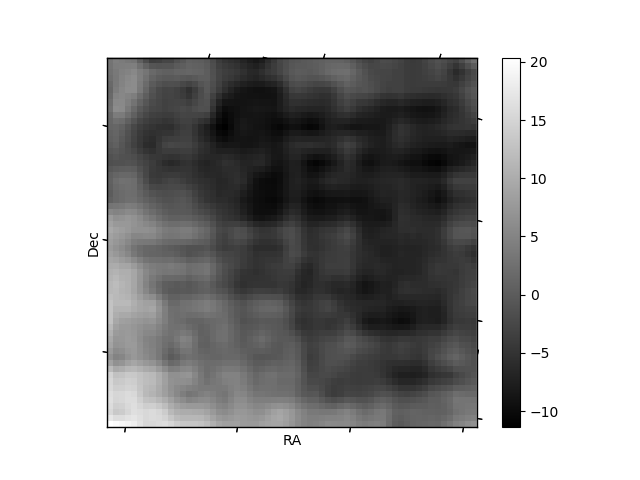
Quadrant B |
|---|---|---|---|
| Quadrant D | 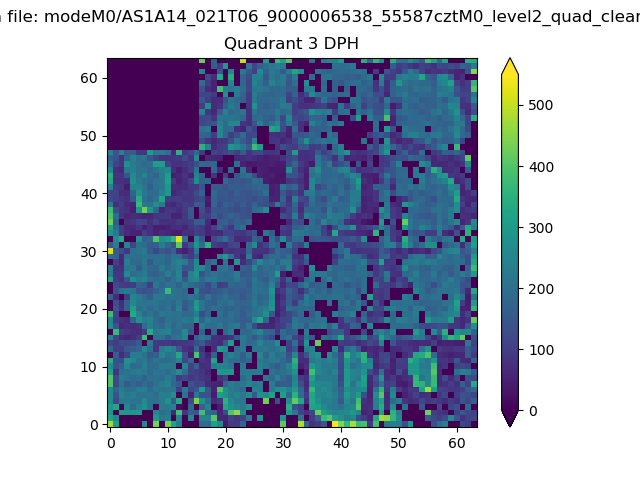 |
 |
Quadrant C |
| Plot type | Count rate plots | Images |
|---|---|---|
| Comparison with Poisson distribution Blue bars denote a histogram of data divided into 1 sec bins. Red curve is a Poisson curve with rate = median count rate of data. |
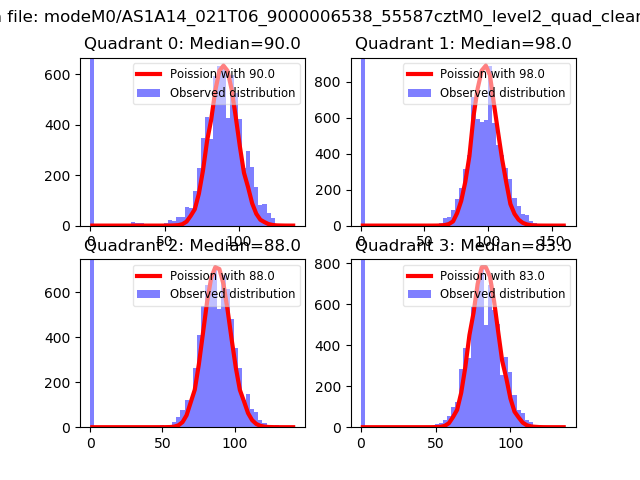 |
 |
| Quadrant-wise count rates Data is divided into 100 sec bins |
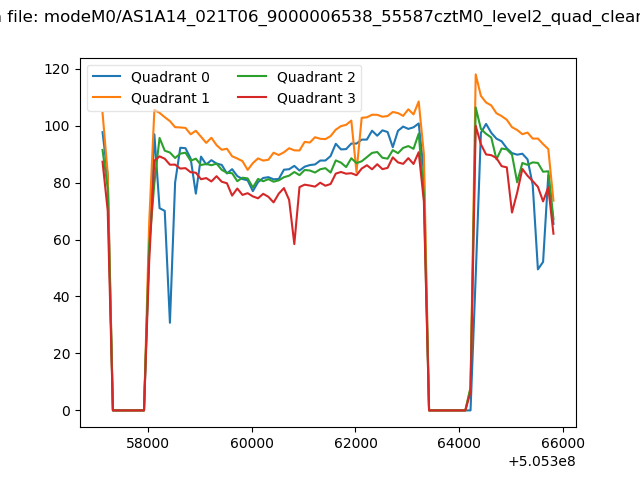 |
|
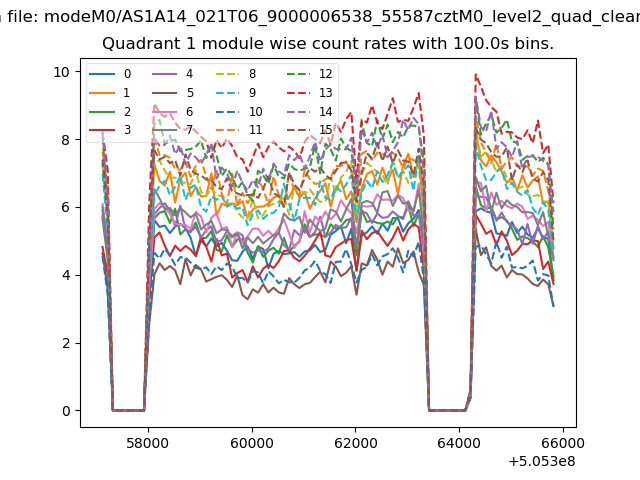
| Module-wise count rates for Quadrant A Data is divided into 100 sec bins |
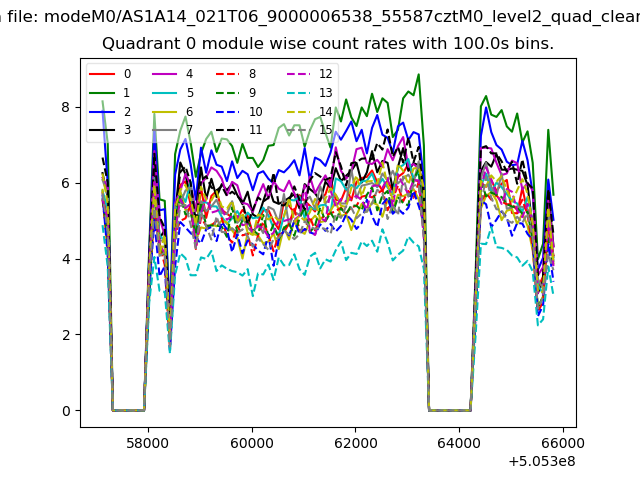 |
 |
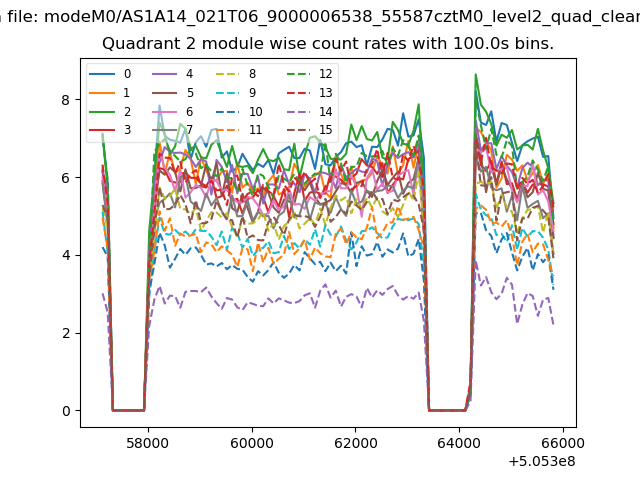
| Module-wise count rates for Quadrant B Data is divided into 100 sec bins |
 |
 |
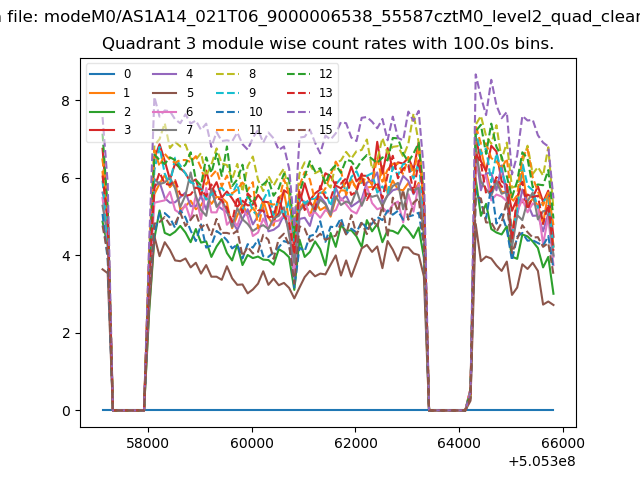
| Module-wise count rates for Quadrant C Data is divided into 100 sec bins |
 |
 |
| Module-wise count rates for Quadrant D Data is divided into 100 sec bins |
 |
 |
| Parameter | Plot |
|---|---|
| CZT HV Monitor | 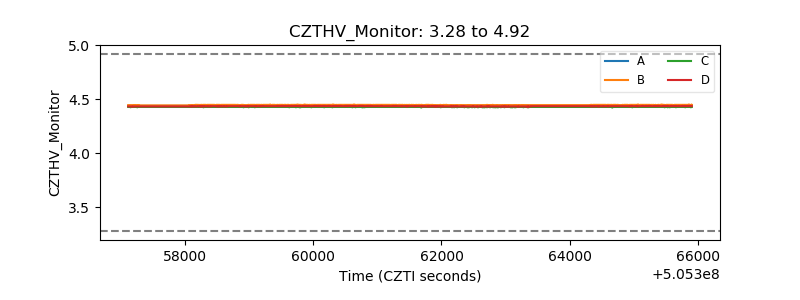 |
| D_VDD | 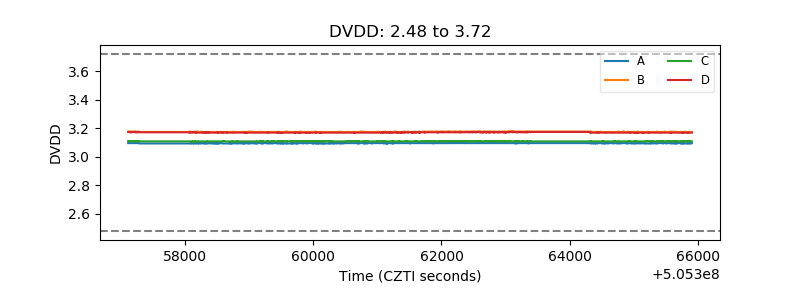 |
| Temperature 1 | 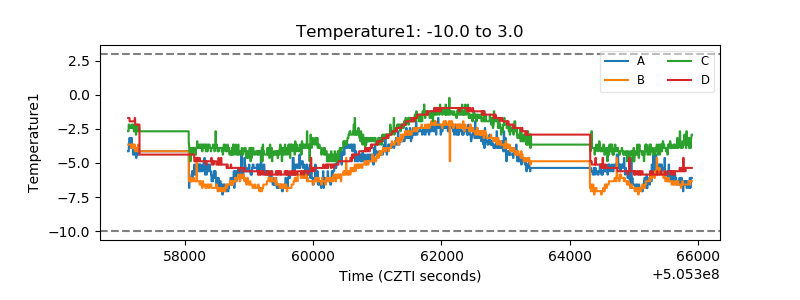 |
| Veto HV Monitor | 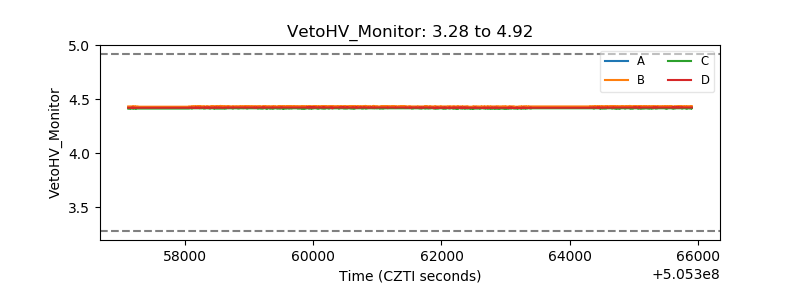 |
| Veto LLD | 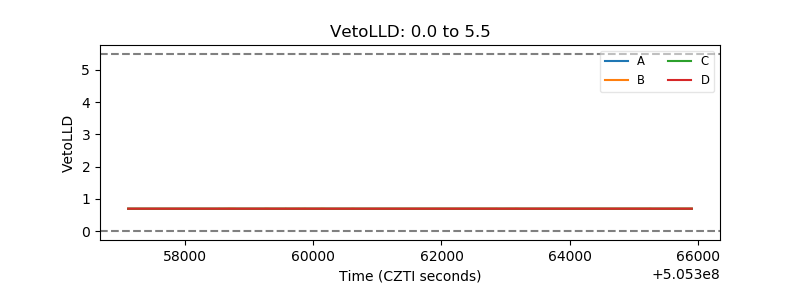 |
| Alpha Counter | 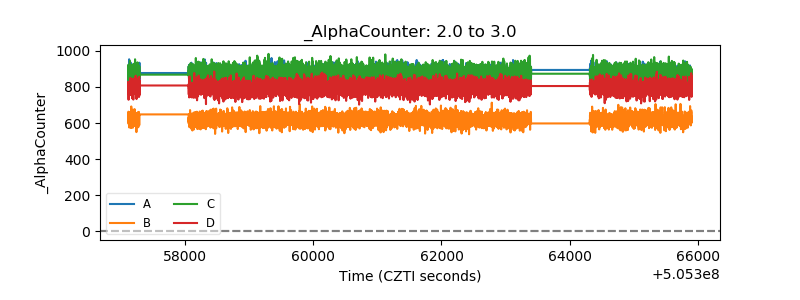 |
| _CPM_Rate | 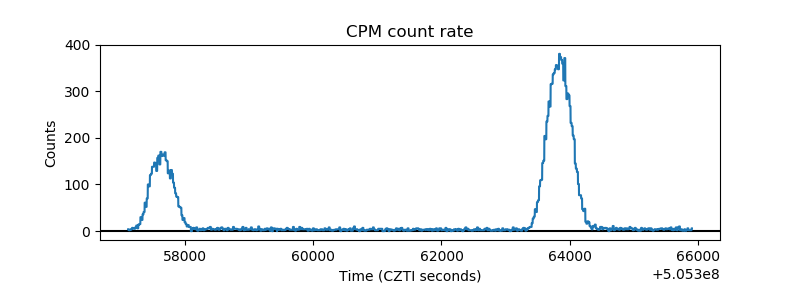 |
| CZT Counter | 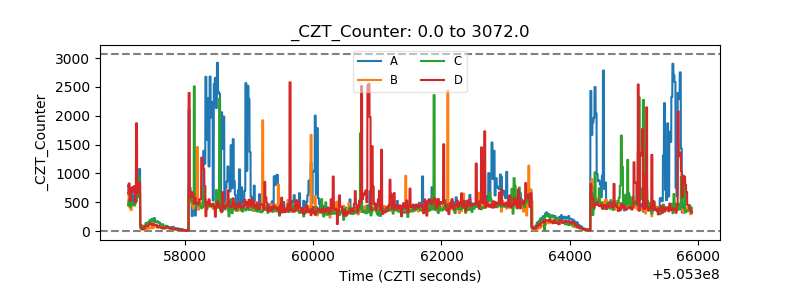 |
| +2.5 Volts monitor |  |
| +5 Volts monitor |  |
| _ROLL_ROT | 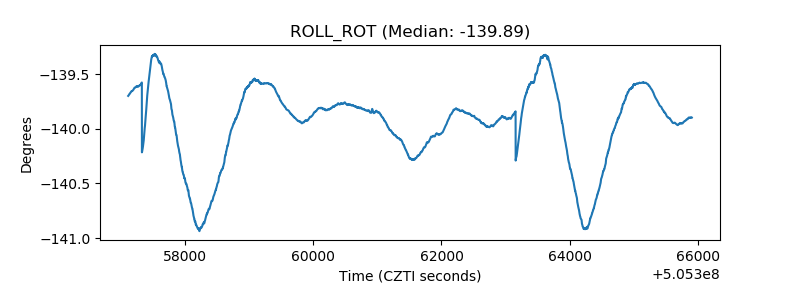 |
| _Roll_DEC | 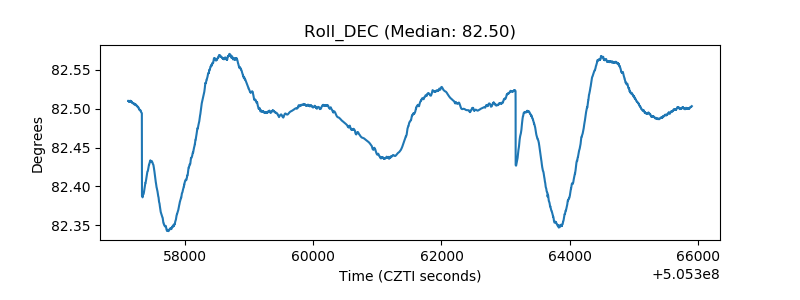 |
| _Roll_RA | 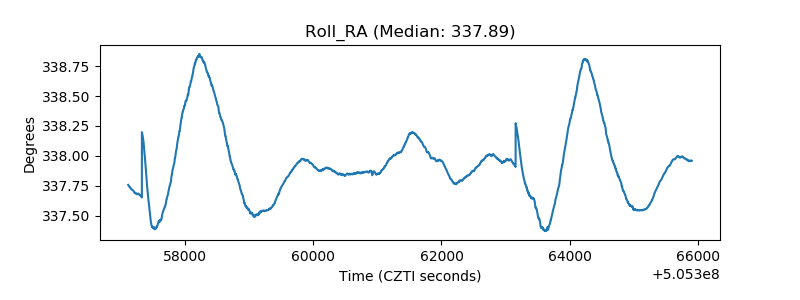 |
| Veto Counter | 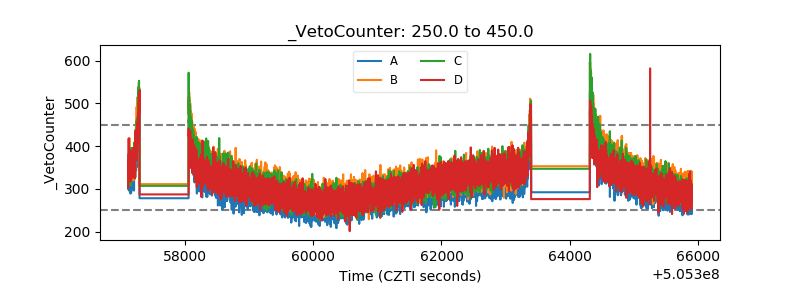 |