| Param | Original file | Final file |
|---|---|---|
| Filename | modeM0/AS1A14_021T06_9000006538_55589cztM0_level2.fits | modeM0/AS1A14_021T06_9000006538_55589cztM0_level2_quad_clean.evt |
| Size (bytes) | 412,240,320 | 88,061,760 |
| Size | 393.1 MB | 84.0 MB |
| Events in quadrant A | 4,244,491 | 552,662 |
| Events in quadrant B | 2,613,930 | 627,777 |
| Events in quadrant C | 4,394,991 | 529,681 |
| Events in quadrant D | 3,517,330 | 517,552 |
| Mode M9 | |||
|---|---|---|---|
| Quadrant | BADHDUFLAG | Total packets | Discarded packets |
| A | 0 | 10 | 0 |
| B | 0 | 10 | 0 |
| C | 0 | 10 | 0 |
| D | 0 | 10 | 0 |
| Mode M0 | |||
|---|---|---|---|
| Quadrant | BADHDUFLAG | Total packets | Discarded packets |
| A | 0 | 17262 | 1 |
| B | 0 | 12792 | 1 |
| C | 0 | 17653 | 2 |
| D | 0 | 15307 | 1 |
| Mode SS | |||
|---|---|---|---|
| Quadrant | BADHDUFLAG | Total packets | Discarded packets |
| A | 0 | 128 | 0 |
| B | 0 | 128 | 0 |
| C | 0 | 128 | 0 |
| D | 0 | 128 | 0 |
| Quadrant | Total seconds | Saturated seconds | Saturation percentage |
|---|---|---|---|
| A | 6284 | 385 | 6.126671% |
| B | 6284 | 20 | 0.318269% |
| C | 6283 | 403 | 6.414133% |
| D | 6284 | 118 | 1.877785% |
Noise dominated data is calculated using 1-second bins in cleaned event files. If a bin has >2000 counts, and if more than 50% of those come from <1% of pixels, then it is considered to be noise-dominated and hence unusable.
| Quadrant | # 1 sec bins | Bins with >0 counts | Bins with >2000 counts | High rate bins dominated by noise | Noise dominated (total time) | Noise dominated (detector-on time) | Marked lightcurve |
|---|---|---|---|---|---|---|---|
| A | 7324 | 6285 | 337 | 337 | 4.60% | 5.36% | 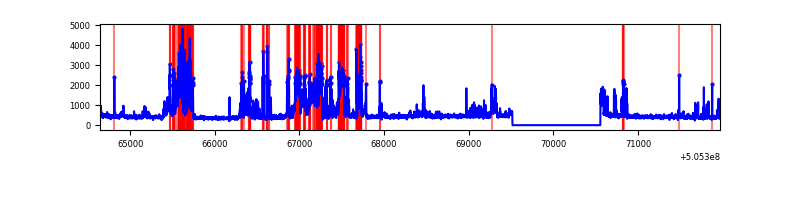 |
| B | 7324 | 6285 | 2 | 2 | 0.03% | 0.03% | 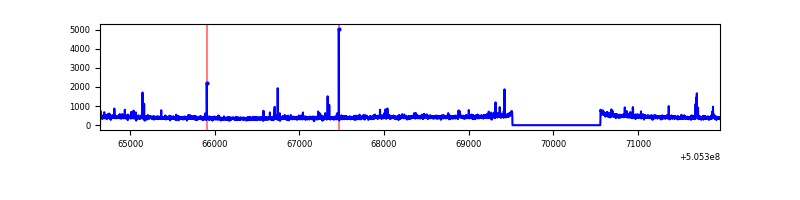 |
| C | 7323 | 6284 | 371 | 371 | 5.07% | 5.90% |  |
| D | 7324 | 6285 | 142 | 142 | 1.94% | 2.26% | 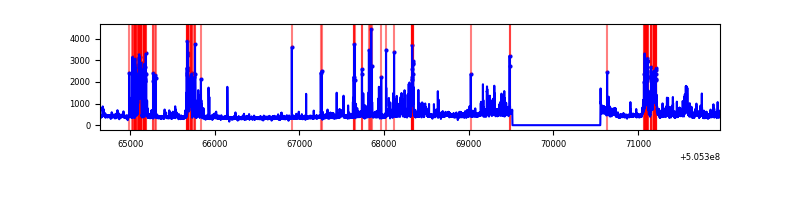 |
Top three noisy pixels from each quadrant. If the there are fewer than three noisy pixels in the level2.evt file, extra rows are filled as -1
| Pixel properties | Quadrant properties | ||||||
|---|---|---|---|---|---|---|---|
| Quadrant | DetID | PixID | Counts | Sigma | Mean | Median | Sigma |
| A | 12 | 115 | 1337096 | 8679.54 | 623 | 608 | 154.0 |
| A | 0 | 8 | 245991 | 1593.59 | 623 | 608 | 154.0 |
| A | 8 | 249 | 154373 | 998.59 | 623 | 608 | 154.0 |
| B | 4 | 169 | 29445 | 213.19 | 631 | 607 | 135.3 |
| B | 5 | 172 | 23191 | 166.95 | 631 | 607 | 135.3 |
| B | 10 | 247 | 19657 | 140.83 | 631 | 607 | 135.3 |
| C | 9 | 38 | 1195273 | 7171.26 | 601 | 594 | 166.6 |
| C | 12 | 252 | 237464 | 1421.85 | 601 | 594 | 166.6 |
| C | 12 | 2 | 204282 | 1222.67 | 601 | 594 | 166.6 |
| D | 11 | 129 | 321801 | 1857.24 | 607 | 578 | 173.0 |
| D | 6 | 42 | 249404 | 1438.65 | 607 | 578 | 173.0 |
| D | 8 | 160 | 210203 | 1212.0 | 607 | 578 | 173.0 |
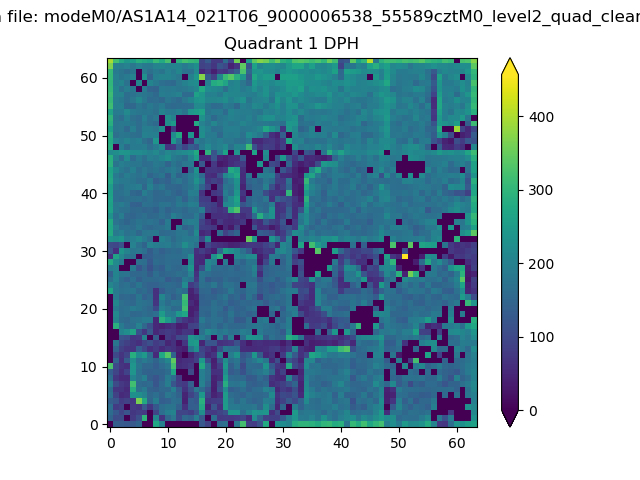
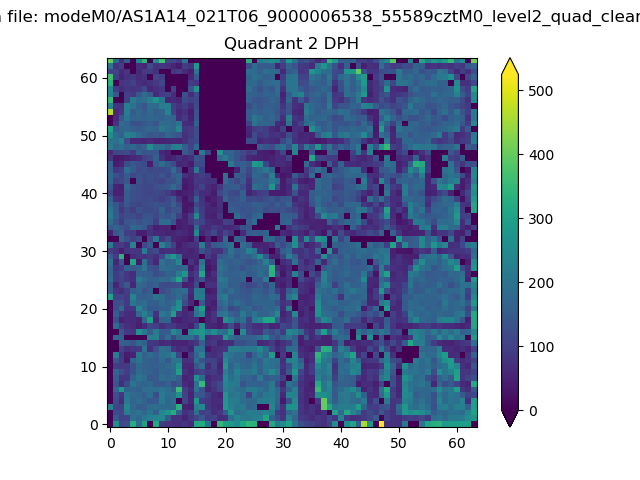
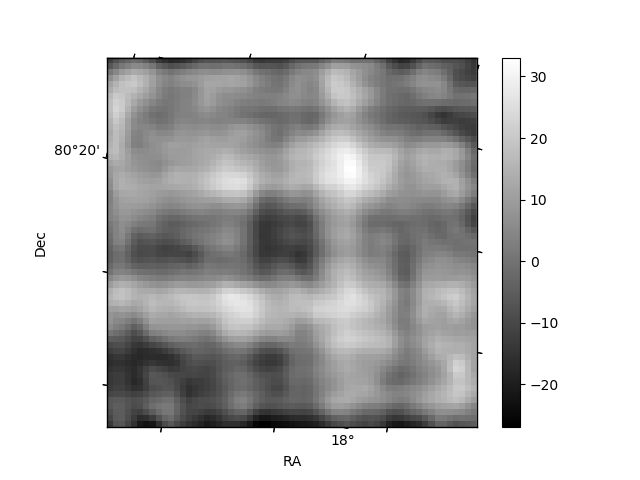
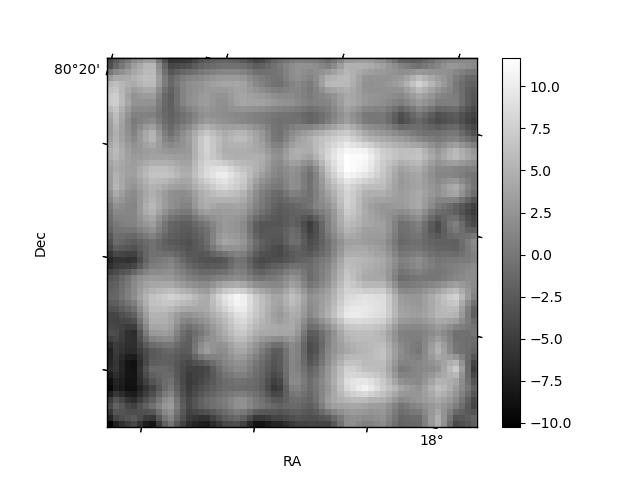
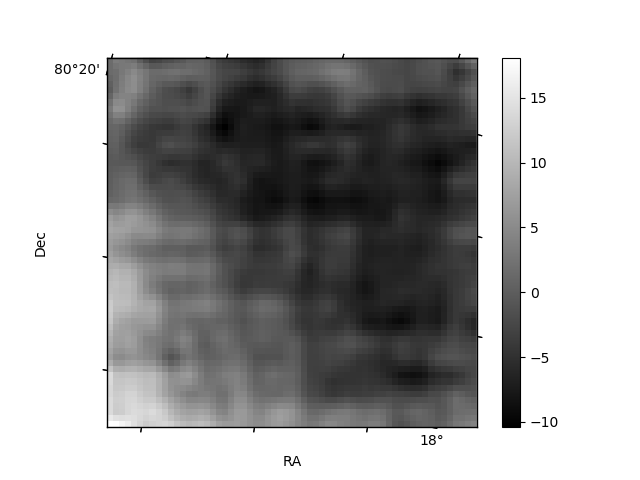
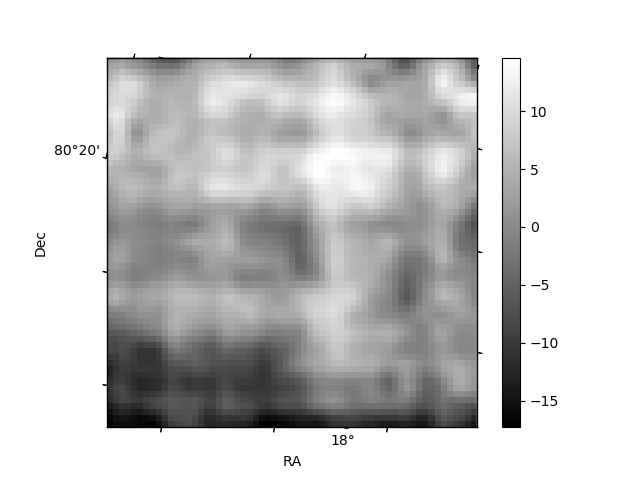
Histogram calculated using DETX and DETY for each event in the final _common_clean file
| Quadrant A | 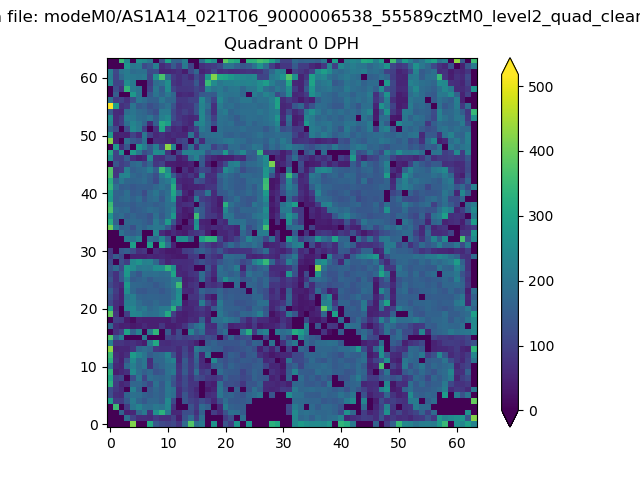 |
 |
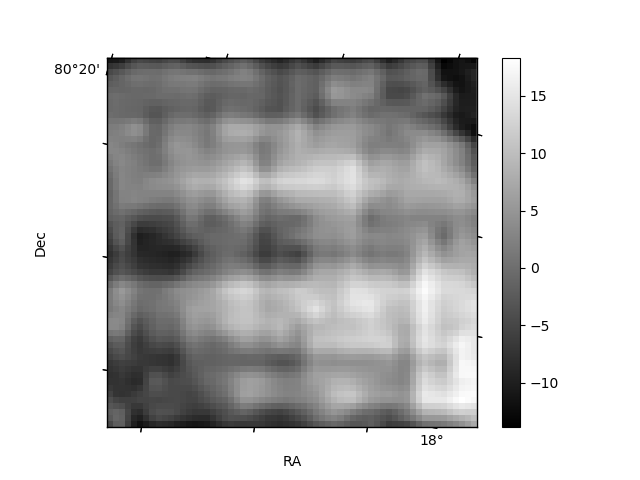
Quadrant B |
|---|---|---|---|
| Quadrant D | 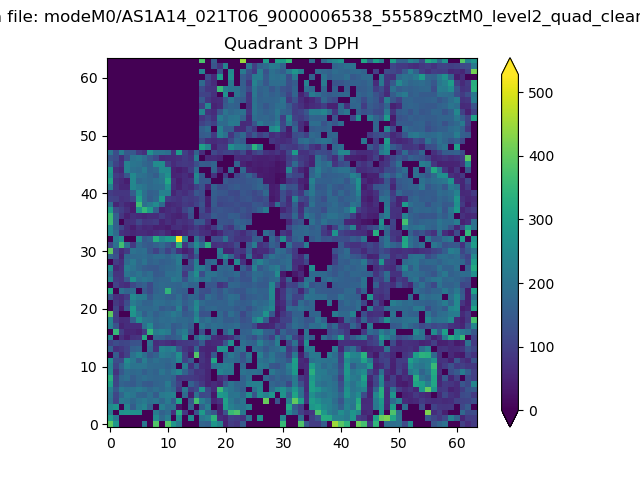 |
 |
Quadrant C |
| Plot type | Count rate plots | Images |
|---|---|---|
| Comparison with Poisson distribution Blue bars denote a histogram of data divided into 1 sec bins. Red curve is a Poisson curve with rate = median count rate of data. |
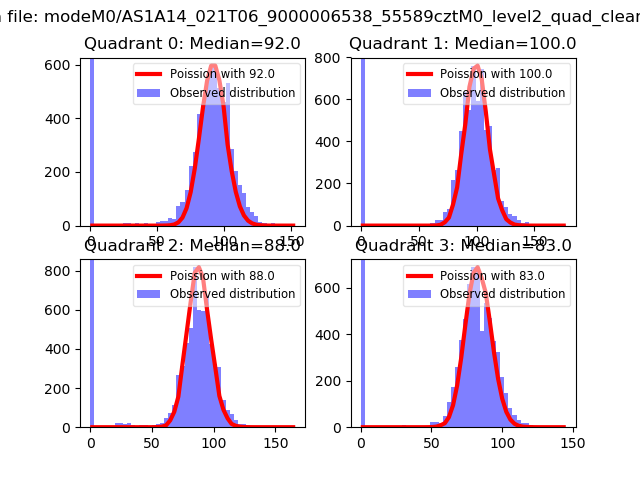 |
 |
| Quadrant-wise count rates Data is divided into 100 sec bins |
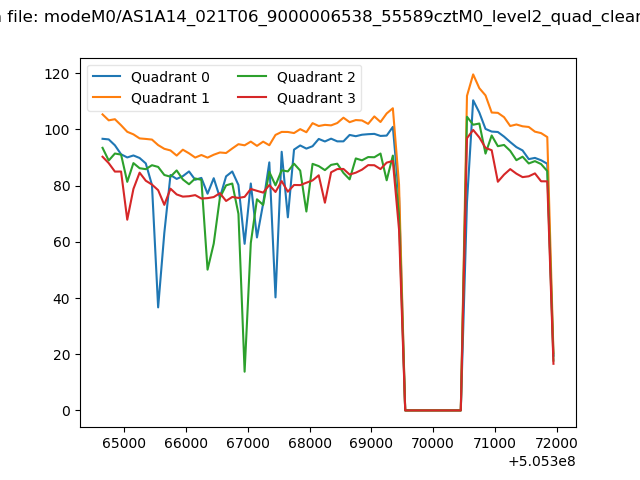 |
|
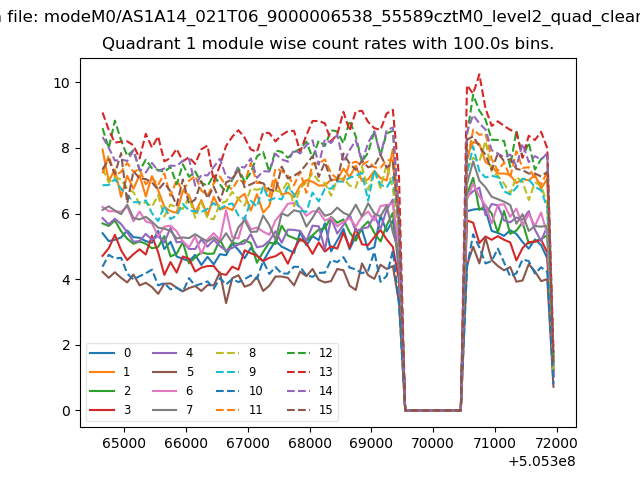
| Module-wise count rates for Quadrant A Data is divided into 100 sec bins |
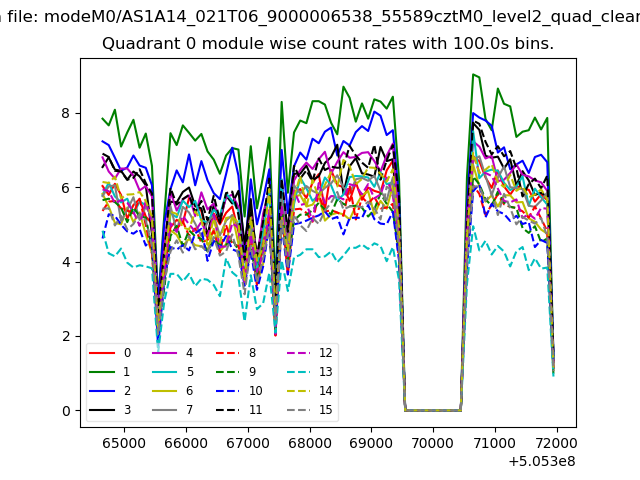 |
 |
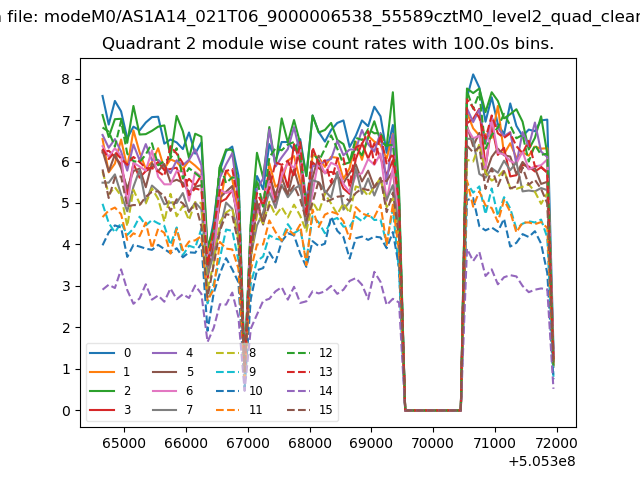
| Module-wise count rates for Quadrant B Data is divided into 100 sec bins |
 |
 |
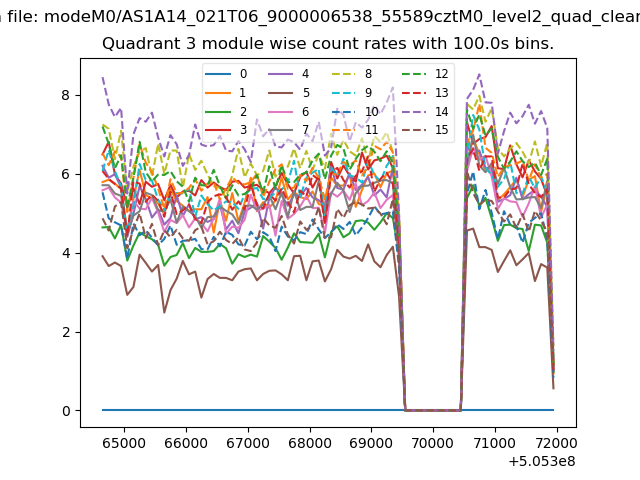
| Module-wise count rates for Quadrant C Data is divided into 100 sec bins |
 |
 |
| Module-wise count rates for Quadrant D Data is divided into 100 sec bins |
 |
 |
| Parameter | Plot |
|---|---|
| CZT HV Monitor | 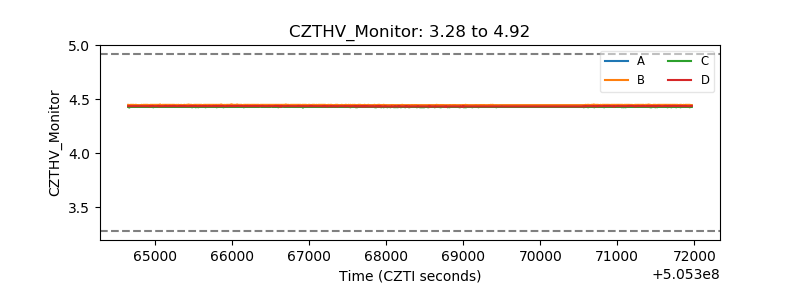 |
| D_VDD | 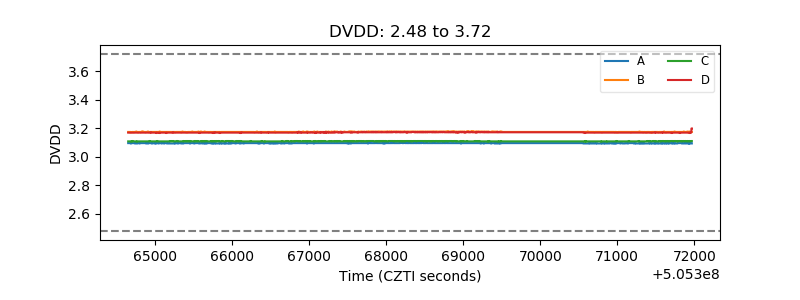 |
| Temperature 1 | 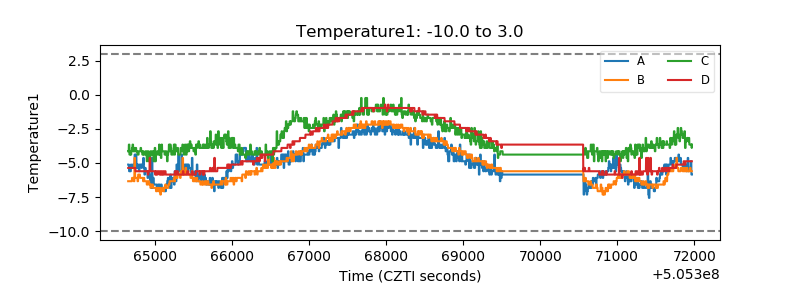 |
| Veto HV Monitor |  |
| Veto LLD | 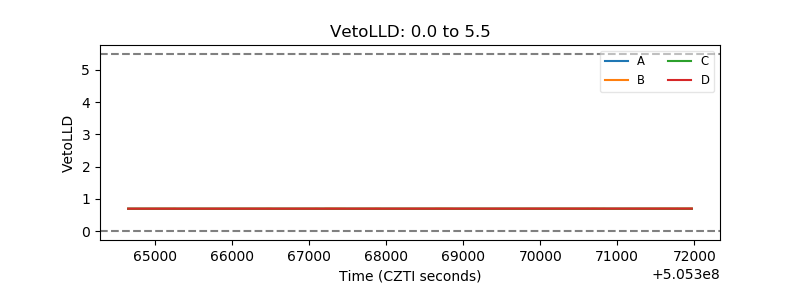 |
| Alpha Counter | 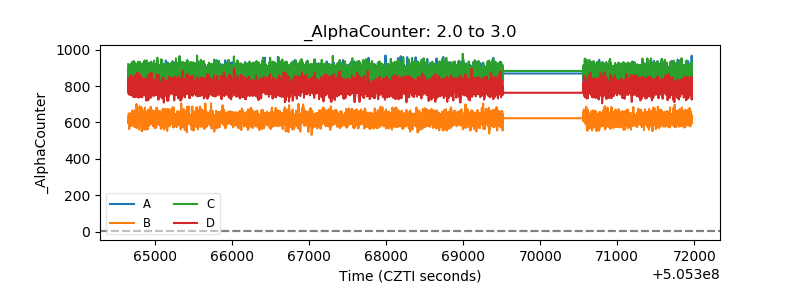 |
| _CPM_Rate | 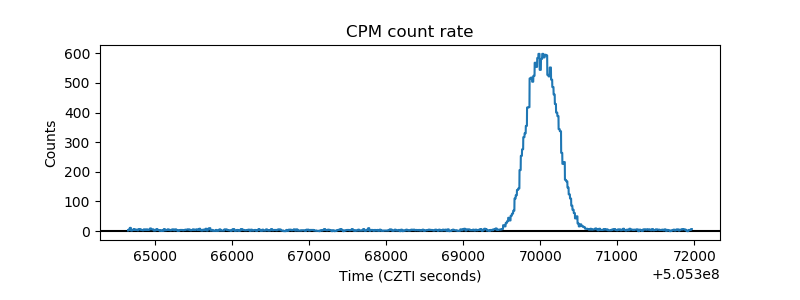 |
| CZT Counter | 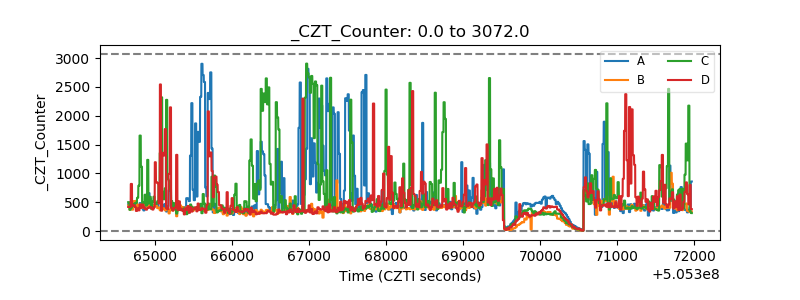 |
| +2.5 Volts monitor | 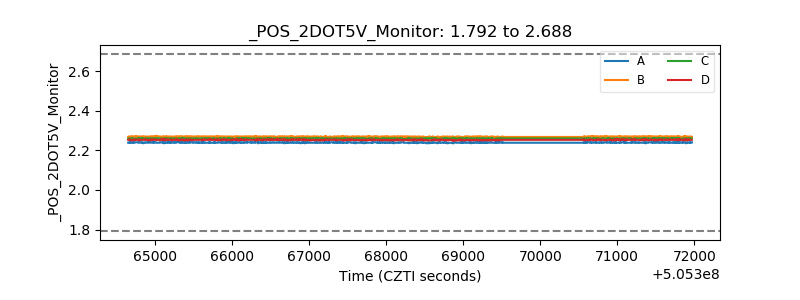 |
| +5 Volts monitor | 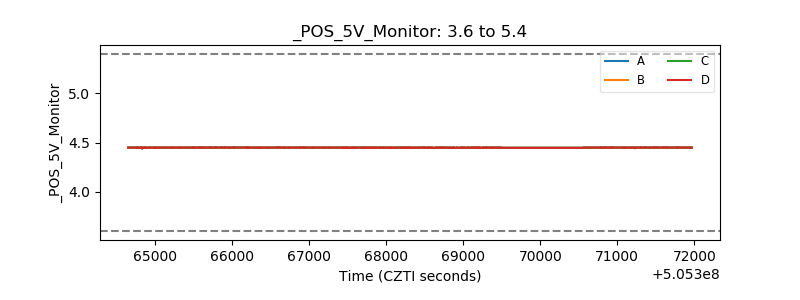 |
| _ROLL_ROT | 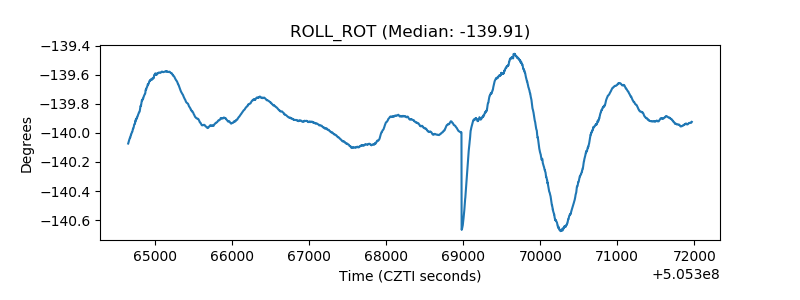 |
| _Roll_DEC | 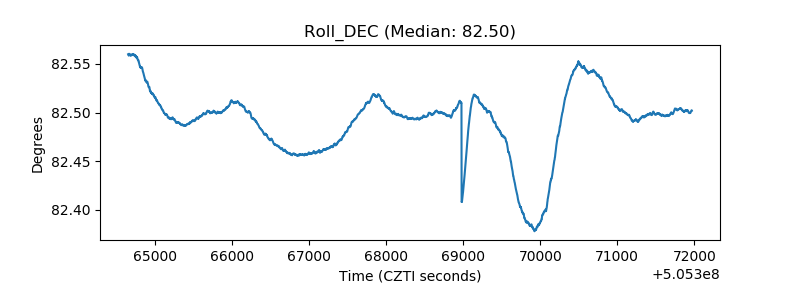 |
| _Roll_RA | 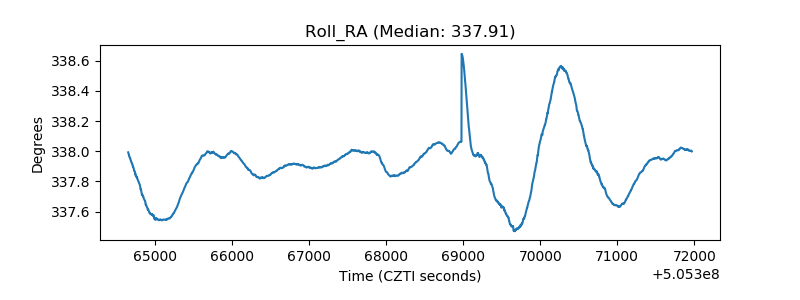 |
| Veto Counter | 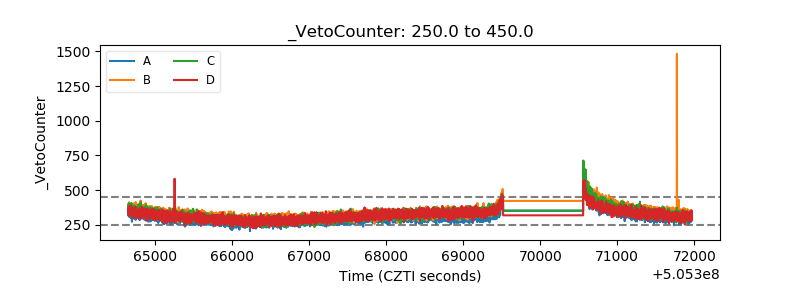 |