| Param | Original file | Final file |
|---|---|---|
| Filename | modeM0/AS1A14_021T06_9000006538_55590cztM0_level2.fits | modeM0/AS1A14_021T06_9000006538_55590cztM0_level2_quad_clean.evt |
| Size (bytes) | 366,082,560 | 85,904,640 |
| Size | 349.1 MB | 81.9 MB |
| Events in quadrant A | 3,364,942 | 553,984 |
| Events in quadrant B | 2,646,999 | 606,405 |
| Events in quadrant C | 3,702,399 | 521,182 |
| Events in quadrant D | 3,372,174 | 502,653 |
| Mode M9 | |||
|---|---|---|---|
| Quadrant | BADHDUFLAG | Total packets | Discarded packets |
| A | 0 | 11 | 0 |
| B | 0 | 11 | 0 |
| C | 0 | 11 | 0 |
| D | 0 | 11 | 0 |
| Mode M0 | |||
|---|---|---|---|
| Quadrant | BADHDUFLAG | Total packets | Discarded packets |
| A | 0 | 14525 | 1 |
| B | 0 | 12551 | 1 |
| C | 0 | 15496 | 1 |
| D | 0 | 14497 | 1 |
| Mode SS | |||
|---|---|---|---|
| Quadrant | BADHDUFLAG | Total packets | Discarded packets |
| A | 0 | 122 | 0 |
| B | 0 | 122 | 0 |
| C | 0 | 122 | 0 |
| D | 0 | 122 | 0 |
| Quadrant | Total seconds | Saturated seconds | Saturation percentage |
|---|---|---|---|
| A | 5965 | 183 | 3.067896% |
| B | 5966 | 75 | 1.257124% |
| C | 5966 | 237 | 3.972511% |
| D | 5966 | 93 | 1.558833% |
Noise dominated data is calculated using 1-second bins in cleaned event files. If a bin has >2000 counts, and if more than 50% of those come from <1% of pixels, then it is considered to be noise-dominated and hence unusable.
| Quadrant | # 1 sec bins | Bins with >0 counts | Bins with >2000 counts | High rate bins dominated by noise | Noise dominated (total time) | Noise dominated (detector-on time) | Marked lightcurve |
|---|---|---|---|---|---|---|---|
| A | 7055 | 5966 | 109 | 109 | 1.55% | 1.83% | 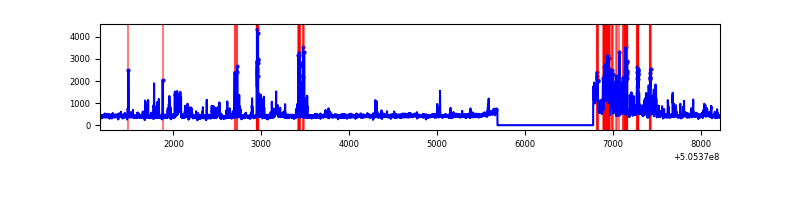 |
| B | 7056 | 5967 | 15 | 15 | 0.21% | 0.25% | 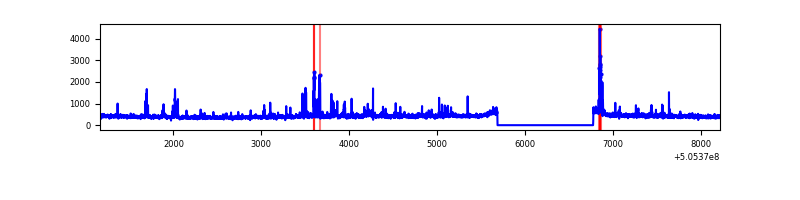 |
| C | 7056 | 5967 | 163 | 163 | 2.31% | 2.73% | 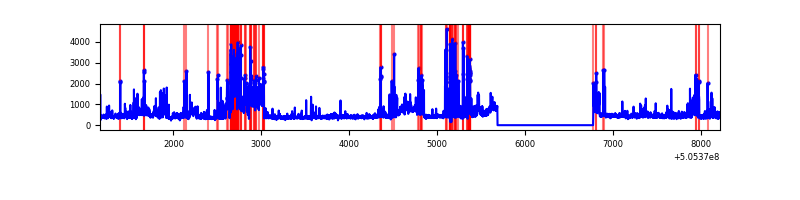 |
| D | 7056 | 5967 | 84 | 84 | 1.19% | 1.41% | 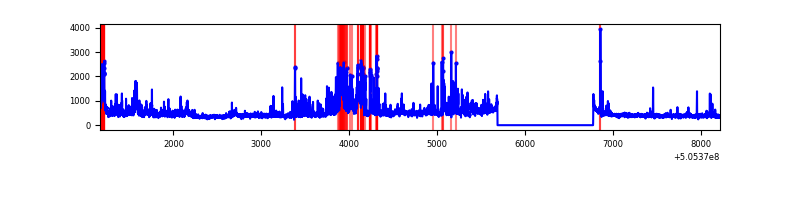 |
Top three noisy pixels from each quadrant. If the there are fewer than three noisy pixels in the level2.evt file, extra rows are filled as -1
| Pixel properties | Quadrant properties | ||||||
|---|---|---|---|---|---|---|---|
| Quadrant | DetID | PixID | Counts | Sigma | Mean | Median | Sigma |
| A | 12 | 115 | 577152 | 3839.66 | 607 | 592 | 150.2 |
| A | 8 | 249 | 301547 | 2004.24 | 607 | 592 | 150.2 |
| A | 0 | 8 | 70046 | 462.54 | 607 | 592 | 150.2 |
| B | 5 | 172 | 118224 | 914.7 | 602 | 580 | 128.6 |
| B | 10 | 247 | 53505 | 411.5 | 602 | 580 | 128.6 |
| B | 4 | 169 | 47681 | 366.22 | 602 | 580 | 128.6 |
| C | 9 | 38 | 651945 | 4114.06 | 578 | 572 | 158.3 |
| C | 12 | 252 | 327647 | 2065.8 | 578 | 572 | 158.3 |
| C | 15 | 199 | 122492 | 770.04 | 578 | 572 | 158.3 |
| D | 11 | 129 | 424975 | 2562.3 | 585 | 557 | 165.6 |
| D | 2 | 62 | 216252 | 1302.2 | 585 | 557 | 165.6 |
| D | 6 | 42 | 174888 | 1052.47 | 585 | 557 | 165.6 |
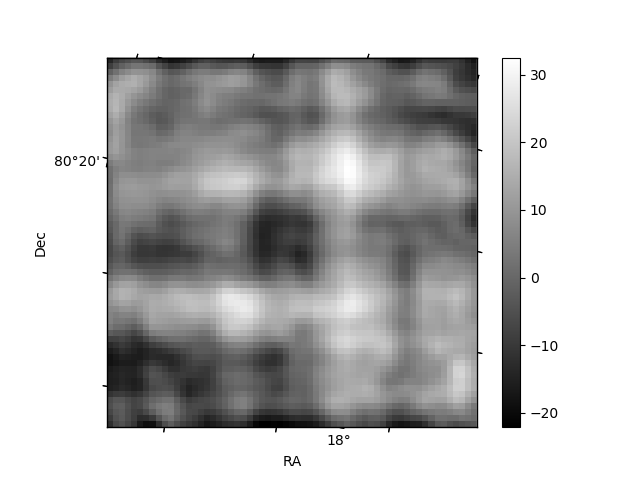
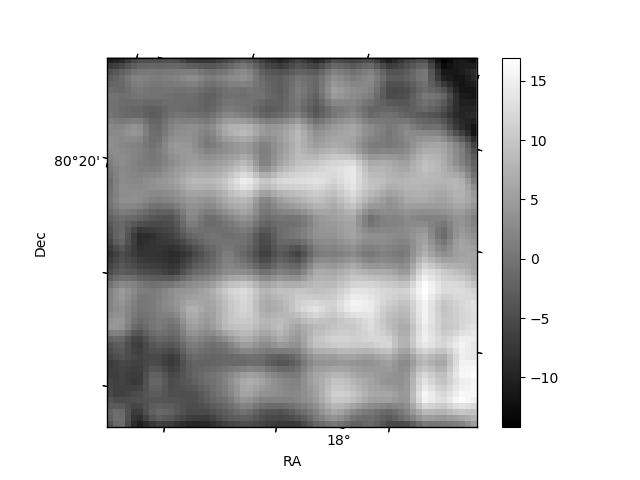
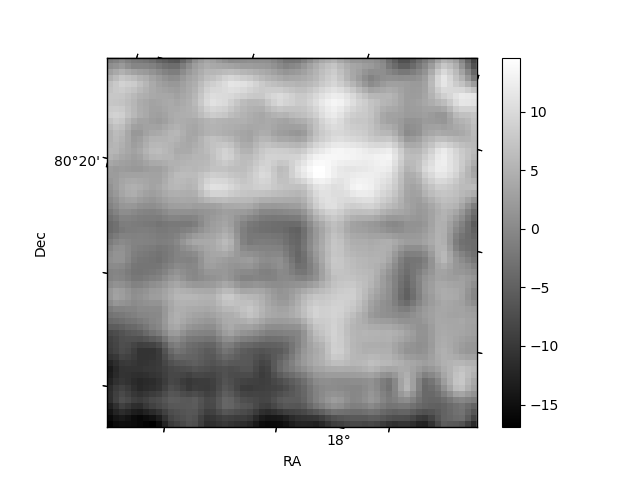
Histogram calculated using DETX and DETY for each event in the final _common_clean file
| Quadrant A | 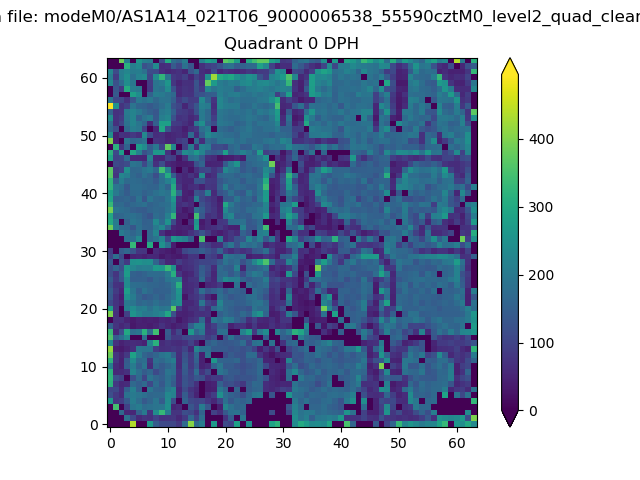 |
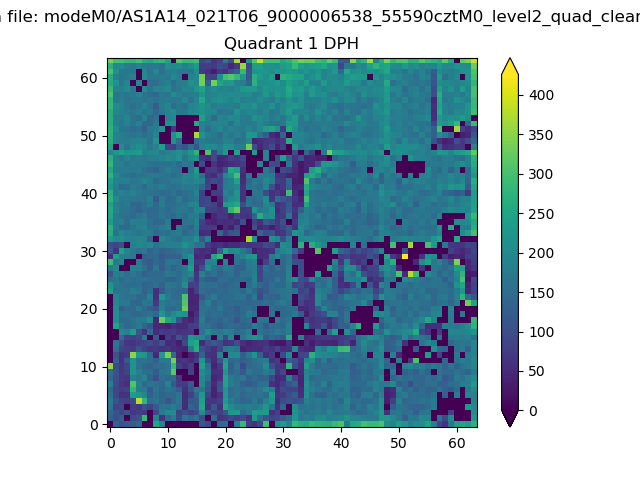 |
Quadrant B |
|---|---|---|---|
| Quadrant D | 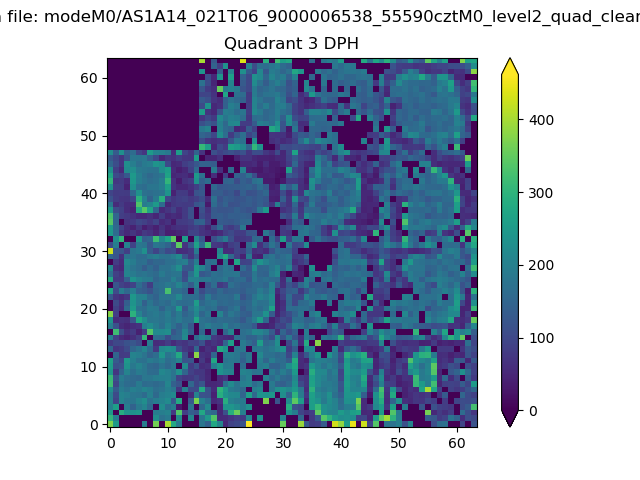 |
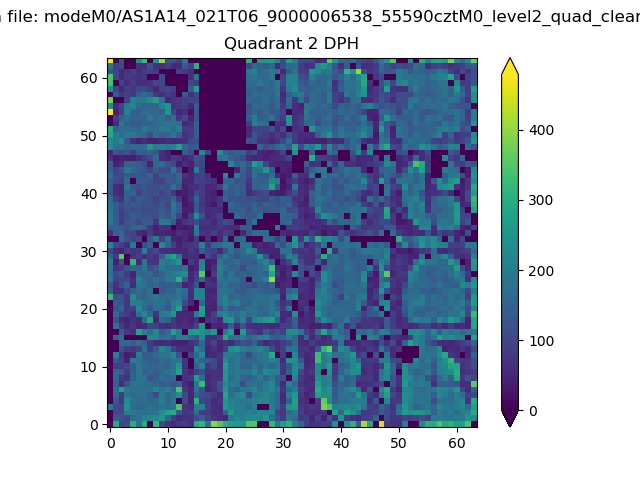 |
Quadrant C |
| Plot type | Count rate plots | Images |
|---|---|---|
| Comparison with Poisson distribution Blue bars denote a histogram of data divided into 1 sec bins. Red curve is a Poisson curve with rate = median count rate of data. |
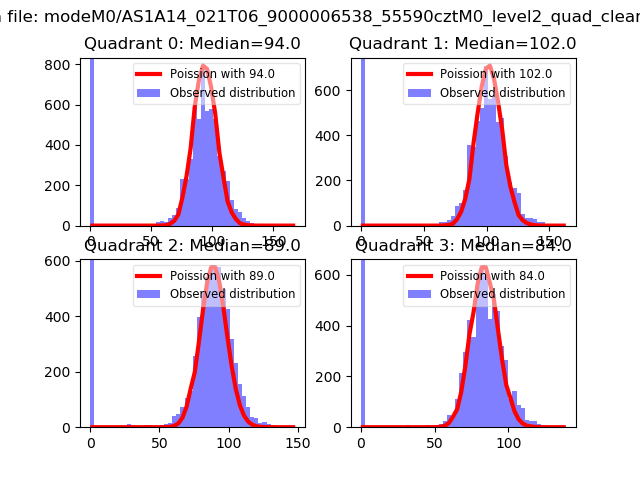 |
 |
| Quadrant-wise count rates Data is divided into 100 sec bins |
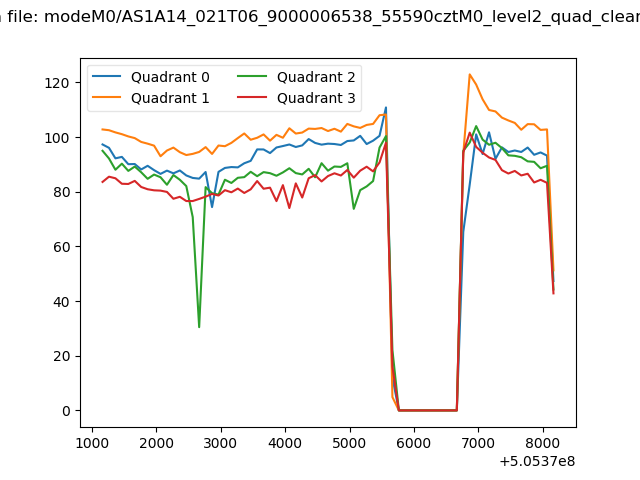 |
|
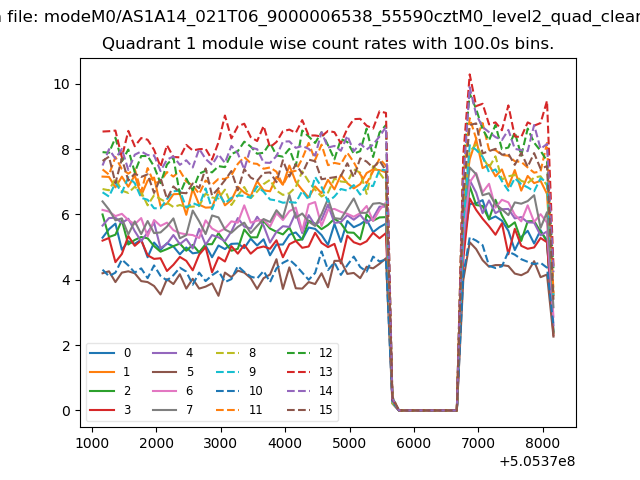
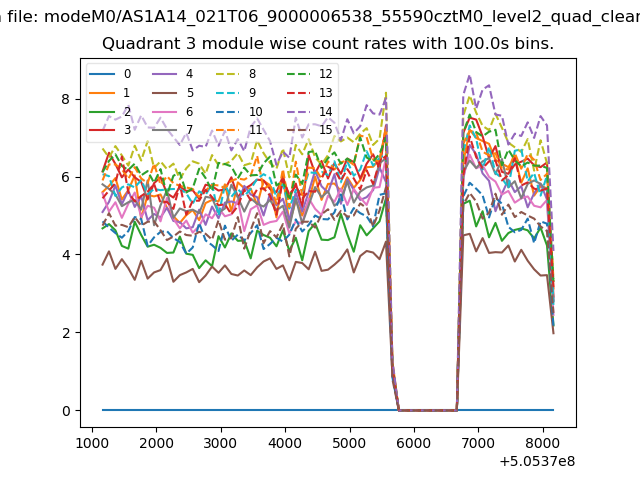
| Module-wise count rates for Quadrant A Data is divided into 100 sec bins |
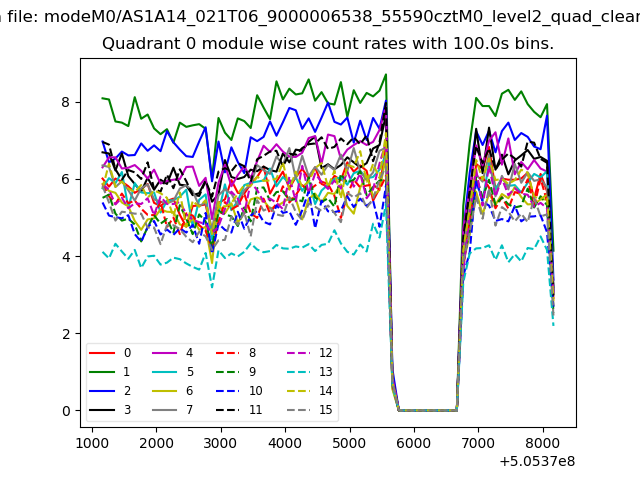 |
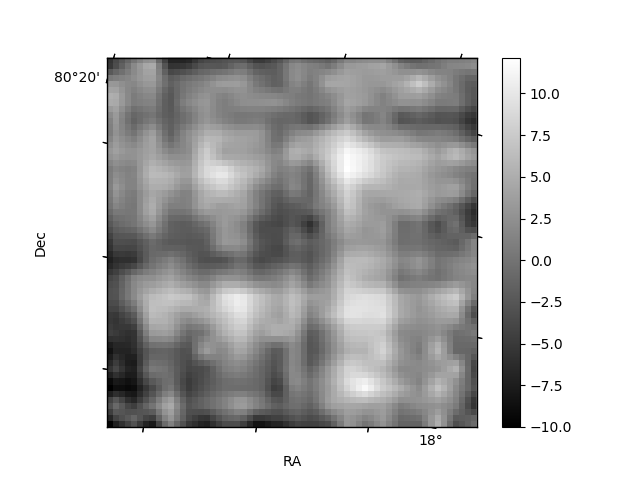 |
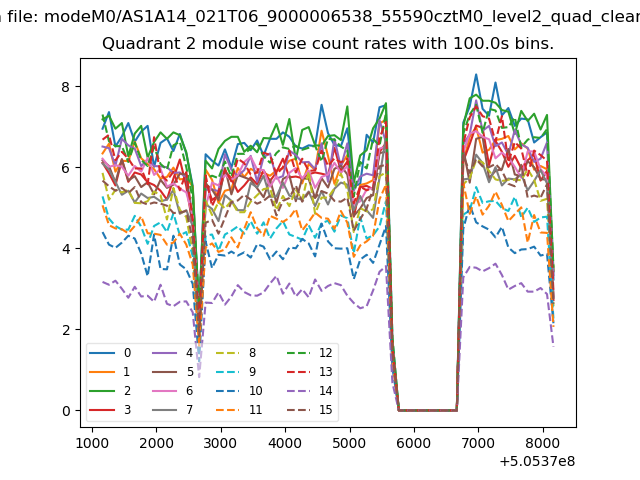
| Module-wise count rates for Quadrant B Data is divided into 100 sec bins |
 |
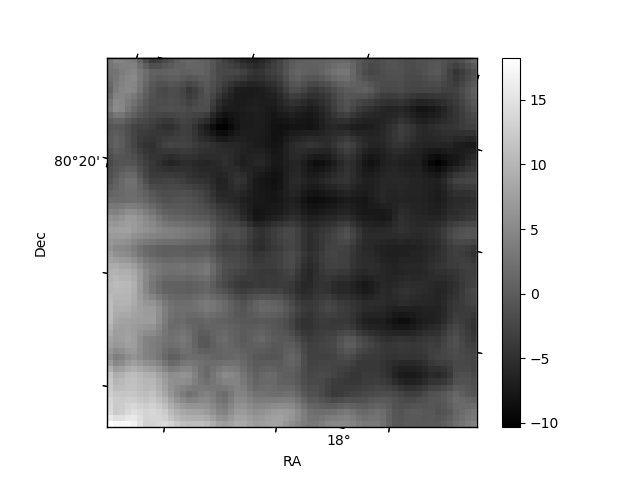 |
| Module-wise count rates for Quadrant C Data is divided into 100 sec bins |
 |
 |
| Module-wise count rates for Quadrant D Data is divided into 100 sec bins |
 |
 |
| Parameter | Plot |
|---|---|
| CZT HV Monitor | 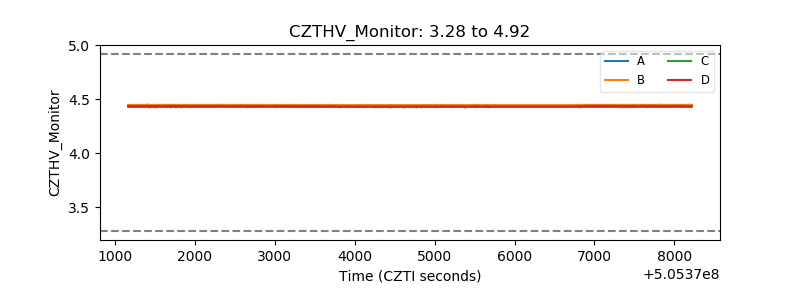 |
| D_VDD | 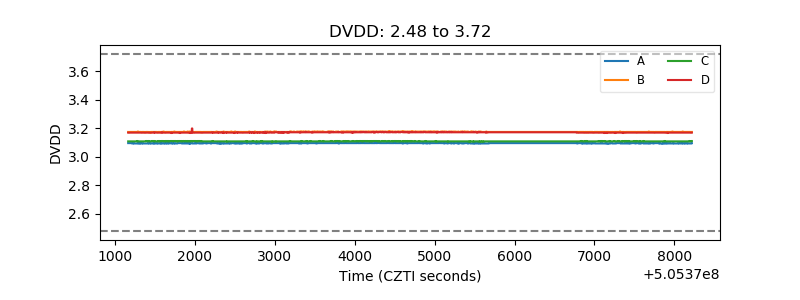 |
| Temperature 1 | 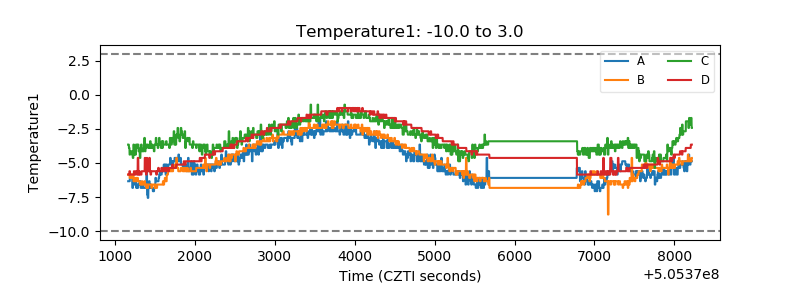 |
| Veto HV Monitor | 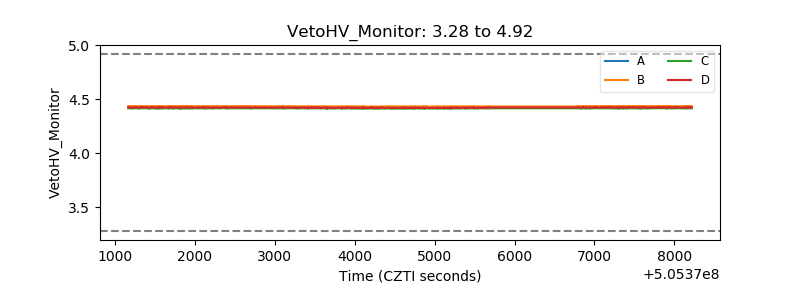 |
| Veto LLD | 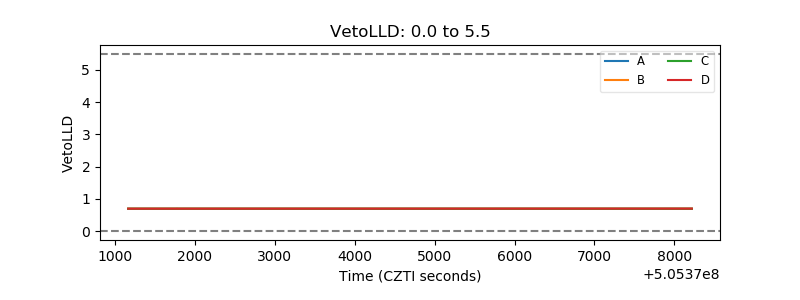 |
| Alpha Counter | 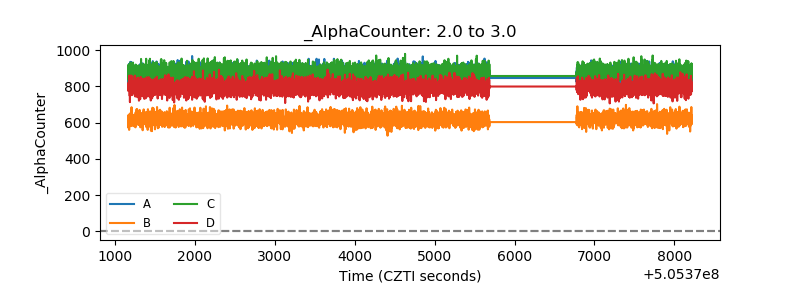 |
| _CPM_Rate | 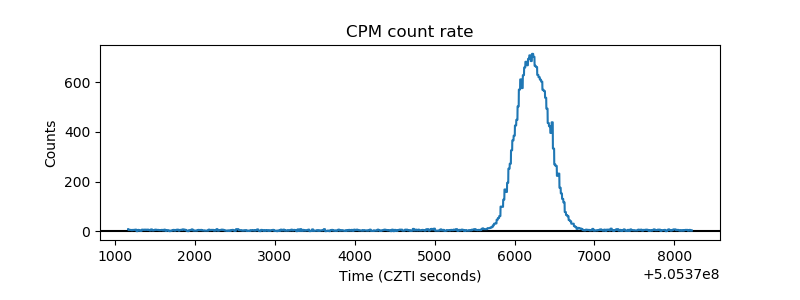 |
| CZT Counter | 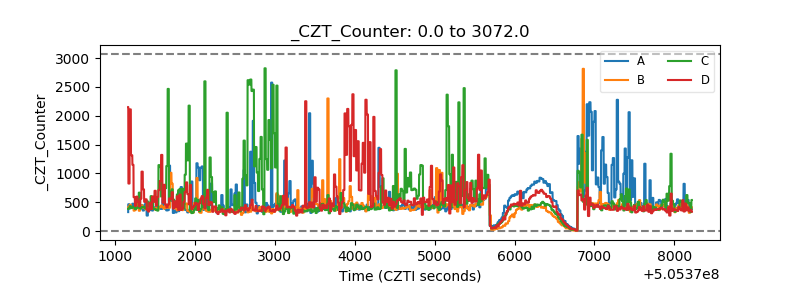 |
| +2.5 Volts monitor | 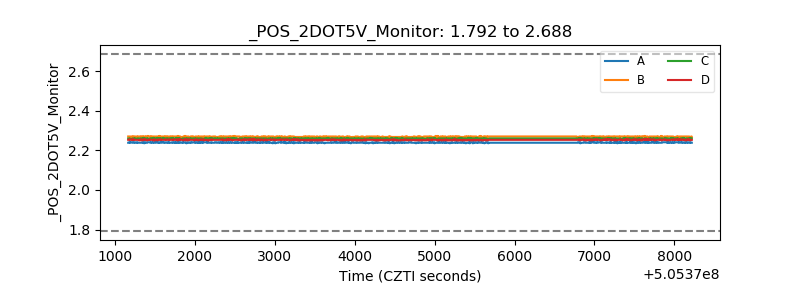 |
| +5 Volts monitor | 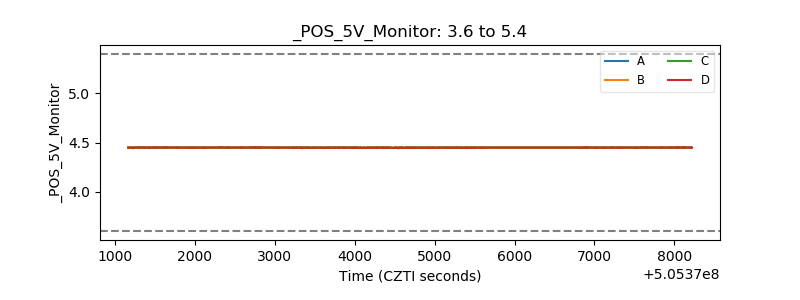 |
| _ROLL_ROT | 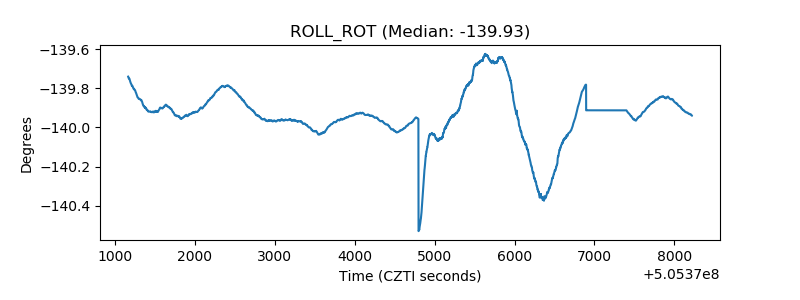 |
| _Roll_DEC | 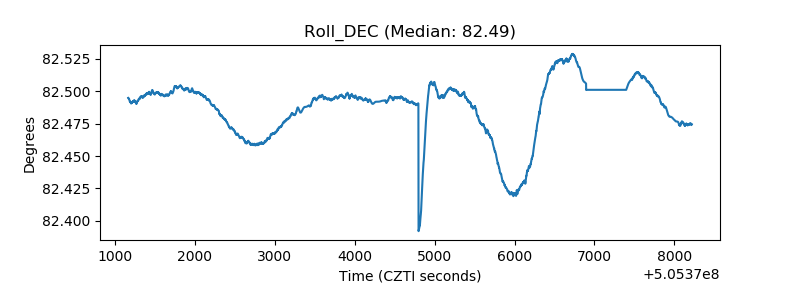 |
| _Roll_RA | 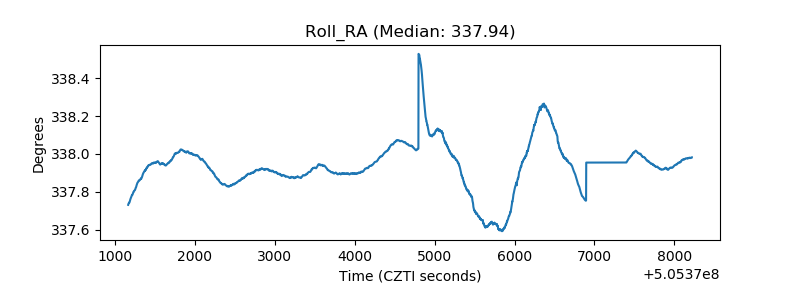 |
| Veto Counter | 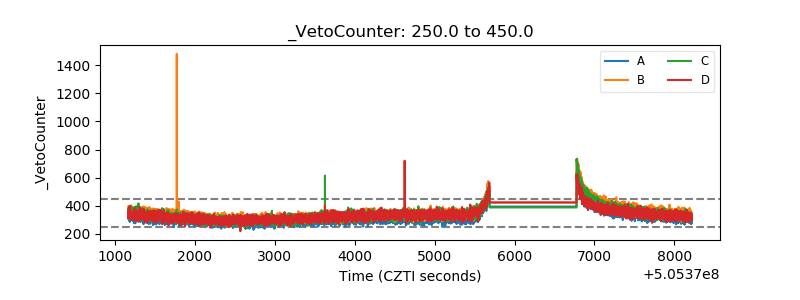 |