| Param | Original file | Final file |
|---|---|---|
| Filename | modeM0/AS1A14_021T06_9000006538_55591cztM0_level2.fits | modeM0/AS1A14_021T06_9000006538_55591cztM0_level2_quad_clean.evt |
| Size (bytes) | 374,290,560 | 85,158,720 |
| Size | 357.0 MB | 81.2 MB |
| Events in quadrant A | 3,586,324 | 551,443 |
| Events in quadrant B | 2,802,740 | 603,219 |
| Events in quadrant C | 4,014,341 | 508,494 |
| Events in quadrant D | 2,993,060 | 504,076 |
| Mode M9 | |||
|---|---|---|---|
| Quadrant | BADHDUFLAG | Total packets | Discarded packets |
| A | 0 | 11 | 0 |
| B | 0 | 11 | 0 |
| C | 0 | 11 | 0 |
| D | 0 | 11 | 0 |
| Mode M0 | |||
|---|---|---|---|
| Quadrant | BADHDUFLAG | Total packets | Discarded packets |
| A | 0 | 14971 | 2 |
| B | 0 | 12917 | 1 |
| C | 0 | 16275 | 1 |
| D | 0 | 13352 | 1 |
| Mode SS | |||
|---|---|---|---|
| Quadrant | BADHDUFLAG | Total packets | Discarded packets |
| A | 0 | 120 | 0 |
| B | 0 | 120 | 0 |
| C | 0 | 120 | 0 |
| D | 0 | 120 | 0 |
| Quadrant | Total seconds | Saturated seconds | Saturation percentage |
|---|---|---|---|
| A | 5887 | 260 | 4.416511% |
| B | 5888 | 142 | 2.411685% |
| C | 5888 | 388 | 6.589674% |
| D | 5888 | 73 | 1.239810% |
Noise dominated data is calculated using 1-second bins in cleaned event files. If a bin has >2000 counts, and if more than 50% of those come from <1% of pixels, then it is considered to be noise-dominated and hence unusable.
| Quadrant | # 1 sec bins | Bins with >0 counts | Bins with >2000 counts | High rate bins dominated by noise | Noise dominated (total time) | Noise dominated (detector-on time) | Marked lightcurve |
|---|---|---|---|---|---|---|---|
| A | 7007 | 5888 | 159 | 159 | 2.27% | 2.70% | 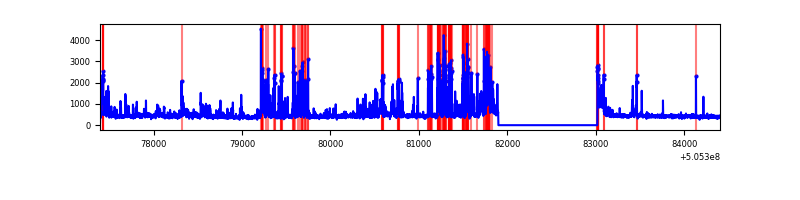 |
| B | 7008 | 5889 | 37 | 37 | 0.53% | 0.63% | 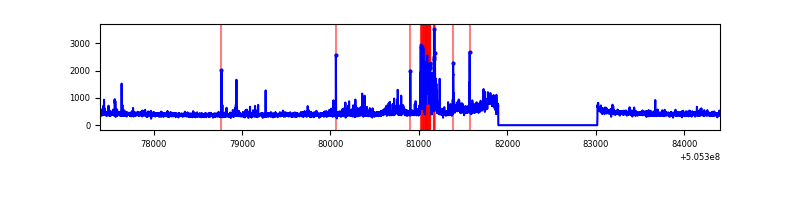 |
| C | 7008 | 5889 | 341 | 341 | 4.87% | 5.79% | 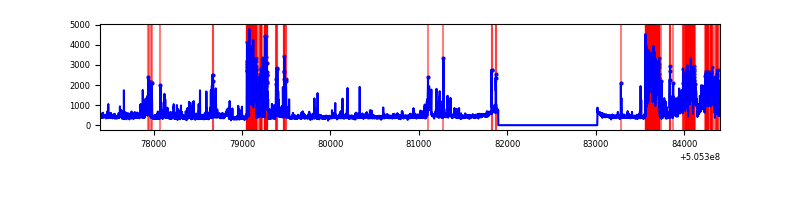 |
| D | 7008 | 5889 | 40 | 40 | 0.57% | 0.68% | 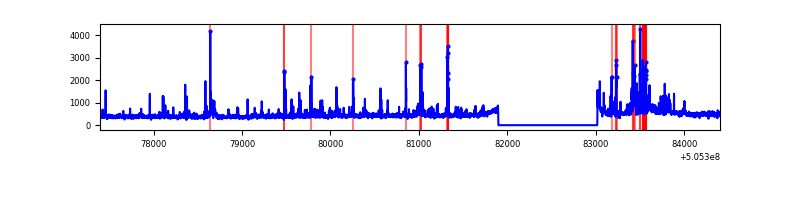 |
Top three noisy pixels from each quadrant. If the there are fewer than three noisy pixels in the level2.evt file, extra rows are filled as -1
| Pixel properties | Quadrant properties | ||||||
|---|---|---|---|---|---|---|---|
| Quadrant | DetID | PixID | Counts | Sigma | Mean | Median | Sigma |
| A | 0 | 8 | 568374 | 3829.51 | 602 | 587 | 148.3 |
| A | 12 | 115 | 395384 | 2662.76 | 602 | 587 | 148.3 |
| A | 8 | 249 | 234557 | 1578.04 | 602 | 587 | 148.3 |
| B | 5 | 172 | 333013 | 2595.14 | 601 | 580 | 128.1 |
| B | 10 | 247 | 42262 | 325.39 | 601 | 580 | 128.1 |
| B | 9 | 251 | 15751 | 118.43 | 601 | 580 | 128.1 |
| C | 12 | 252 | 1073579 | 6876.44 | 571 | 566 | 156.0 |
| C | 6 | 223 | 424250 | 2715.19 | 571 | 566 | 156.0 |
| C | 9 | 38 | 88543 | 563.8 | 571 | 566 | 156.0 |
| D | 8 | 160 | 308704 | 1879.54 | 586 | 559 | 163.9 |
| D | 5 | 113 | 145174 | 882.08 | 586 | 559 | 163.9 |
| D | 2 | 172 | 75584 | 457.62 | 586 | 559 | 163.9 |
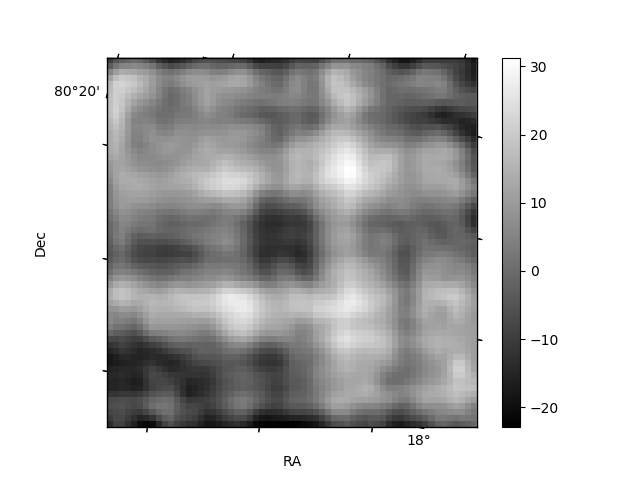
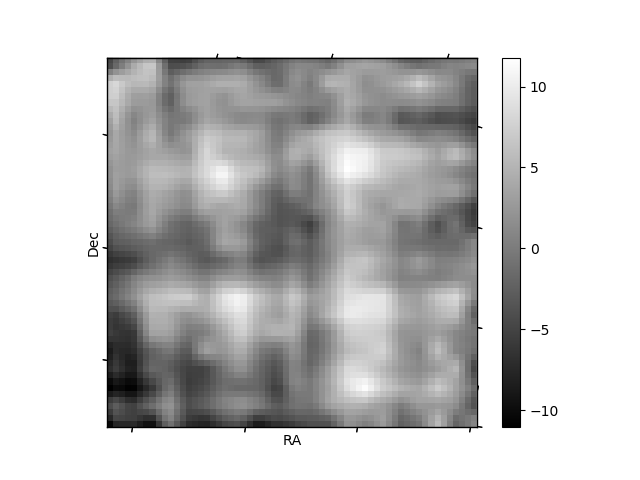
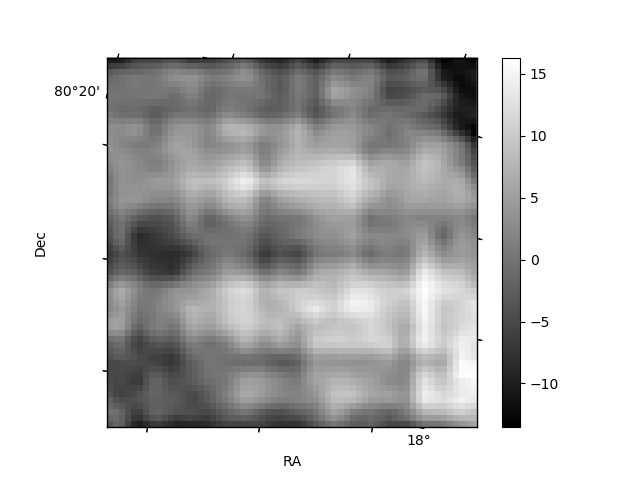
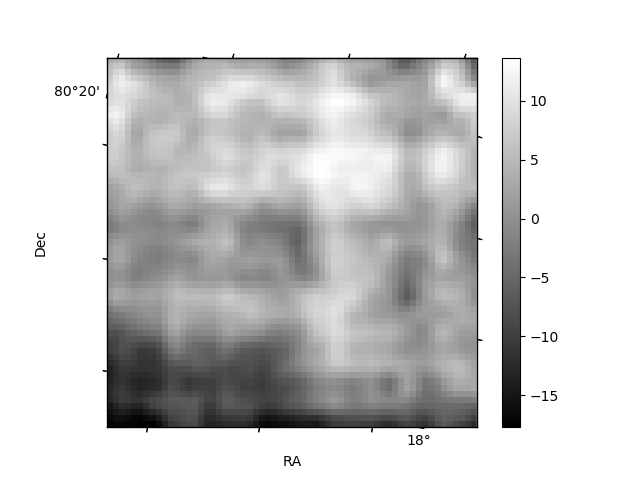
Histogram calculated using DETX and DETY for each event in the final _common_clean file
| Quadrant A | 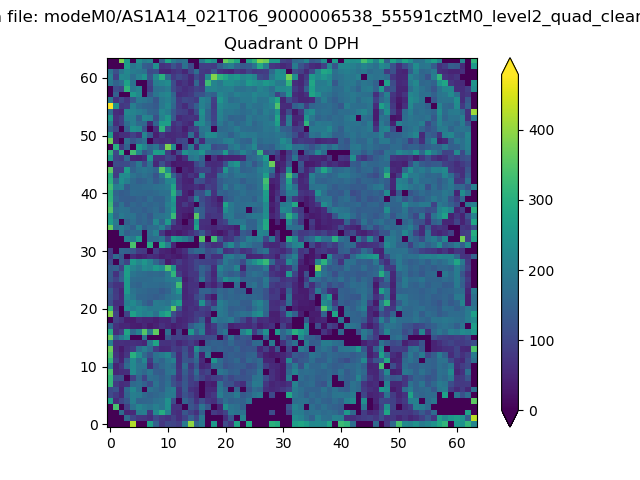 |
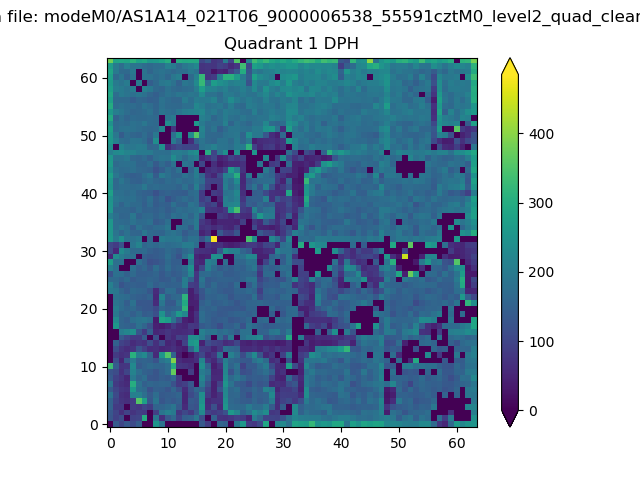 |
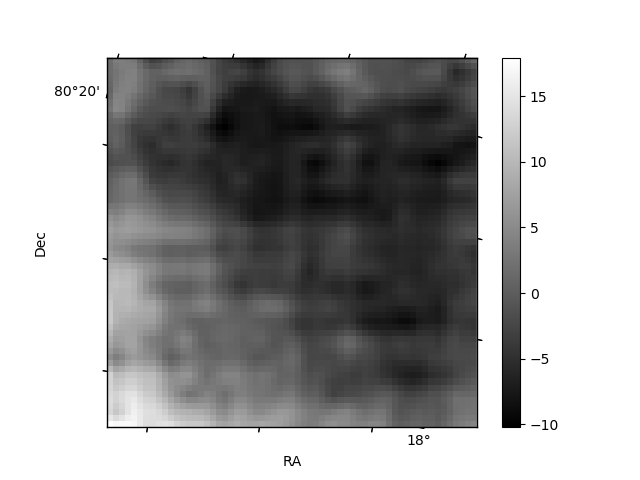
Quadrant B |
|---|---|---|---|
| Quadrant D | 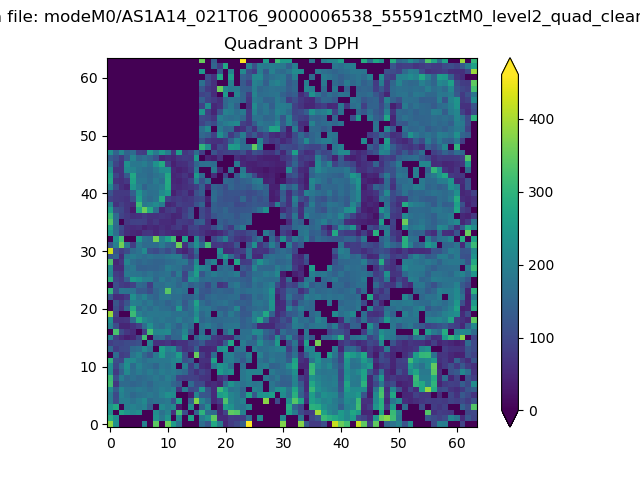 |
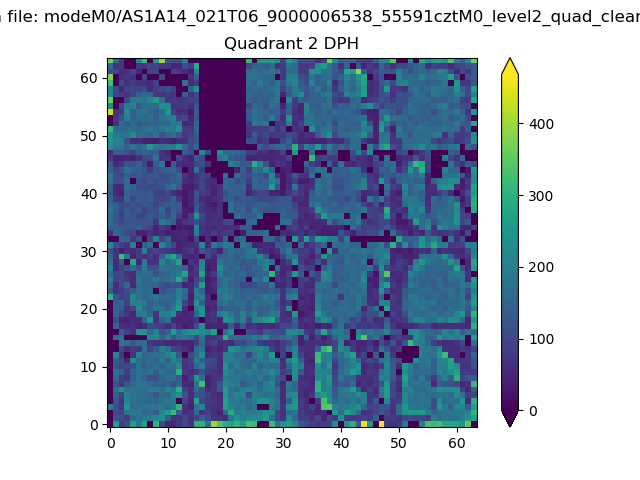 |
Quadrant C |
| Plot type | Count rate plots | Images |
|---|---|---|
| Comparison with Poisson distribution Blue bars denote a histogram of data divided into 1 sec bins. Red curve is a Poisson curve with rate = median count rate of data. |
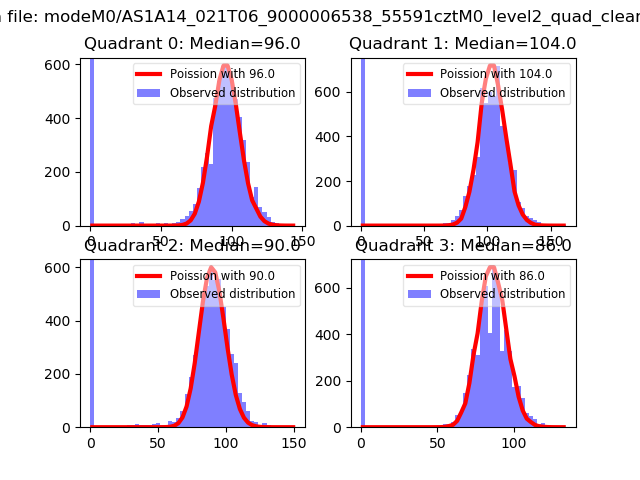 |
 |
| Quadrant-wise count rates Data is divided into 100 sec bins |
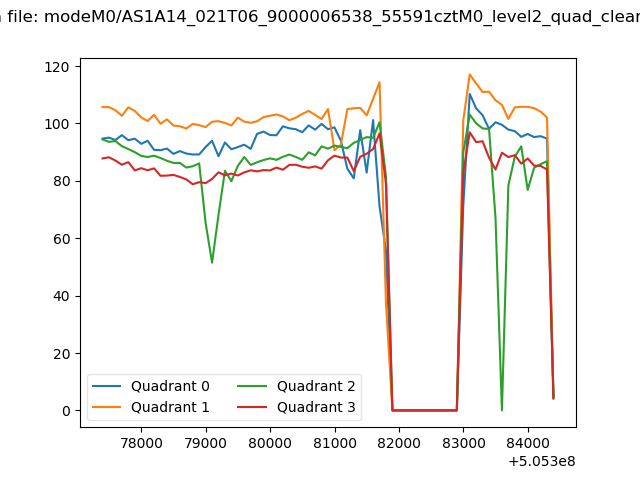 |
|
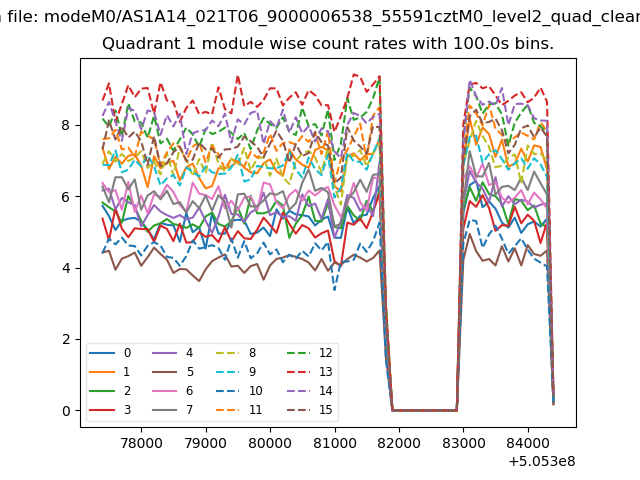
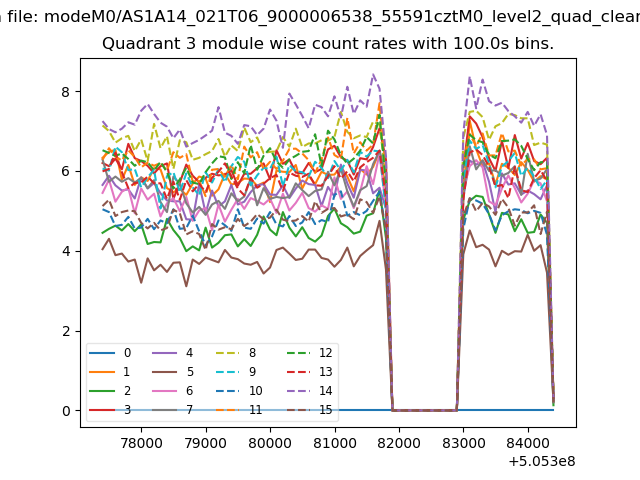
| Module-wise count rates for Quadrant A Data is divided into 100 sec bins |
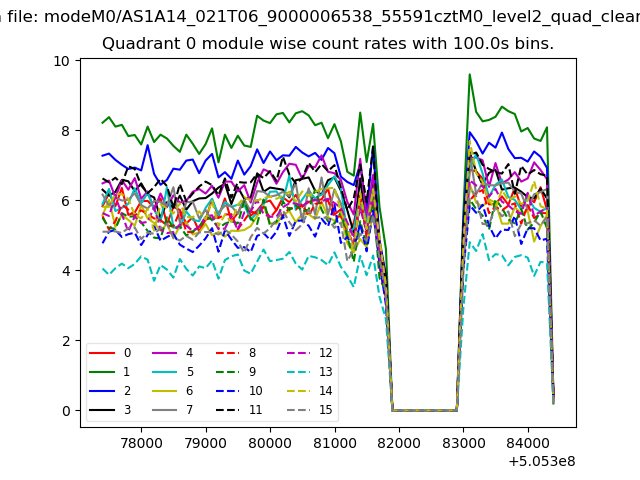 |
 |
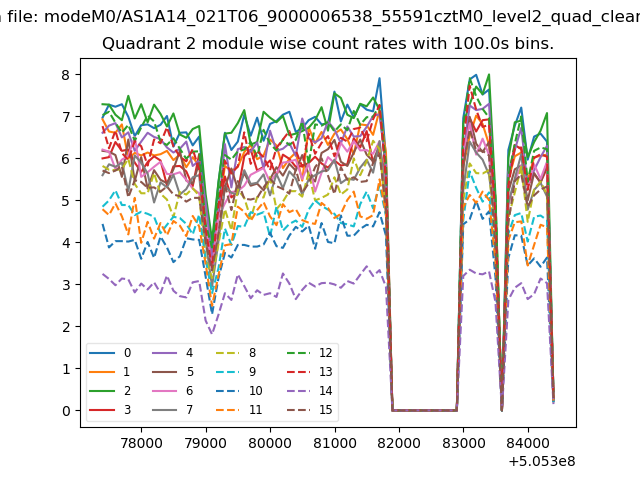
| Module-wise count rates for Quadrant B Data is divided into 100 sec bins |
 |
 |
| Module-wise count rates for Quadrant C Data is divided into 100 sec bins |
 |
 |
| Module-wise count rates for Quadrant D Data is divided into 100 sec bins |
 |
 |
| Parameter | Plot |
|---|---|
| CZT HV Monitor | 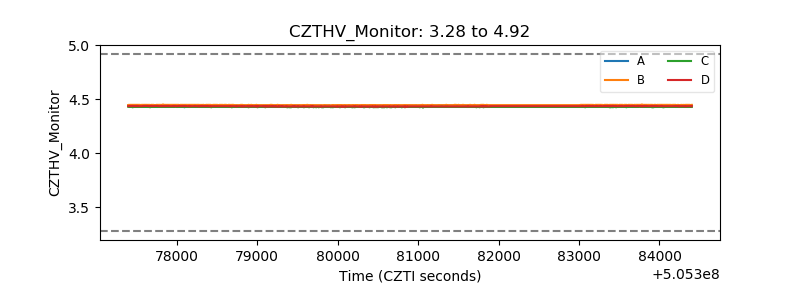 |
| D_VDD | 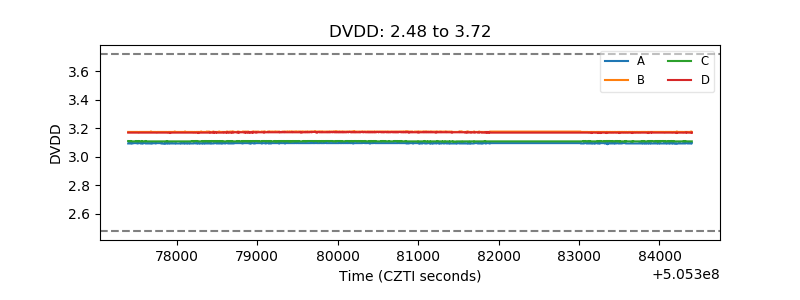 |
| Temperature 1 | 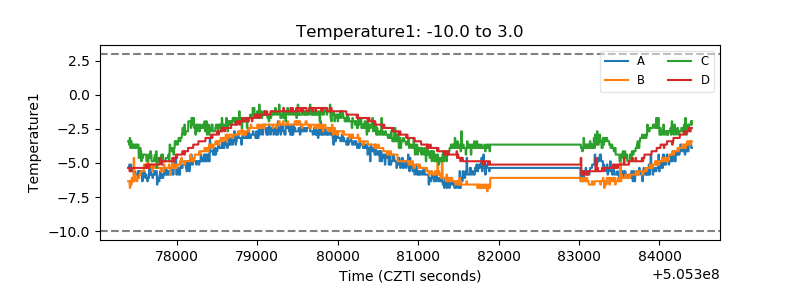 |
| Veto HV Monitor |  |
| Veto LLD | 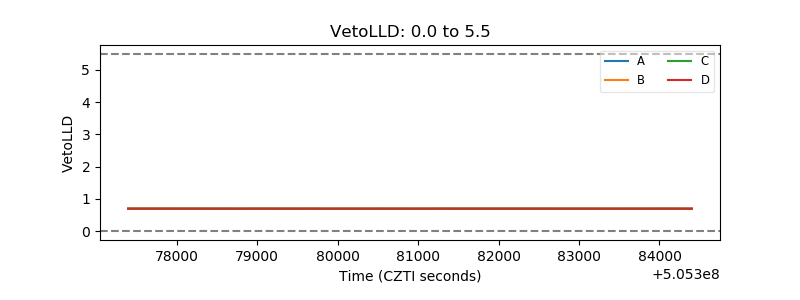 |
| Alpha Counter | 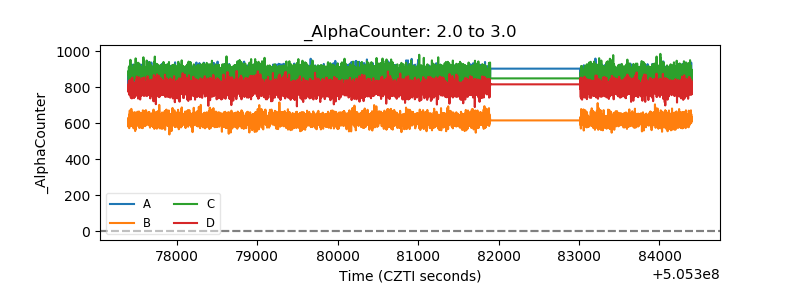 |
| _CPM_Rate | 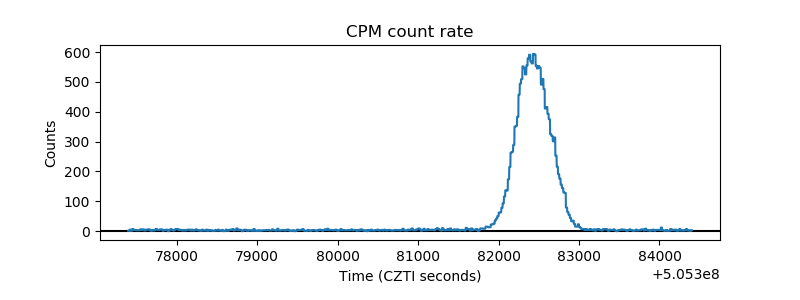 |
| CZT Counter | 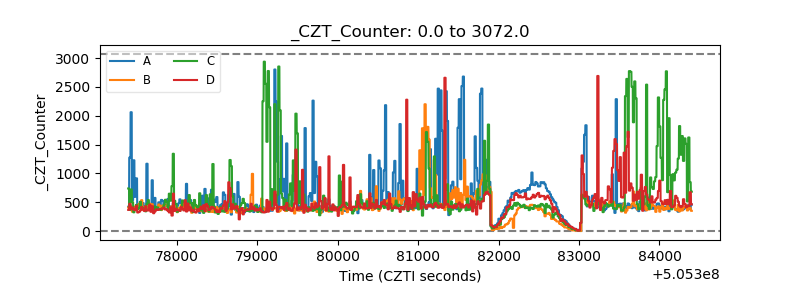 |
| +2.5 Volts monitor | 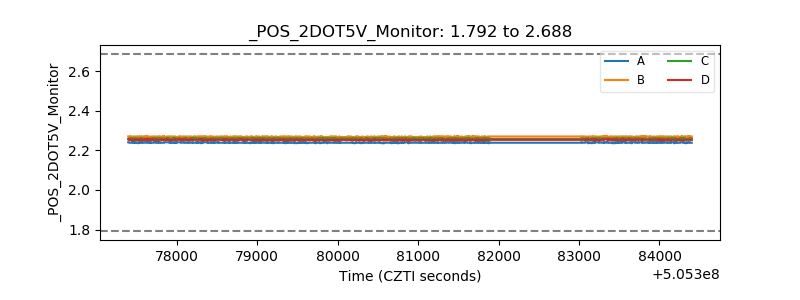 |
| +5 Volts monitor | 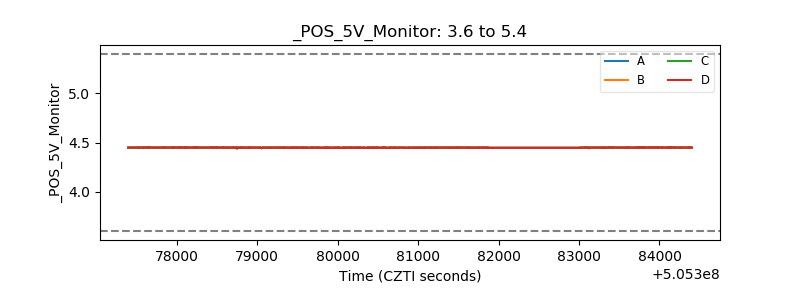 |
| _ROLL_ROT | 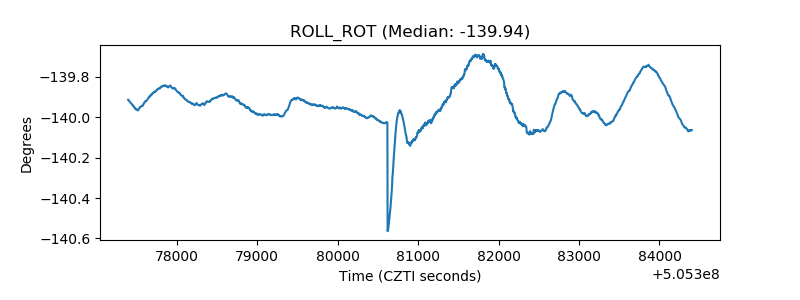 |
| _Roll_DEC | 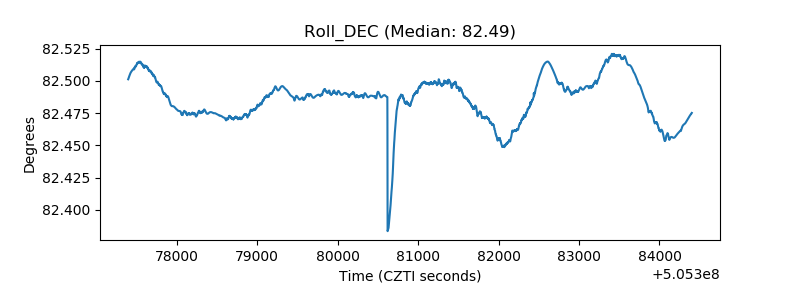 |
| _Roll_RA | 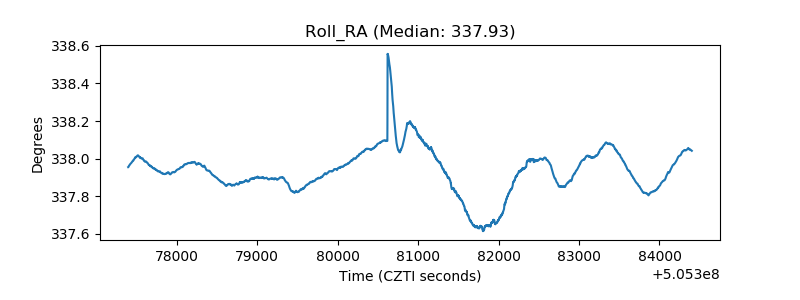 |
| Veto Counter | 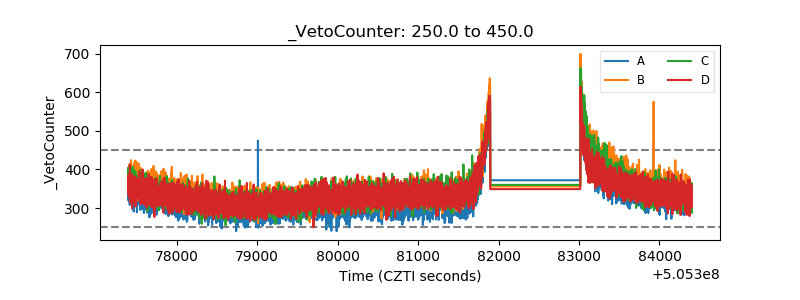 |