| Param | Original file | Final file |
|---|---|---|
| Filename | modeM0/AS1A14_021T06_9000006538_55592cztM0_level2.fits | modeM0/AS1A14_021T06_9000006538_55592cztM0_level2_quad_clean.evt |
| Size (bytes) | 394,482,240 | 84,985,920 |
| Size | 376.2 MB | 81.0 MB |
| Events in quadrant A | 3,254,026 | 569,347 |
| Events in quadrant B | 2,544,589 | 612,764 |
| Events in quadrant C | 5,257,216 | 475,842 |
| Events in quadrant D | 3,085,703 | 501,884 |
| Mode M9 | |||
|---|---|---|---|
| Quadrant | BADHDUFLAG | Total packets | Discarded packets |
| A | 0 | 11 | 0 |
| B | 0 | 11 | 0 |
| C | 0 | 11 | 0 |
| D | 0 | 11 | 0 |
| Mode M0 | |||
|---|---|---|---|
| Quadrant | BADHDUFLAG | Total packets | Discarded packets |
| A | 0 | 14081 | 1 |
| B | 0 | 12237 | 1 |
| C | 0 | 20018 | 1 |
| D | 0 | 13276 | 1 |
| Mode SS | |||
|---|---|---|---|
| Quadrant | BADHDUFLAG | Total packets | Discarded packets |
| A | 0 | 120 | 0 |
| B | 0 | 120 | 0 |
| C | 0 | 120 | 0 |
| D | 0 | 120 | 0 |
| Quadrant | Total seconds | Saturated seconds | Saturation percentage |
|---|---|---|---|
| A | 5920 | 93 | 1.570946% |
| B | 5919 | 85 | 1.436053% |
| C | 5920 | 797 | 13.462838% |
| D | 5920 | 93 | 1.570946% |
Noise dominated data is calculated using 1-second bins in cleaned event files. If a bin has >2000 counts, and if more than 50% of those come from <1% of pixels, then it is considered to be noise-dominated and hence unusable.
| Quadrant | # 1 sec bins | Bins with >0 counts | Bins with >2000 counts | High rate bins dominated by noise | Noise dominated (total time) | Noise dominated (detector-on time) | Marked lightcurve |
|---|---|---|---|---|---|---|---|
| A | 7005 | 5921 | 26 | 26 | 0.37% | 0.44% | 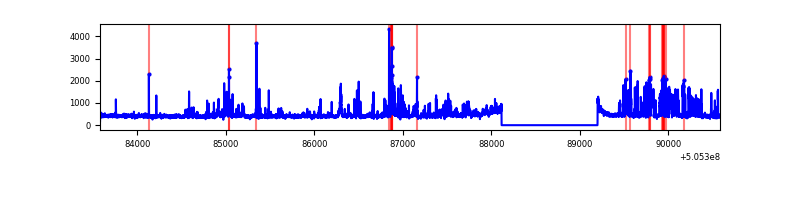 |
| B | 7004 | 5920 | 4 | 4 | 0.06% | 0.07% | 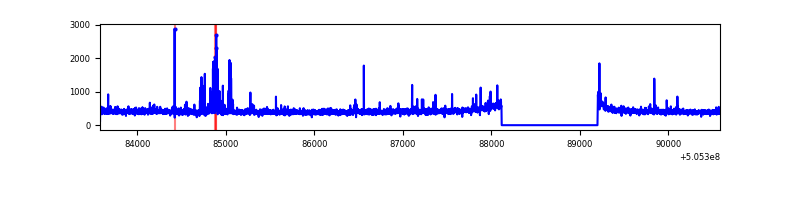 |
| C | 7005 | 5921 | 721 | 721 | 10.29% | 12.18% | 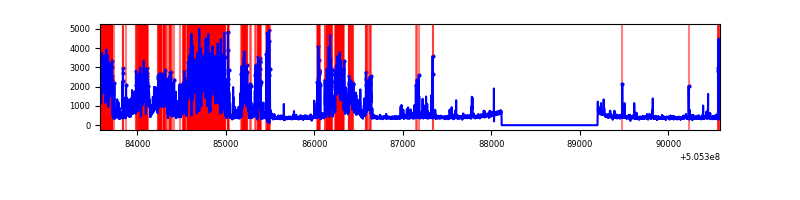 |
| D | 7005 | 5921 | 43 | 43 | 0.61% | 0.73% | 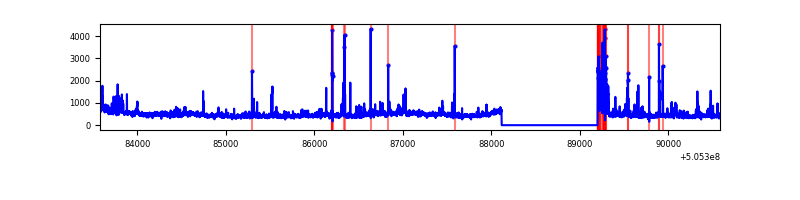 |
Top three noisy pixels from each quadrant. If the there are fewer than three noisy pixels in the level2.evt file, extra rows are filled as -1
| Pixel properties | Quadrant properties | ||||||
|---|---|---|---|---|---|---|---|
| Quadrant | DetID | PixID | Counts | Sigma | Mean | Median | Sigma |
| A | 8 | 249 | 608199 | 3929.23 | 615 | 599 | 154.6 |
| A | 0 | 8 | 127269 | 819.15 | 615 | 599 | 154.6 |
| A | 12 | 115 | 72408 | 464.37 | 615 | 599 | 154.6 |
| B | 1 | 159 | 55962 | 425.9 | 606 | 586 | 130.0 |
| B | 10 | 247 | 37628 | 284.89 | 606 | 586 | 130.0 |
| B | 12 | 111 | 15131 | 111.87 | 606 | 586 | 130.0 |
| C | 12 | 252 | 2697945 | 17535.67 | 558 | 550 | 153.8 |
| C | 6 | 223 | 284563 | 1846.36 | 558 | 550 | 153.8 |
| C | 13 | 3 | 45221 | 290.4 | 558 | 550 | 153.8 |
| D | 8 | 160 | 247986 | 1477.72 | 590 | 562 | 167.4 |
| D | 5 | 113 | 227794 | 1357.13 | 590 | 562 | 167.4 |
| D | 2 | 172 | 85541 | 507.53 | 590 | 562 | 167.4 |
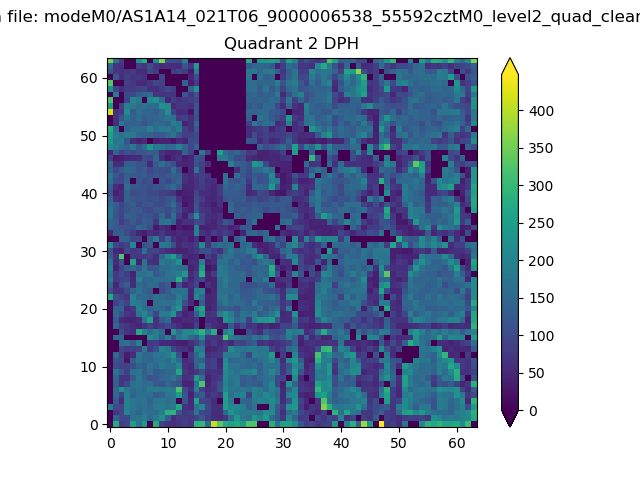
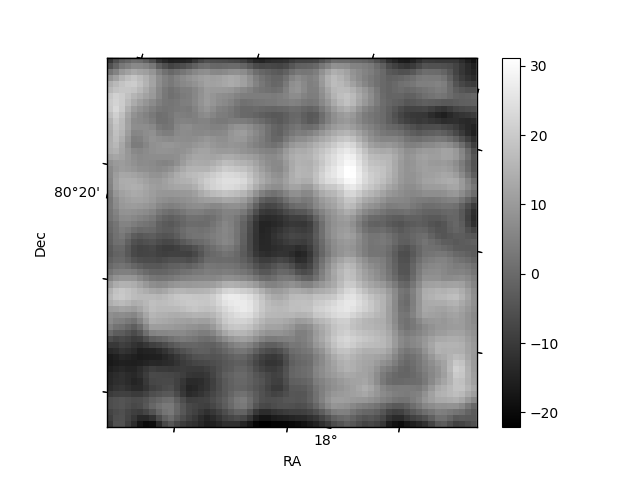
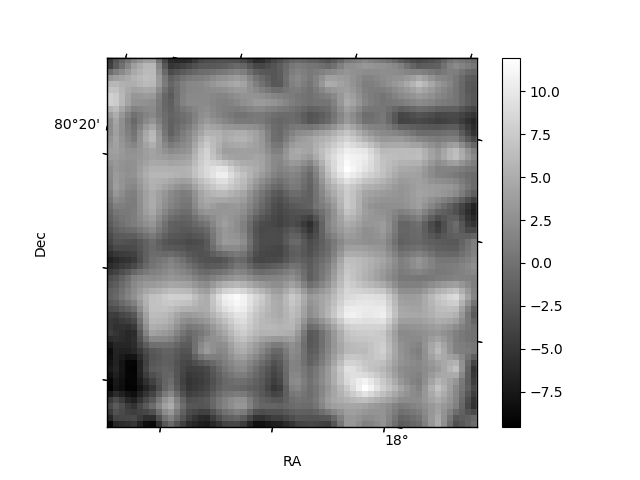
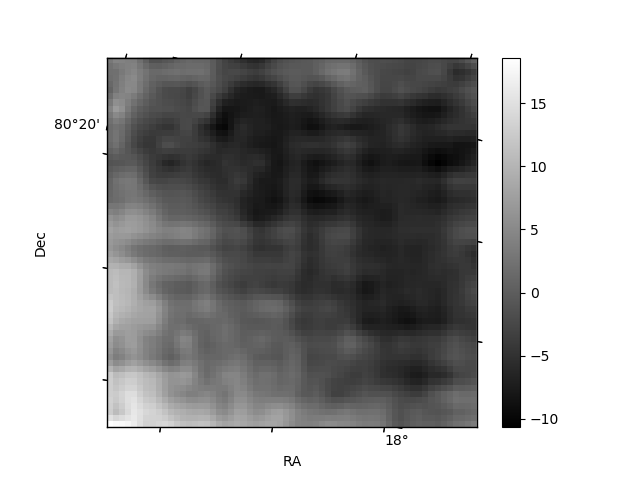
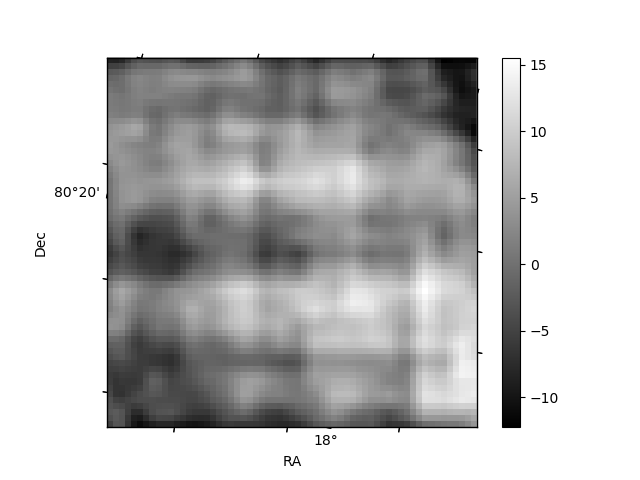
Histogram calculated using DETX and DETY for each event in the final _common_clean file
| Quadrant A | 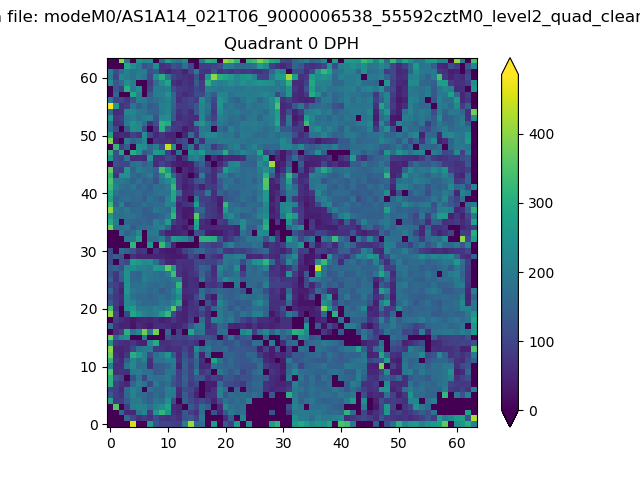 |
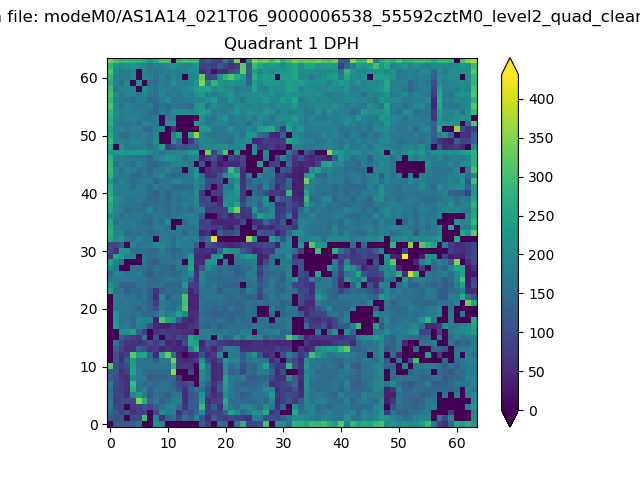 |
Quadrant B |
|---|---|---|---|
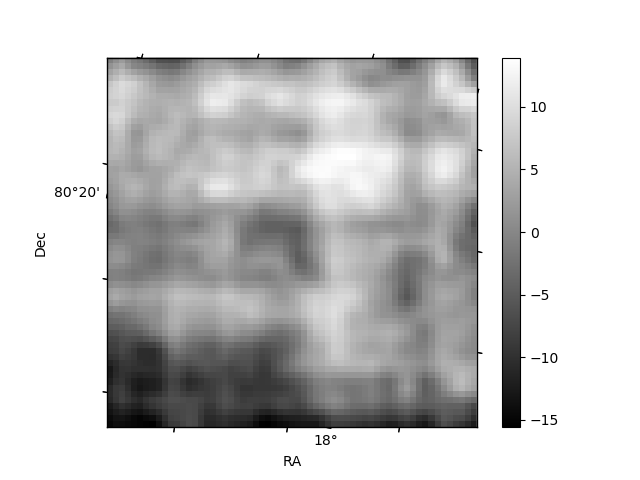
| Quadrant D | 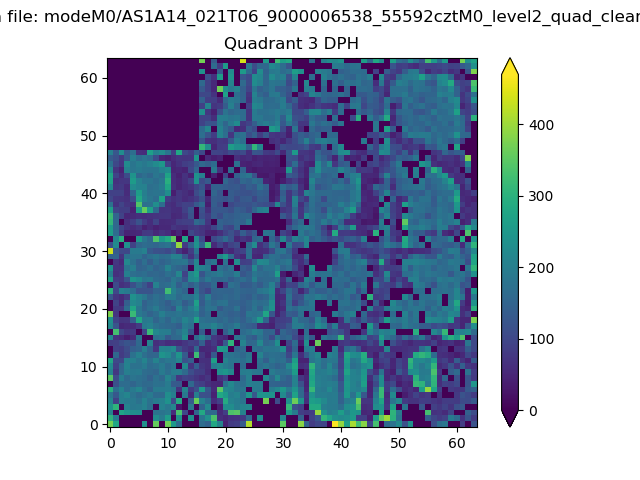 |
 |
Quadrant C |
| Plot type | Count rate plots | Images |
|---|---|---|
| Comparison with Poisson distribution Blue bars denote a histogram of data divided into 1 sec bins. Red curve is a Poisson curve with rate = median count rate of data. |
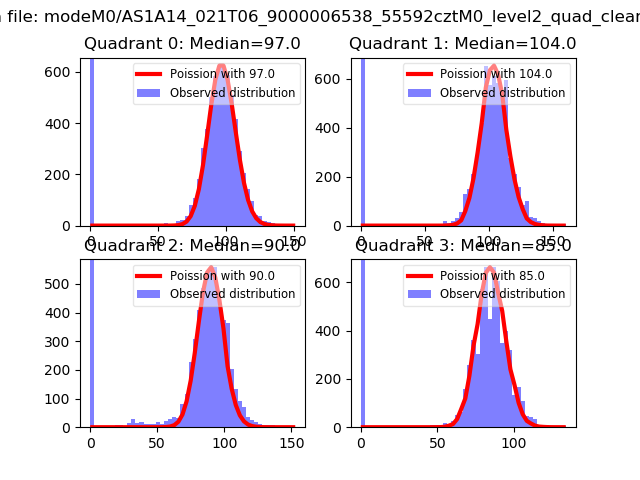 |
 |
| Quadrant-wise count rates Data is divided into 100 sec bins |
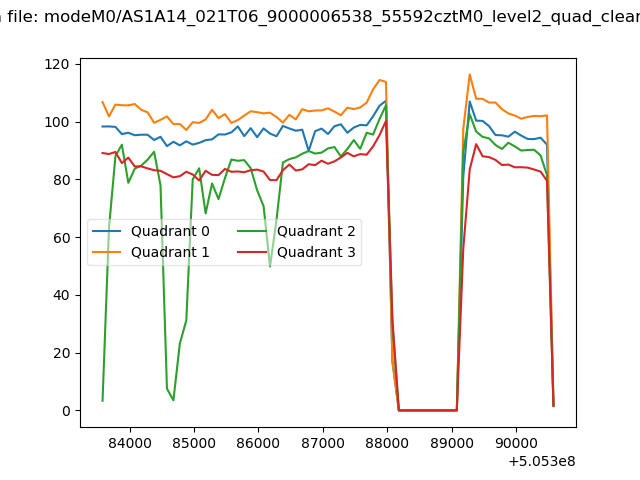 |
|
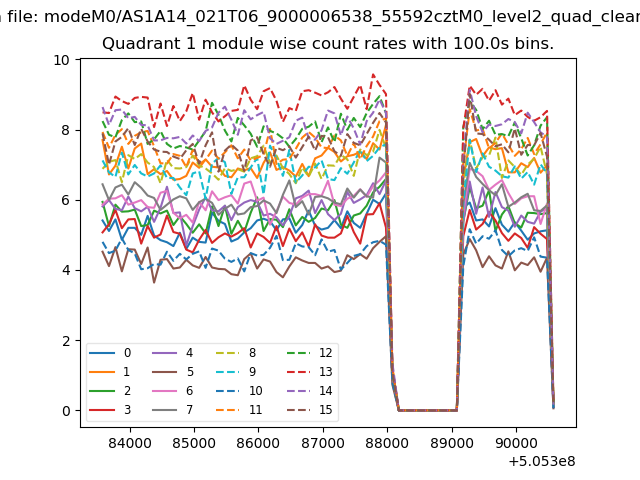
| Module-wise count rates for Quadrant A Data is divided into 100 sec bins |
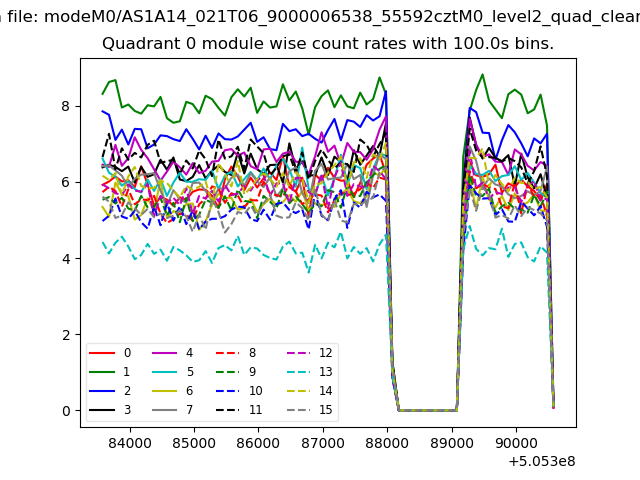 |
 |
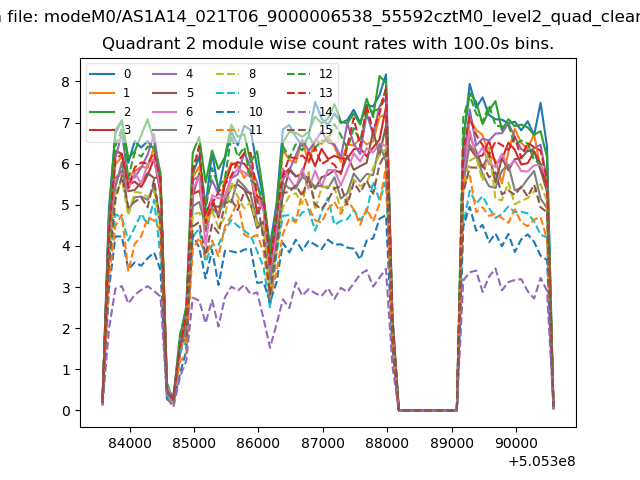
| Module-wise count rates for Quadrant B Data is divided into 100 sec bins |
 |
 |
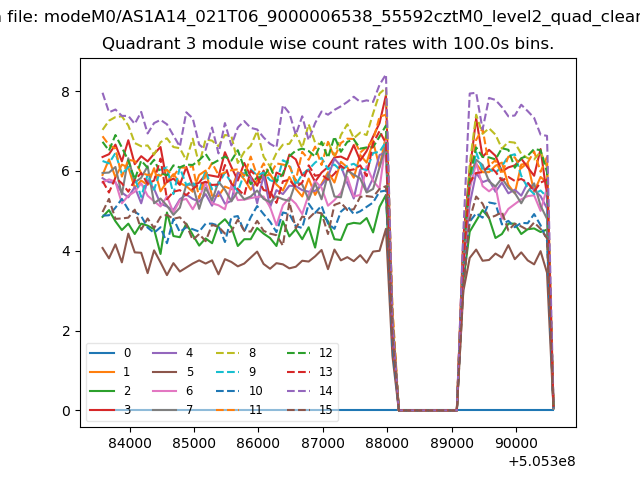
| Module-wise count rates for Quadrant C Data is divided into 100 sec bins |
 |
 |
| Module-wise count rates for Quadrant D Data is divided into 100 sec bins |
 |
 |
| Parameter | Plot |
|---|---|
| CZT HV Monitor | 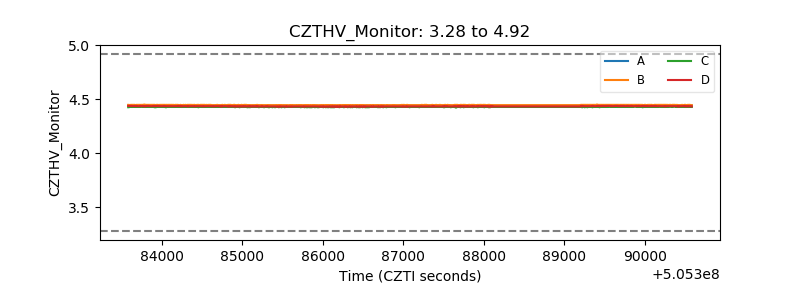 |
| D_VDD | 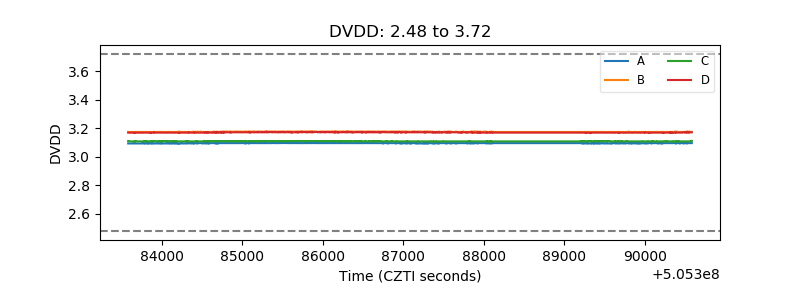 |
| Temperature 1 | 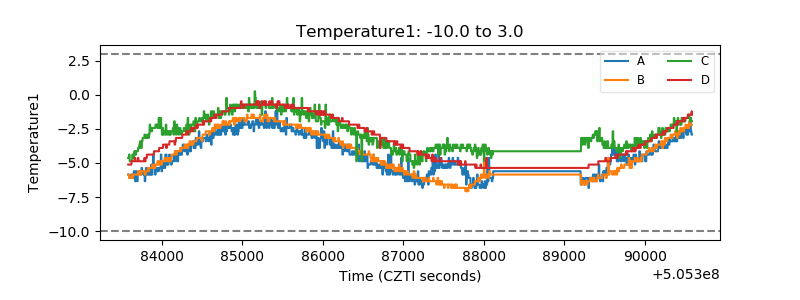 |
| Veto HV Monitor |  |
| Veto LLD | 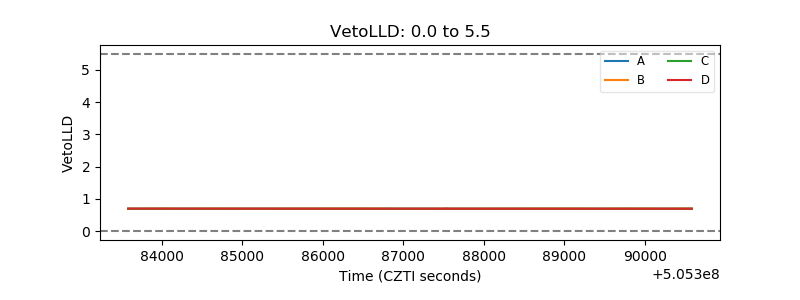 |
| Alpha Counter | 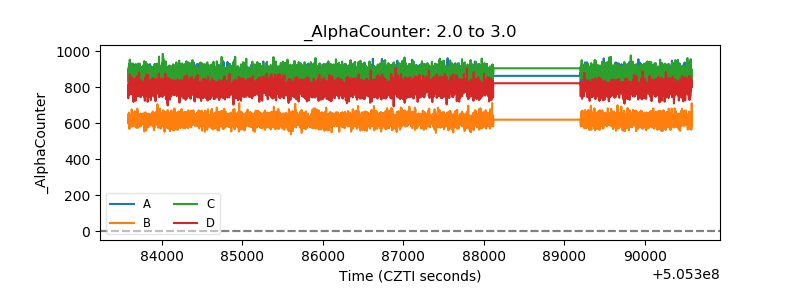 |
| _CPM_Rate | 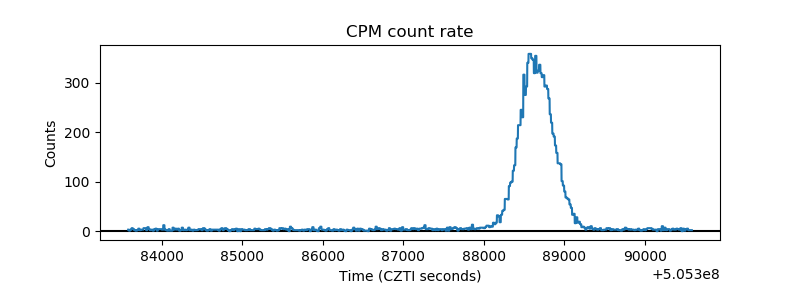 |
| CZT Counter | 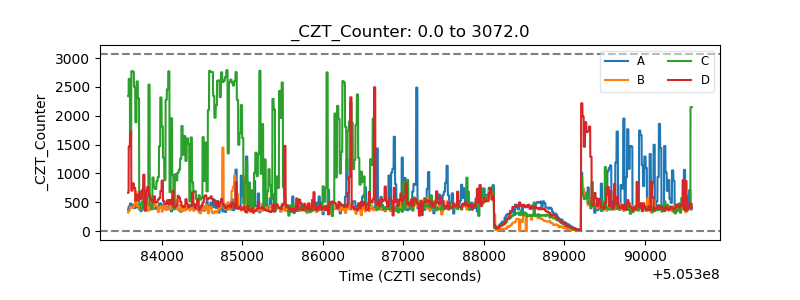 |
| +2.5 Volts monitor | 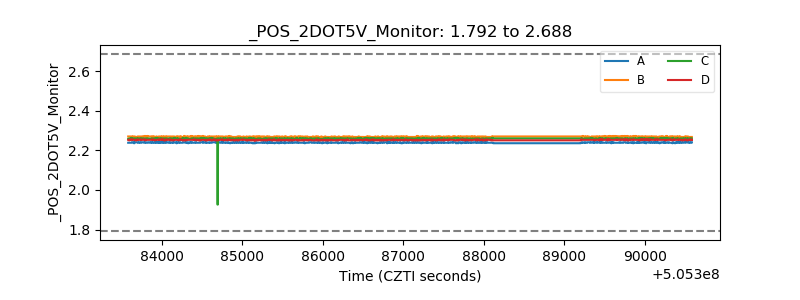 |
| +5 Volts monitor | 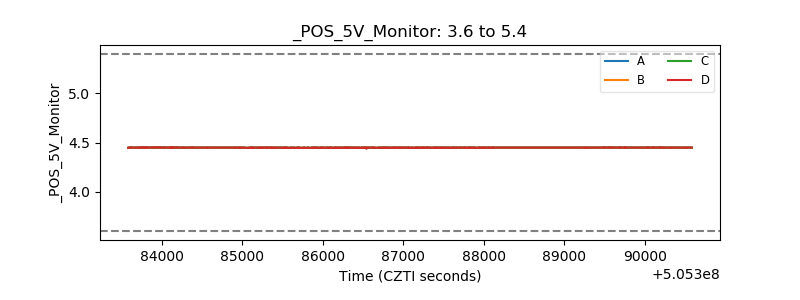 |
| _ROLL_ROT | 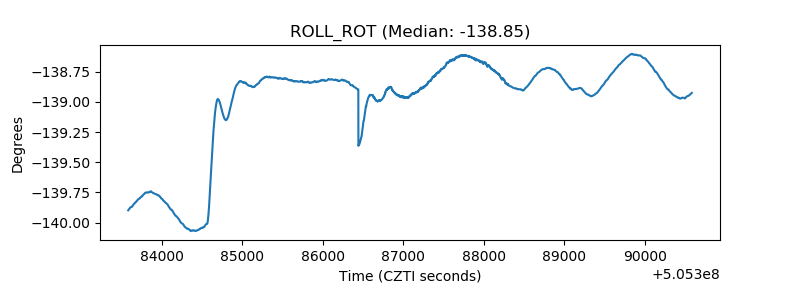 |
| _Roll_DEC | 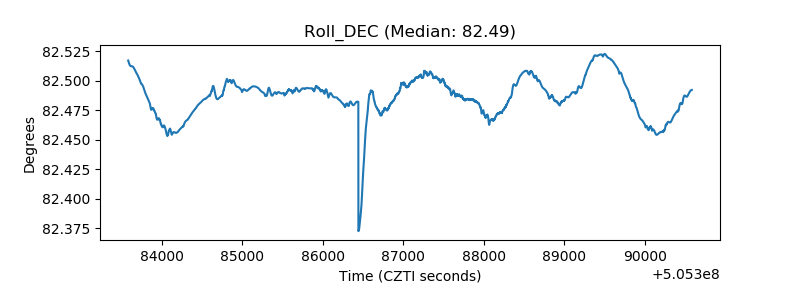 |
| _Roll_RA | 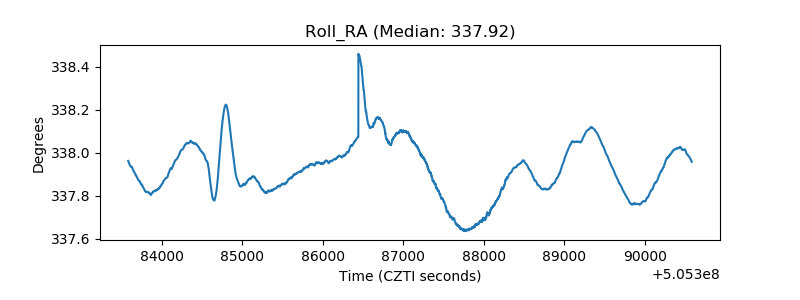 |
| Veto Counter | 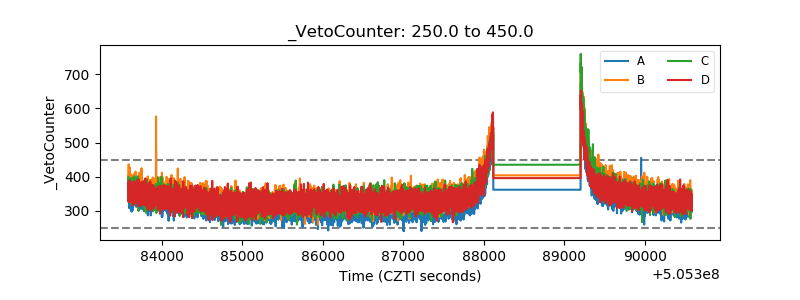 |