| Param | Original file | Final file |
|---|---|---|
| Filename | modeM0/AS1A14_021T06_9000006538_55594cztM0_level2.fits | modeM0/AS1A14_021T06_9000006538_55594cztM0_level2_quad_clean.evt |
| Size (bytes) | 494,475,840 | 93,674,880 |
| Size | 471.6 MB | 89.3 MB |
| Events in quadrant A | 3,746,326 | 627,712 |
| Events in quadrant B | 2,981,398 | 679,146 |
| Events in quadrant C | 7,102,429 | 494,813 |
| Events in quadrant D | 3,944,655 | 560,514 |
| Mode M9 | |||
|---|---|---|---|
| Quadrant | BADHDUFLAG | Total packets | Discarded packets |
| A | 0 | 7 | 0 |
| B | 0 | 7 | 0 |
| C | 0 | 7 | 0 |
| D | 0 | 7 | 0 |
| Mode M0 | |||
|---|---|---|---|
| Quadrant | BADHDUFLAG | Total packets | Discarded packets |
| A | 0 | 16365 | 2 |
| B | 0 | 14250 | 1 |
| C | 0 | 25712 | 1 |
| D | 0 | 16711 | 1 |
| Mode SS | |||
|---|---|---|---|
| Quadrant | BADHDUFLAG | Total packets | Discarded packets |
| A | 0 | 138 | 0 |
| B | 0 | 138 | 0 |
| C | 0 | 138 | 0 |
| D | 0 | 138 | 0 |
| Quadrant | Total seconds | Saturated seconds | Saturation percentage |
|---|---|---|---|
| A | 6804 | 155 | 2.278072% |
| B | 6805 | 57 | 0.837619% |
| C | 6805 | 1278 | 18.780309% |
| D | 6805 | 143 | 2.101396% |
Noise dominated data is calculated using 1-second bins in cleaned event files. If a bin has >2000 counts, and if more than 50% of those come from <1% of pixels, then it is considered to be noise-dominated and hence unusable.
| Quadrant | # 1 sec bins | Bins with >0 counts | Bins with >2000 counts | High rate bins dominated by noise | Noise dominated (total time) | Noise dominated (detector-on time) | Marked lightcurve |
|---|---|---|---|---|---|---|---|
| A | 7529 | 6805 | 70 | 70 | 0.93% | 1.03% | 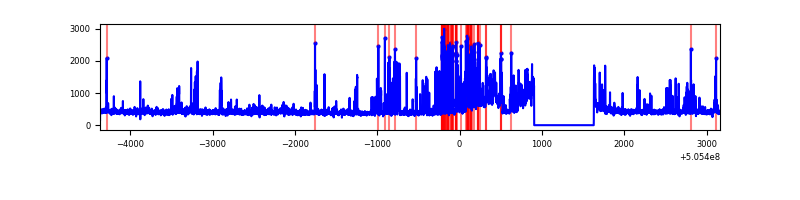 |
| B | 7530 | 6806 | 17 | 17 | 0.23% | 0.25% | 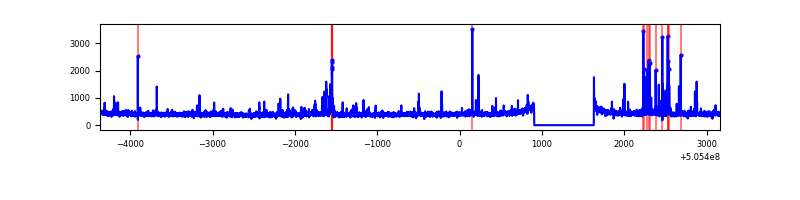 |
| C | 7530 | 6806 | 1091 | 1091 | 14.49% | 16.03% | 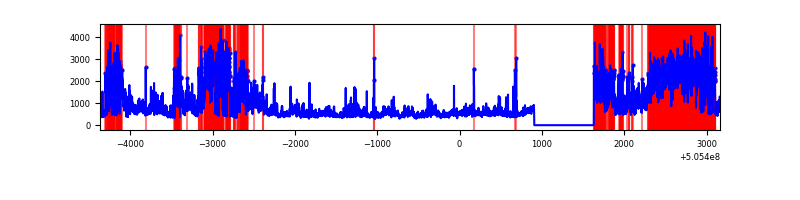 |
| D | 7530 | 6806 | 91 | 91 | 1.21% | 1.34% | 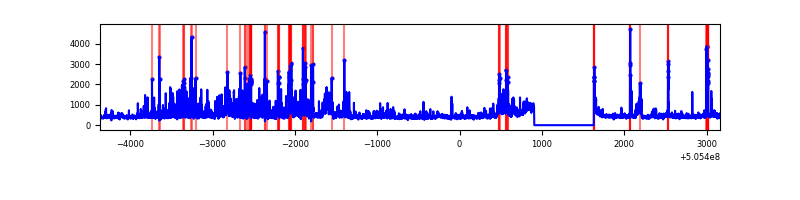 |
Top three noisy pixels from each quadrant. If the there are fewer than three noisy pixels in the level2.evt file, extra rows are filled as -1
| Pixel properties | Quadrant properties | ||||||
|---|---|---|---|---|---|---|---|
| Quadrant | DetID | PixID | Counts | Sigma | Mean | Median | Sigma |
| A | 8 | 249 | 605848 | 3540.58 | 693 | 675 | 170.9 |
| A | 12 | 115 | 254074 | 1482.52 | 693 | 675 | 170.9 |
| A | 3 | 14 | 65515 | 379.35 | 693 | 675 | 170.9 |
| B | 1 | 159 | 87315 | 599.68 | 683 | 660 | 144.5 |
| B | 4 | 169 | 68016 | 466.13 | 683 | 660 | 144.5 |
| B | 10 | 247 | 25667 | 173.06 | 683 | 660 | 144.5 |
| C | 9 | 38 | 3839649 | 22528.96 | 620 | 612 | 170.4 |
| C | 6 | 223 | 651574 | 3820.1 | 620 | 612 | 170.4 |
| C | 13 | 3 | 66892 | 388.96 | 620 | 612 | 170.4 |
| D | 15 | 125 | 361707 | 1900.97 | 671 | 640 | 189.9 |
| D | 3 | 12 | 226775 | 1190.57 | 671 | 640 | 189.9 |
| D | 2 | 249 | 177541 | 931.36 | 671 | 640 | 189.9 |
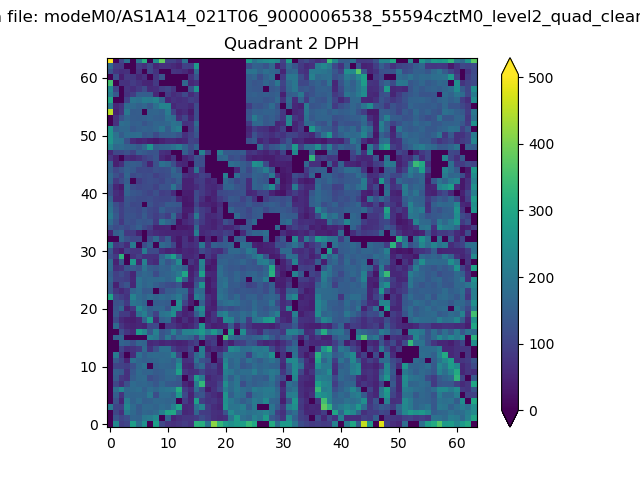
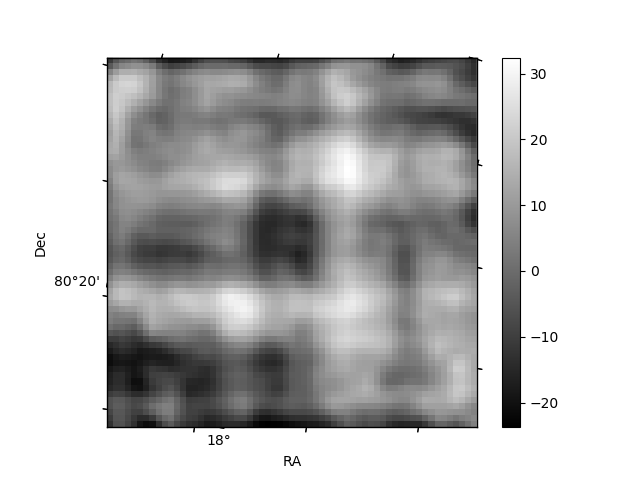
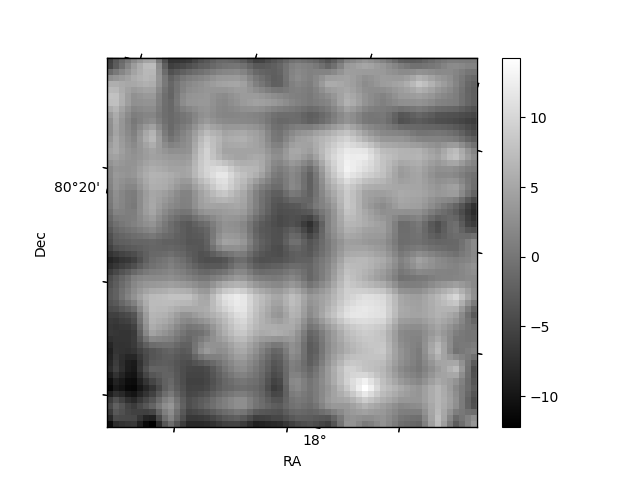
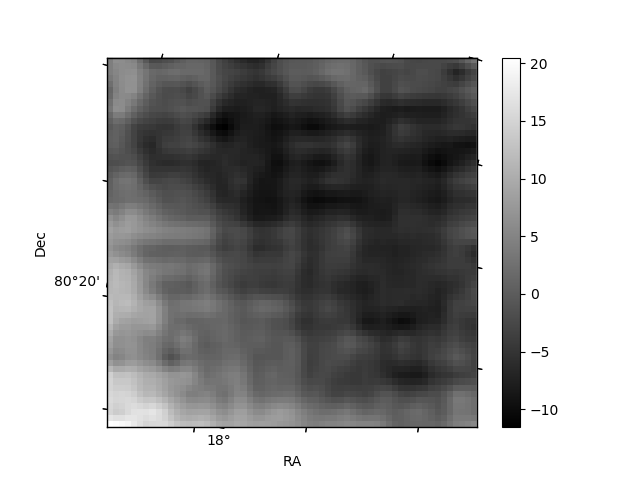
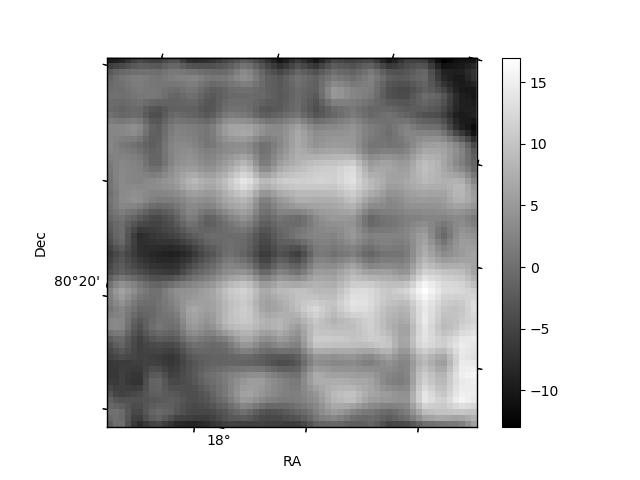
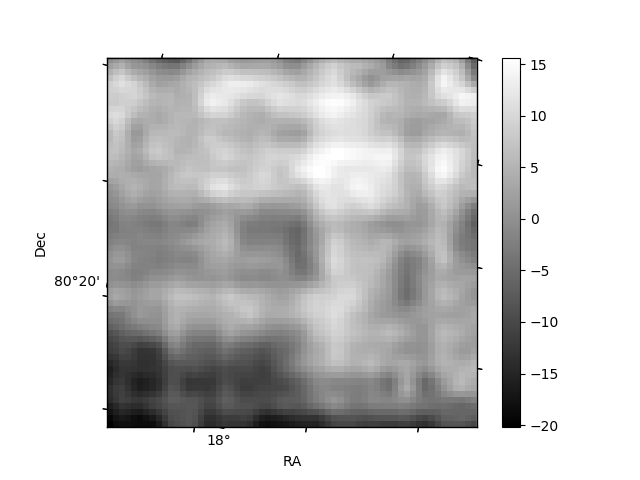
Histogram calculated using DETX and DETY for each event in the final _common_clean file
| Quadrant A | 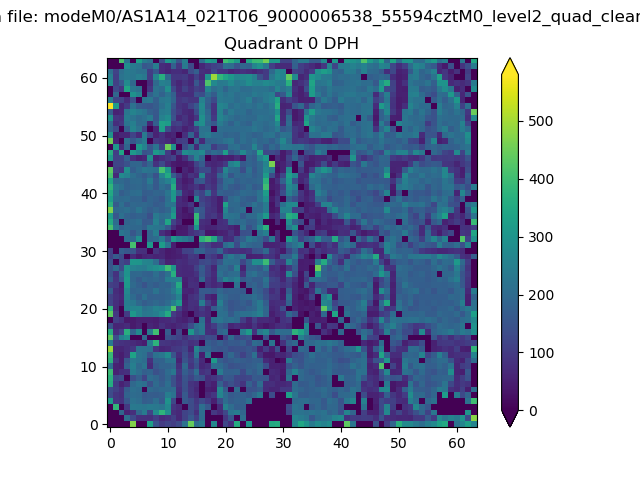 |
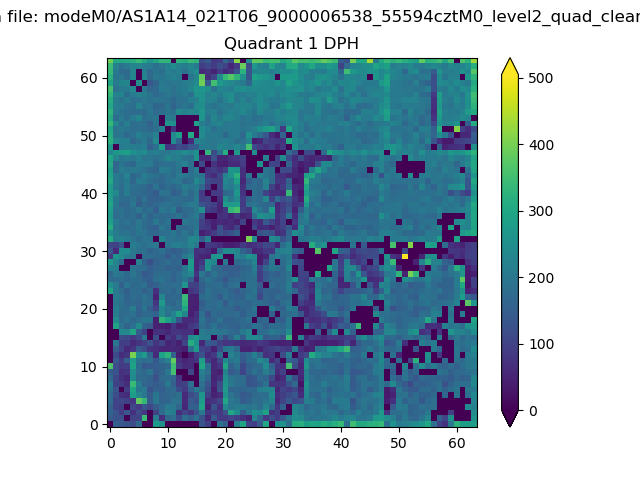 |
Quadrant B |
|---|---|---|---|
| Quadrant D | 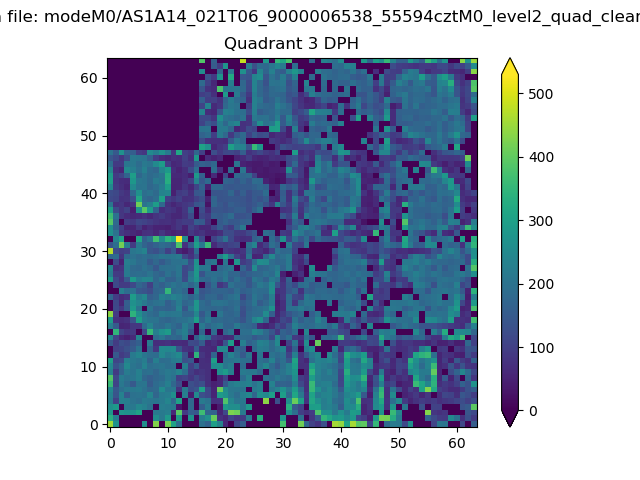 |
 |
Quadrant C |
| Plot type | Count rate plots | Images |
|---|---|---|
| Comparison with Poisson distribution Blue bars denote a histogram of data divided into 1 sec bins. Red curve is a Poisson curve with rate = median count rate of data. |
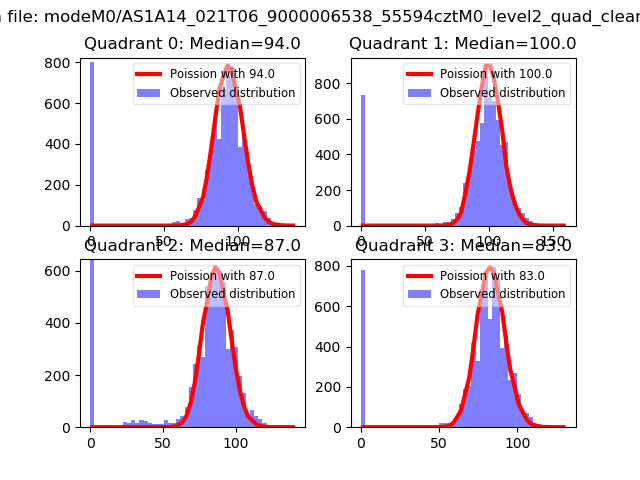 |
 |
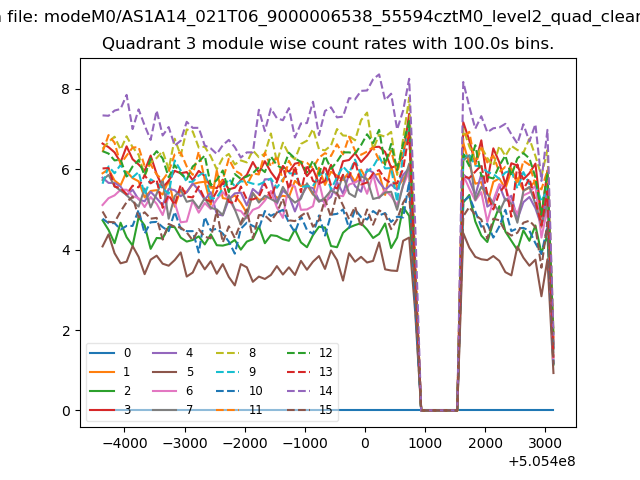
| Quadrant-wise count rates Data is divided into 100 sec bins |
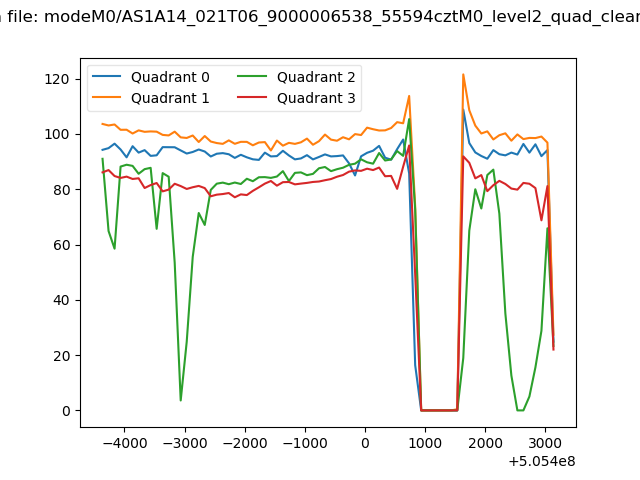 |
|
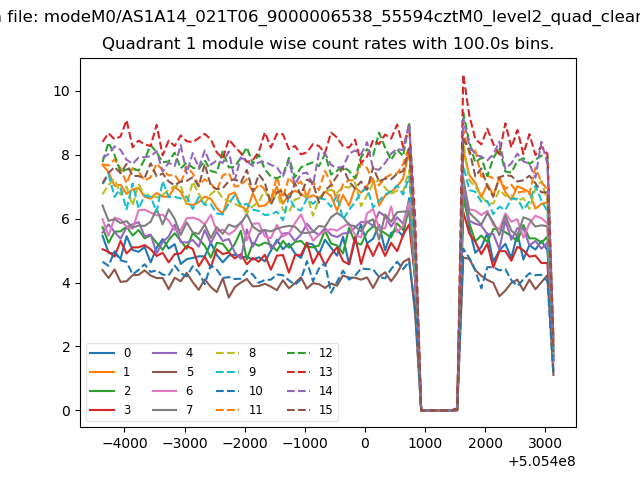
| Module-wise count rates for Quadrant A Data is divided into 100 sec bins |
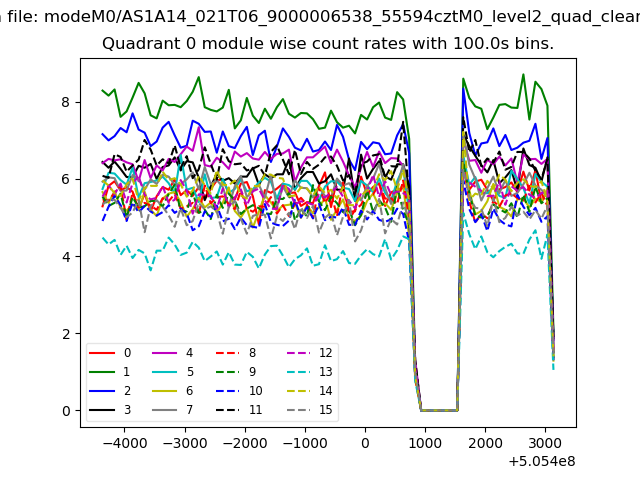 |
 |
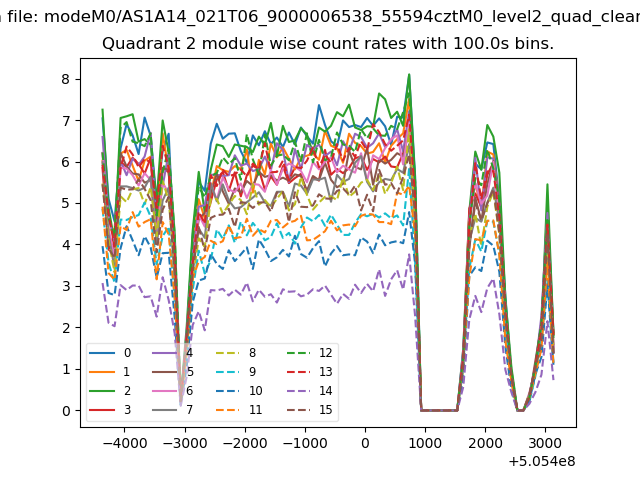
| Module-wise count rates for Quadrant B Data is divided into 100 sec bins |
 |
 |
| Module-wise count rates for Quadrant C Data is divided into 100 sec bins |
 |
 |
| Module-wise count rates for Quadrant D Data is divided into 100 sec bins |
 |
 |
| Parameter | Plot |
|---|---|
| CZT HV Monitor | 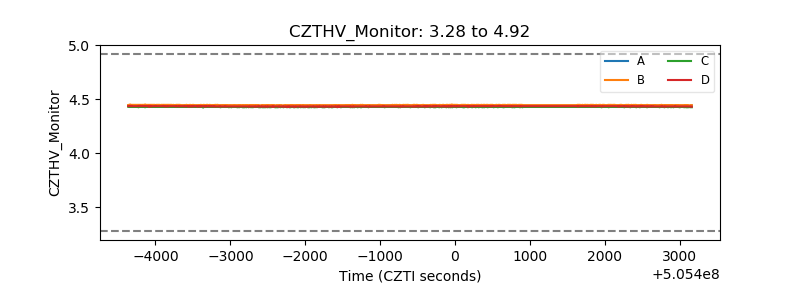 |
| D_VDD | 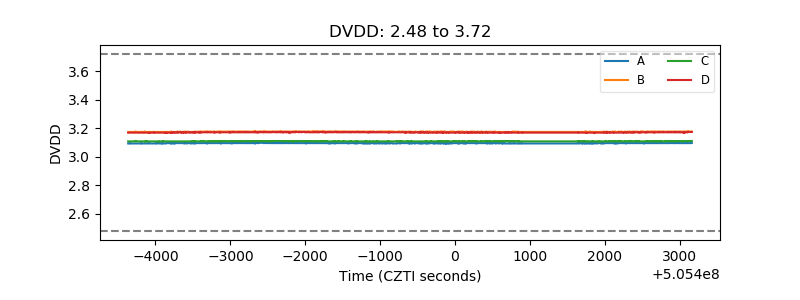 |
| Temperature 1 | 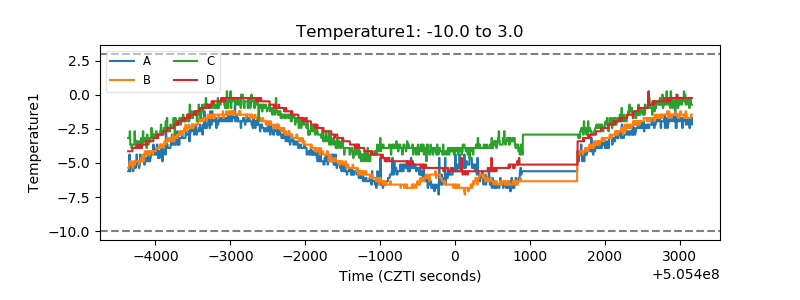 |
| Veto HV Monitor | 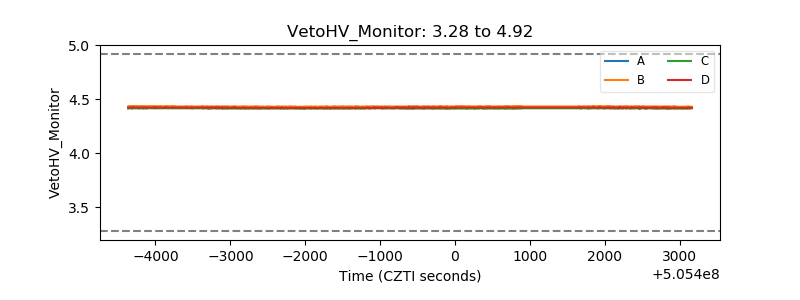 |
| Veto LLD | 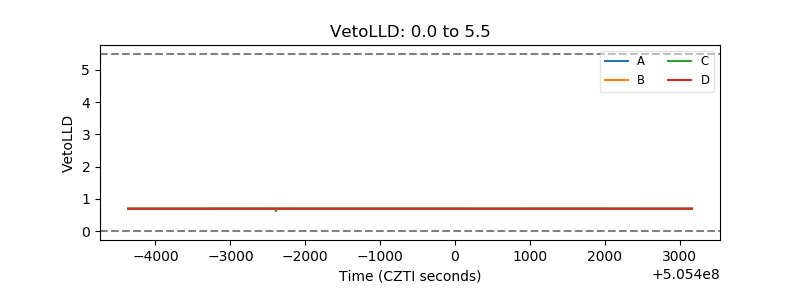 |
| Alpha Counter | 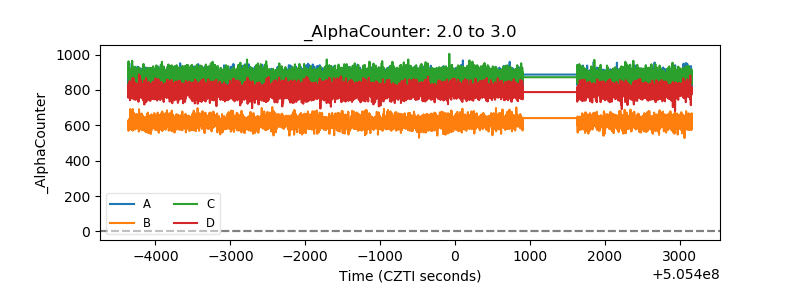 |
| _CPM_Rate | 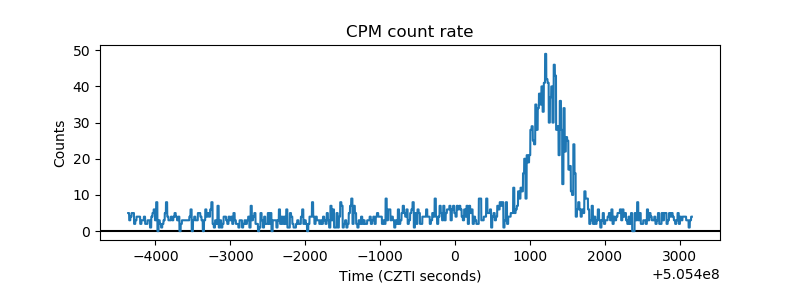 |
| CZT Counter | 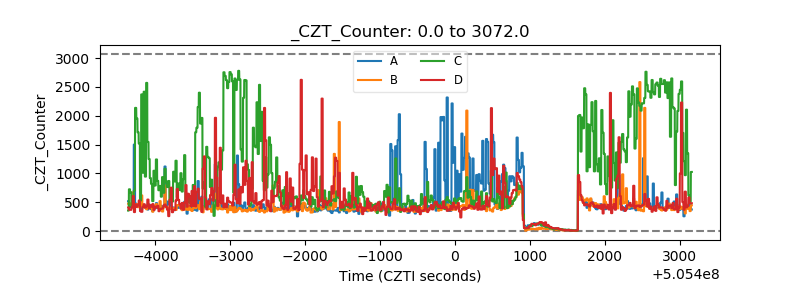 |
| +2.5 Volts monitor | 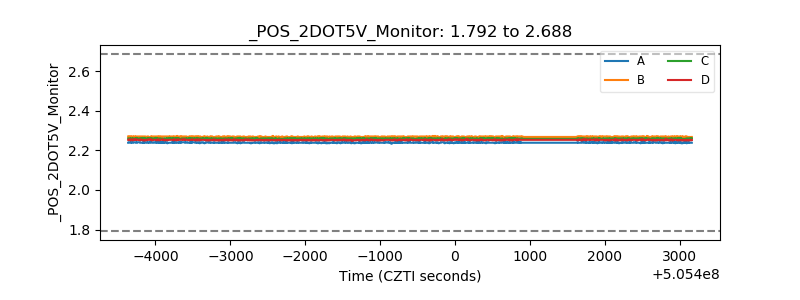 |
| +5 Volts monitor | 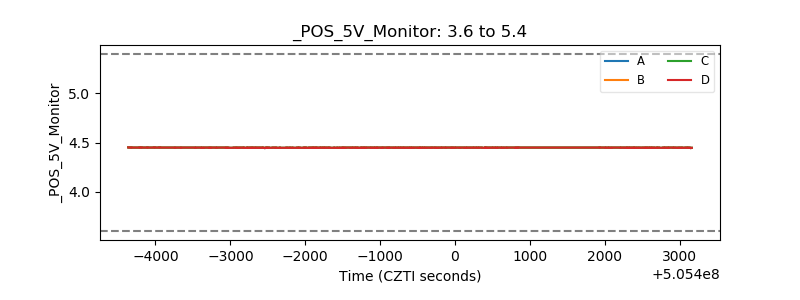 |
| _ROLL_ROT | 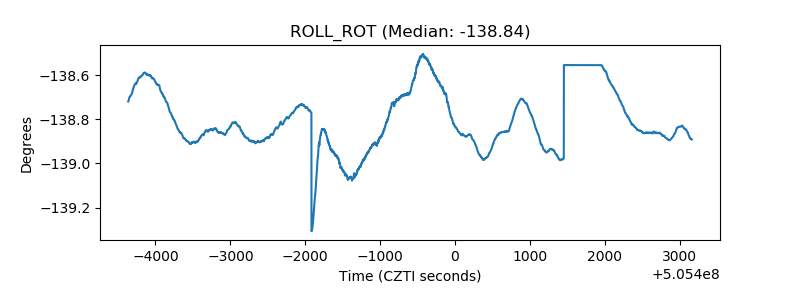 |
| _Roll_DEC | 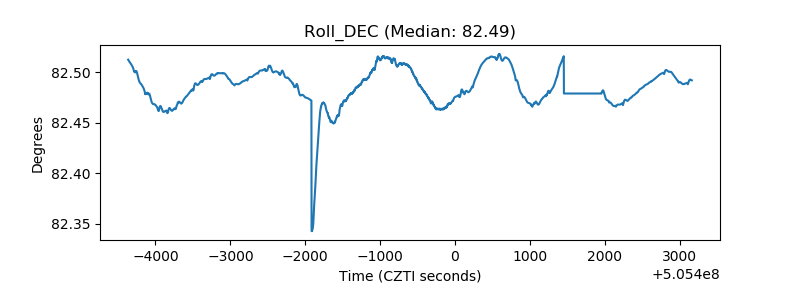 |
| _Roll_RA | 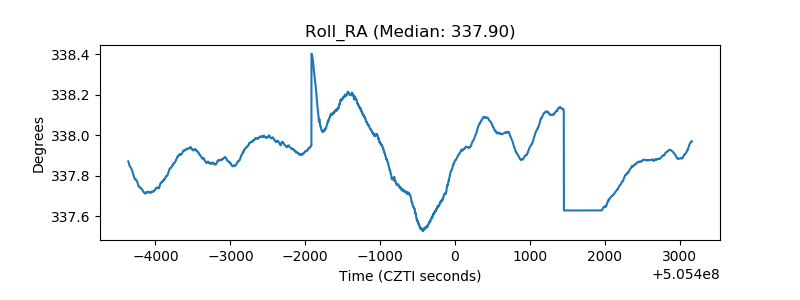 |
| Veto Counter | 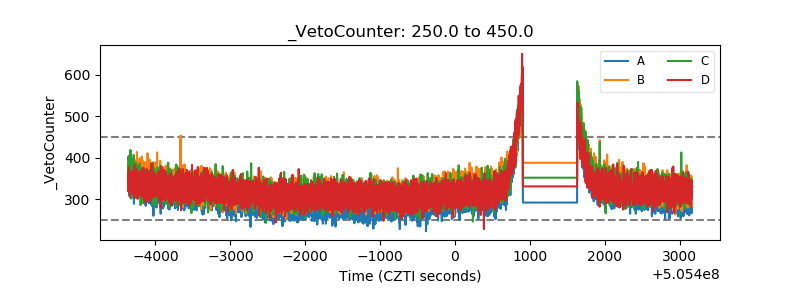 |