| Param | Original file | Final file |
|---|---|---|
| Filename | modeM0/AS1A14_021T06_9000006538_55595cztM0_level2.fits | modeM0/AS1A14_021T06_9000006538_55595cztM0_level2_quad_clean.evt |
| Size (bytes) | 626,232,960 | 101,206,080 |
| Size | 597.2 MB | 96.5 MB |
| Events in quadrant A | 3,936,012 | 702,921 |
| Events in quadrant B | 3,565,953 | 752,218 |
| Events in quadrant C | 10,737,813 | 469,814 |
| Events in quadrant D | 4,354,138 | 612,932 |
| Mode M0 | |||
|---|---|---|---|
| Quadrant | BADHDUFLAG | Total packets | Discarded packets |
| A | 0 | 17465 | 0 |
| B | 0 | 16498 | 0 |
| C | 0 | 37164 | 5 |
| D | 0 | 18652 | 0 |
| Mode SS | |||
|---|---|---|---|
| Quadrant | BADHDUFLAG | Total packets | Discarded packets |
| A | 0 | 152 | 0 |
| B | 0 | 152 | 0 |
| C | 0 | 152 | 0 |
| D | 0 | 152 | 0 |
| Quadrant | Total seconds | Saturated seconds | Saturation percentage |
|---|---|---|---|
| A | 7561 | 154 | 2.036768% |
| B | 7562 | 144 | 1.904258% |
| C | 7561 | 2459 | 32.522153% |
| D | 7561 | 301 | 3.980955% |
Noise dominated data is calculated using 1-second bins in cleaned event files. If a bin has >2000 counts, and if more than 50% of those come from <1% of pixels, then it is considered to be noise-dominated and hence unusable.
| Quadrant | # 1 sec bins | Bins with >0 counts | Bins with >2000 counts | High rate bins dominated by noise | Noise dominated (total time) | Noise dominated (detector-on time) | Marked lightcurve |
|---|---|---|---|---|---|---|---|
| A | 7561 | 7561 | 94 | 94 | 1.24% | 1.24% | 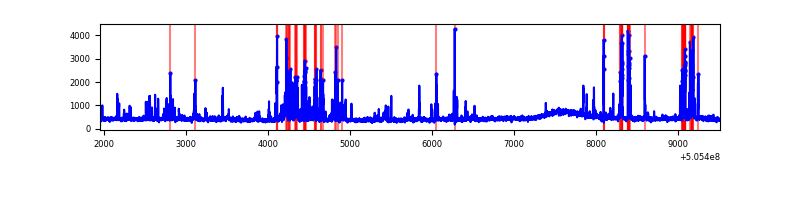 |
| B | 7562 | 7562 | 37 | 37 | 0.49% | 0.49% | 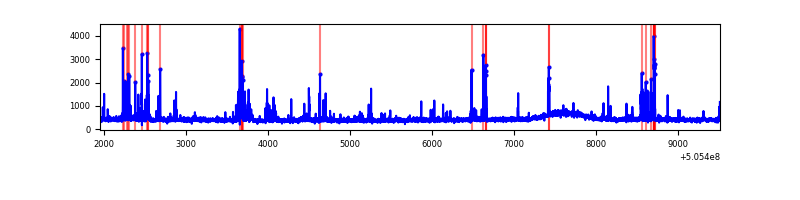 |
| C | 7561 | 7561 | 2132 | 2132 | 28.20% | 28.20% | 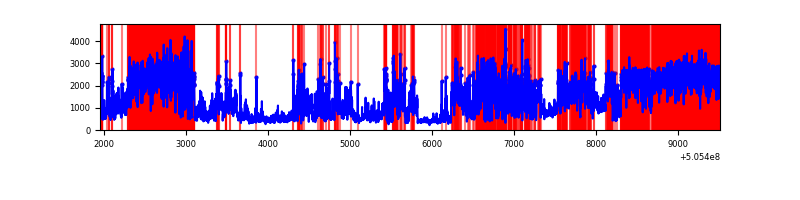 |
| D | 7561 | 7561 | 219 | 219 | 2.90% | 2.90% | 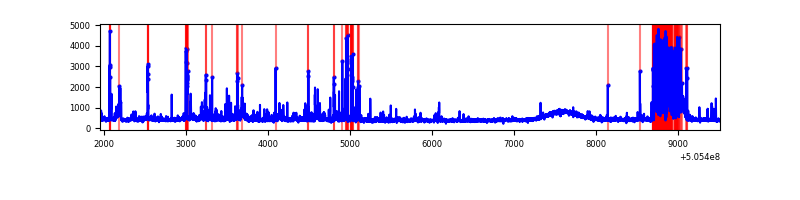 |
Top three noisy pixels from each quadrant. If the there are fewer than three noisy pixels in the level2.evt file, extra rows are filled as -1
| Pixel properties | Quadrant properties | ||||||
|---|---|---|---|---|---|---|---|
| Quadrant | DetID | PixID | Counts | Sigma | Mean | Median | Sigma |
| A | 0 | 8 | 536846 | 2755.32 | 796 | 774 | 194.6 |
| A | 8 | 249 | 175092 | 895.96 | 796 | 774 | 194.6 |
| A | 15 | 32 | 44599 | 225.25 | 796 | 774 | 194.6 |
| B | 0 | 171 | 220386 | 1322.03 | 782 | 752 | 166.1 |
| B | 1 | 159 | 86062 | 513.5 | 782 | 752 | 166.1 |
| B | 4 | 169 | 40922 | 241.79 | 782 | 752 | 166.1 |
| C | 9 | 38 | 7728600 | 41201.42 | 689 | 681 | 187.6 |
| C | 13 | 3 | 78617 | 415.51 | 689 | 681 | 187.6 |
| C | 6 | 223 | 69985 | 369.49 | 689 | 681 | 187.6 |
| D | 2 | 249 | 540077 | 2492.34 | 772 | 738 | 216.4 |
| D | 10 | 181 | 181750 | 836.48 | 772 | 738 | 216.4 |
| D | 15 | 125 | 112120 | 514.71 | 772 | 738 | 216.4 |
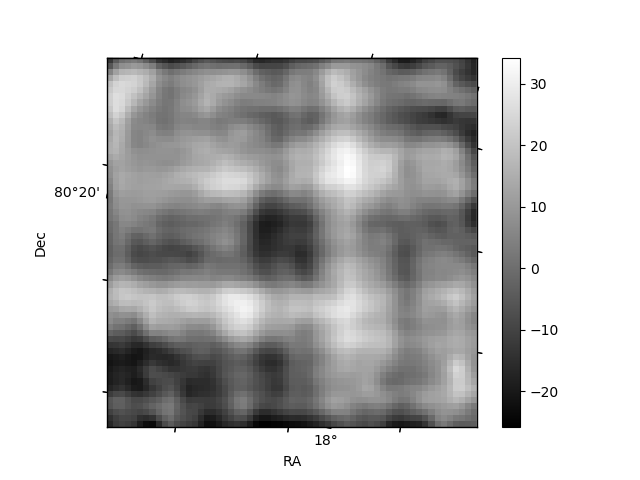
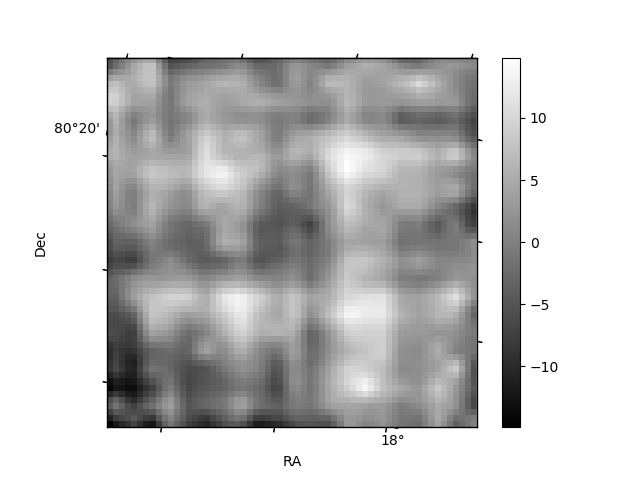
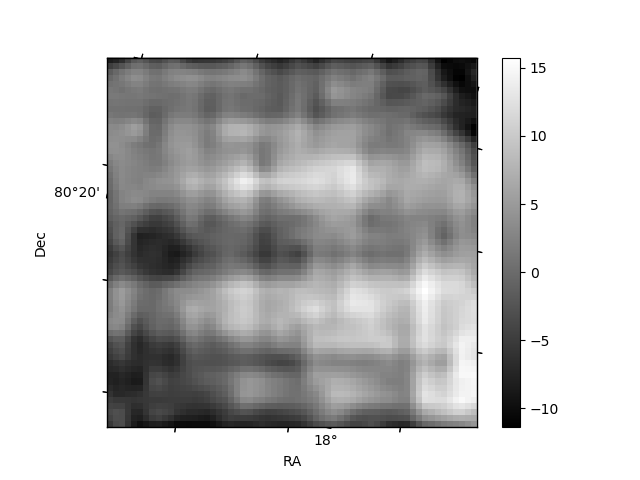
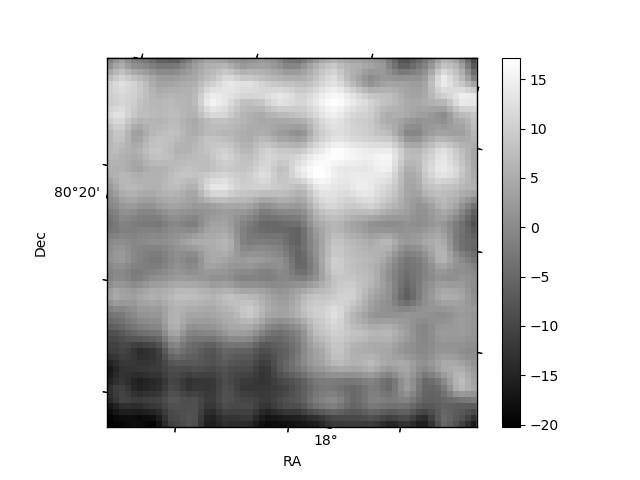
Histogram calculated using DETX and DETY for each event in the final _common_clean file
| Quadrant A | 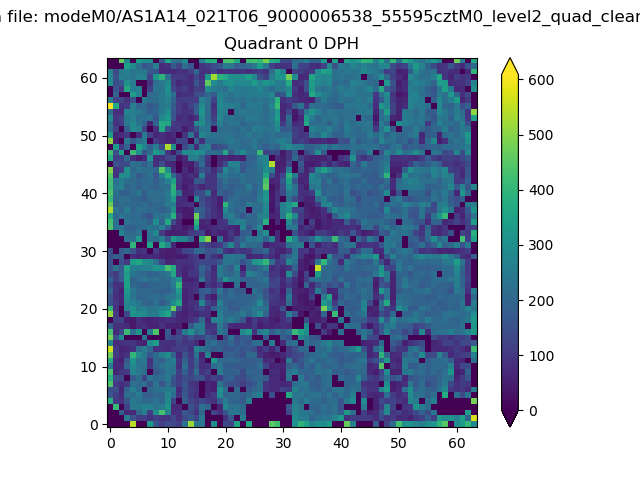 |
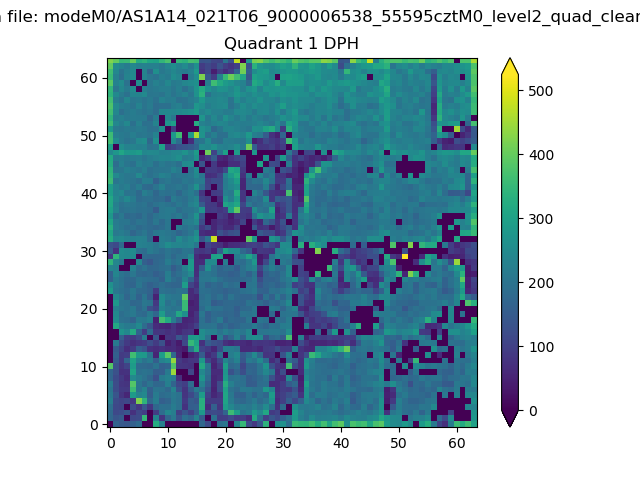 |
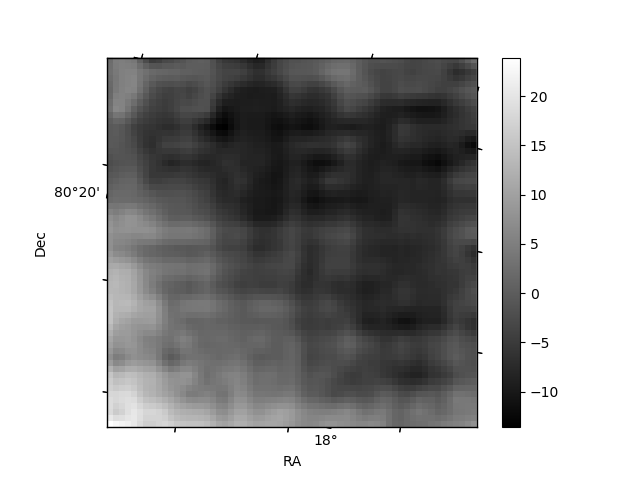
Quadrant B |
|---|---|---|---|
| Quadrant D | 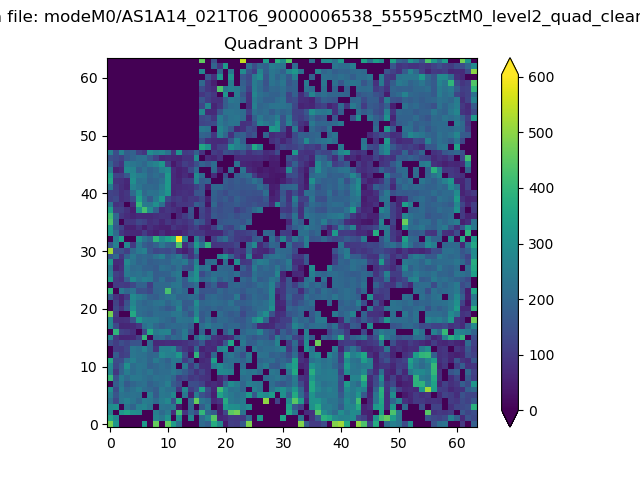 |
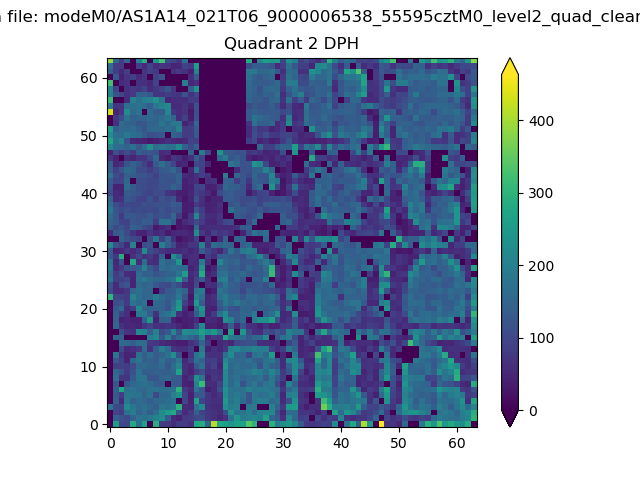 |
Quadrant C |
| Plot type | Count rate plots | Images |
|---|---|---|
| Comparison with Poisson distribution Blue bars denote a histogram of data divided into 1 sec bins. Red curve is a Poisson curve with rate = median count rate of data. |
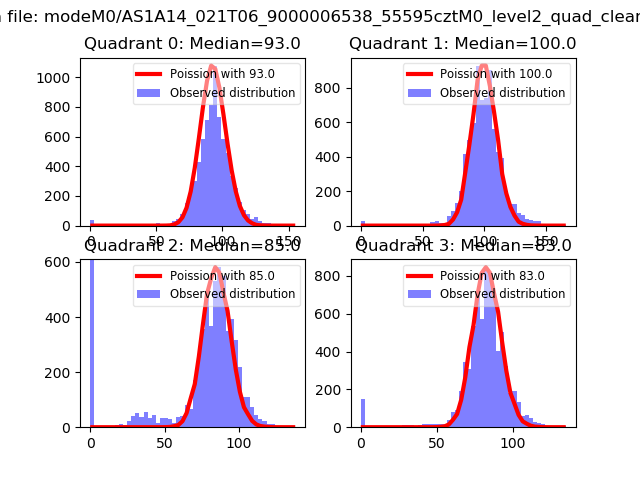 |
 |
| Quadrant-wise count rates Data is divided into 100 sec bins |
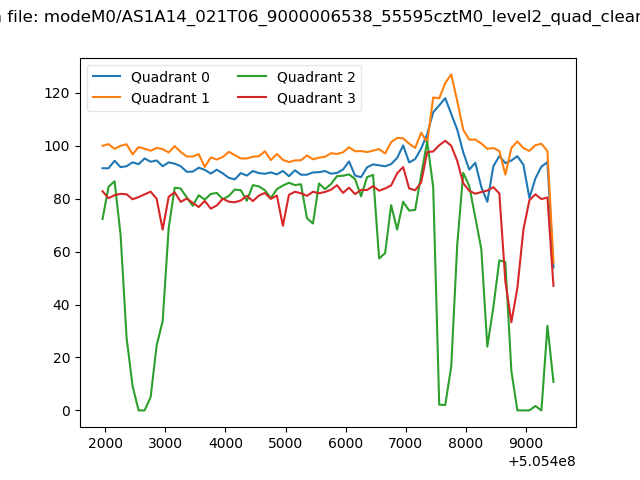 |
|
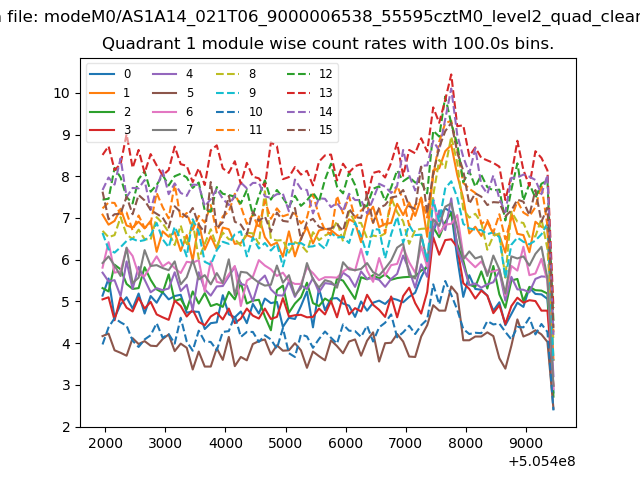
| Module-wise count rates for Quadrant A Data is divided into 100 sec bins |
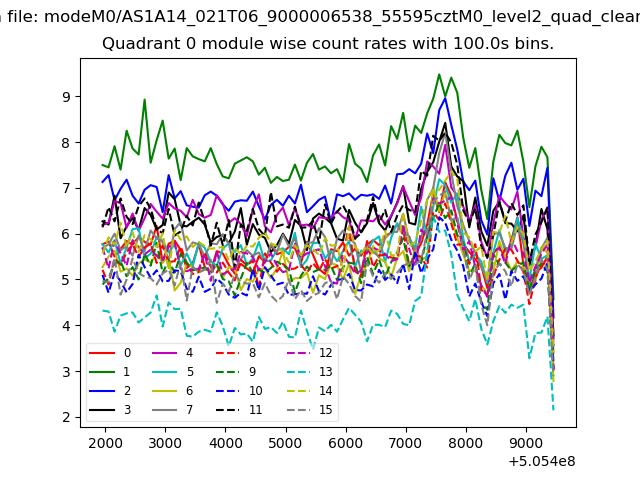 |
 |
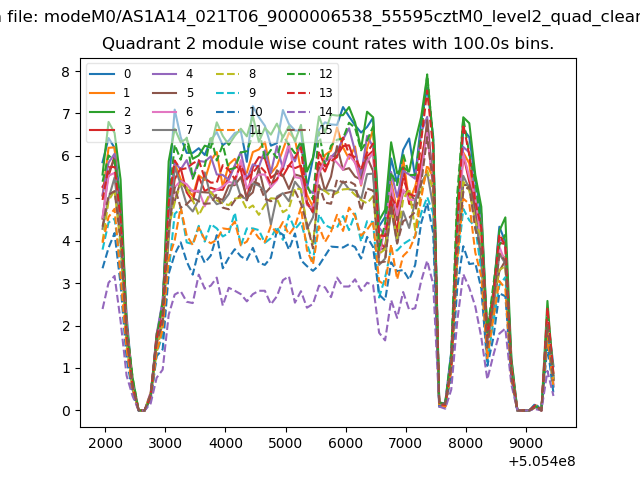
| Module-wise count rates for Quadrant B Data is divided into 100 sec bins |
 |
 |
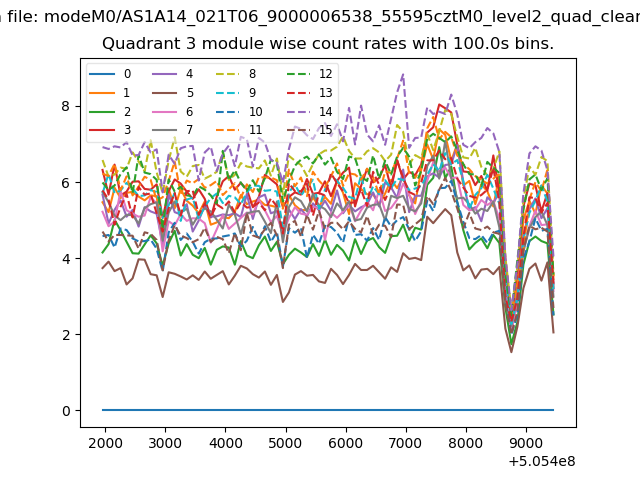
| Module-wise count rates for Quadrant C Data is divided into 100 sec bins |
 |
 |
| Module-wise count rates for Quadrant D Data is divided into 100 sec bins |
 |
 |
| Parameter | Plot |
|---|---|
| CZT HV Monitor | 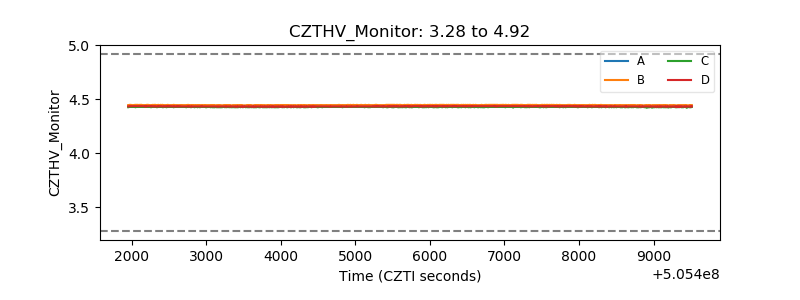 |
| D_VDD | 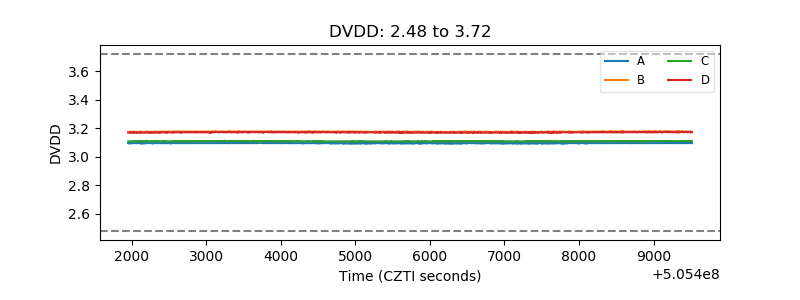 |
| Temperature 1 | 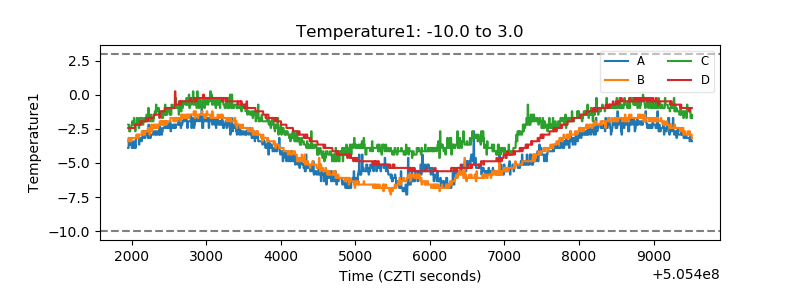 |
| Veto HV Monitor | 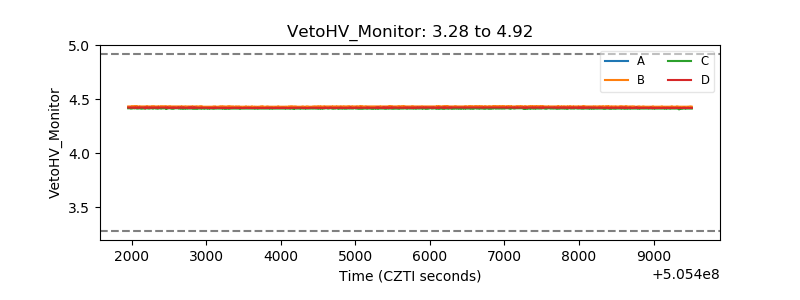 |
| Veto LLD | 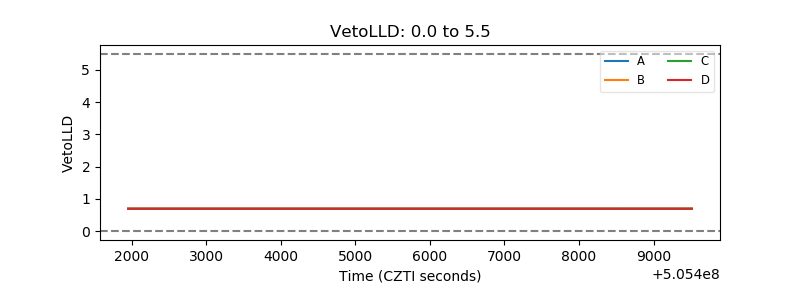 |
| Alpha Counter | 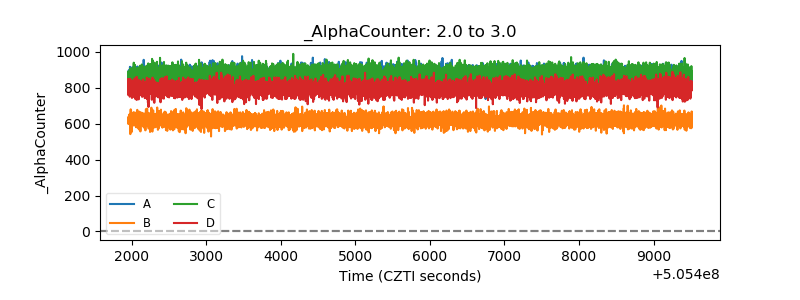 |
| _CPM_Rate | 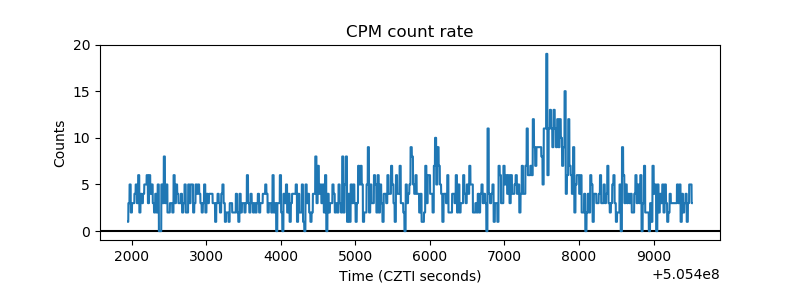 |
| CZT Counter | 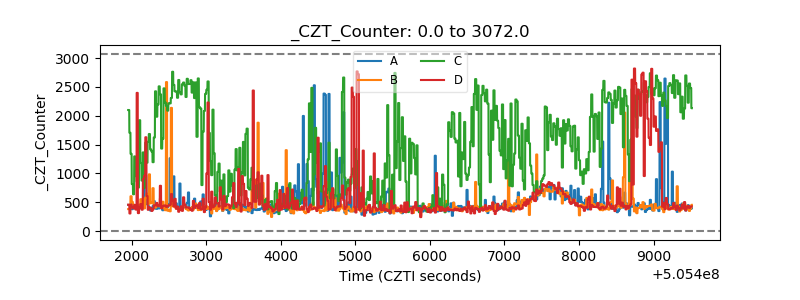 |
| +2.5 Volts monitor |  |
| +5 Volts monitor |  |
| _ROLL_ROT | 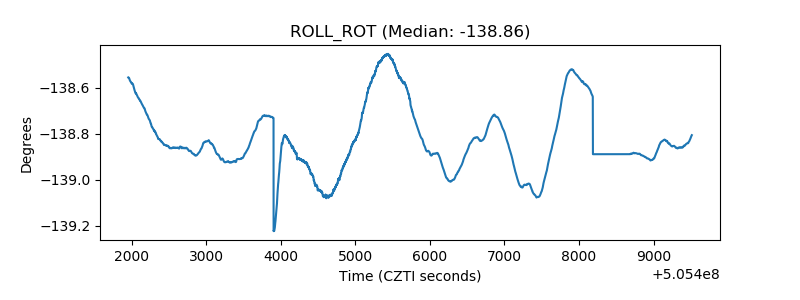 |
| _Roll_DEC | 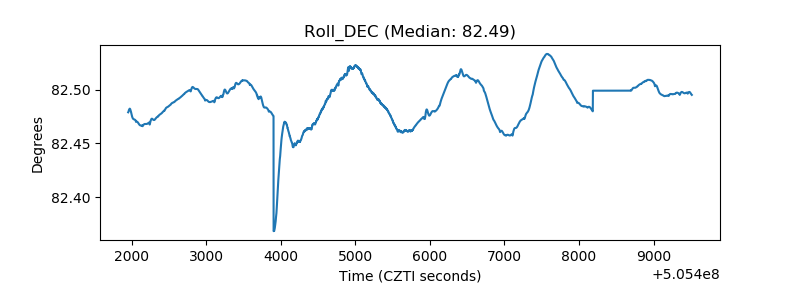 |
| _Roll_RA | 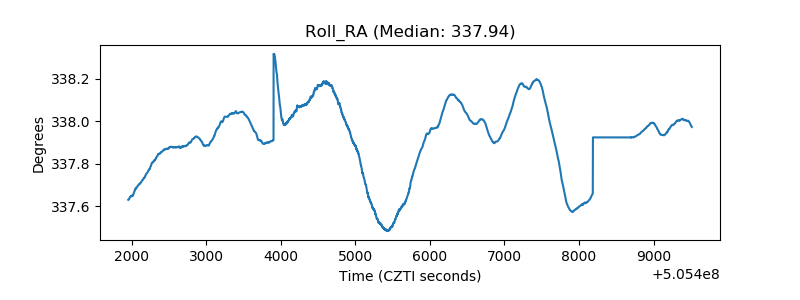 |
| Veto Counter | 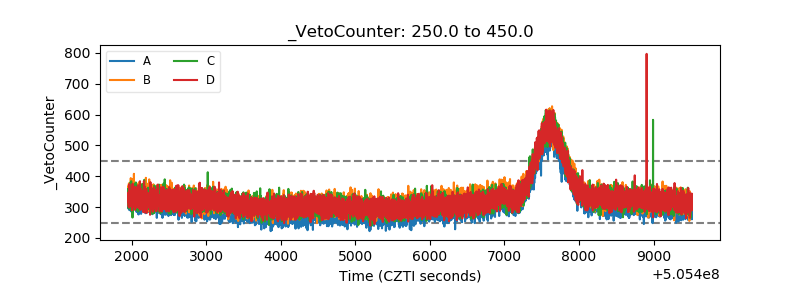 |