| Param | Original file | Final file |
|---|---|---|
| Filename | modeM0/AS1A14_021T06_9000006538_55596cztM0_level2.fits | modeM0/AS1A14_021T06_9000006538_55596cztM0_level2_quad_clean.evt |
| Size (bytes) | 566,530,560 | 94,086,720 |
| Size | 540.3 MB | 89.7 MB |
| Events in quadrant A | 3,947,430 | 642,162 |
| Events in quadrant B | 3,457,736 | 692,473 |
| Events in quadrant C | 8,843,968 | 460,130 |
| Events in quadrant D | 4,175,783 | 564,341 |
| Mode M0 | |||
|---|---|---|---|
| Quadrant | BADHDUFLAG | Total packets | Discarded packets |
| A | 0 | 16978 | 2 |
| B | 0 | 15675 | 0 |
| C | 0 | 31154 | 0 |
| D | 0 | 17512 | 0 |
| Mode SS | |||
|---|---|---|---|
| Quadrant | BADHDUFLAG | Total packets | Discarded packets |
| A | 0 | 140 | 0 |
| B | 0 | 140 | 0 |
| C | 0 | 140 | 0 |
| D | 0 | 140 | 0 |
| Quadrant | Total seconds | Saturated seconds | Saturation percentage |
|---|---|---|---|
| A | 7030 | 171 | 2.432432% |
| B | 7031 | 68 | 0.967145% |
| C | 7031 | 1976 | 28.104110% |
| D | 7031 | 226 | 3.214337% |
Noise dominated data is calculated using 1-second bins in cleaned event files. If a bin has >2000 counts, and if more than 50% of those come from <1% of pixels, then it is considered to be noise-dominated and hence unusable.
| Quadrant | # 1 sec bins | Bins with >0 counts | Bins with >2000 counts | High rate bins dominated by noise | Noise dominated (total time) | Noise dominated (detector-on time) | Marked lightcurve |
|---|---|---|---|---|---|---|---|
| A | 7030 | 7030 | 160 | 160 | 2.28% | 2.28% | 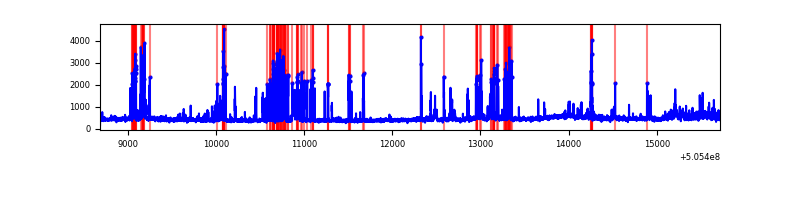 |
| B | 7031 | 7031 | 41 | 41 | 0.58% | 0.58% | 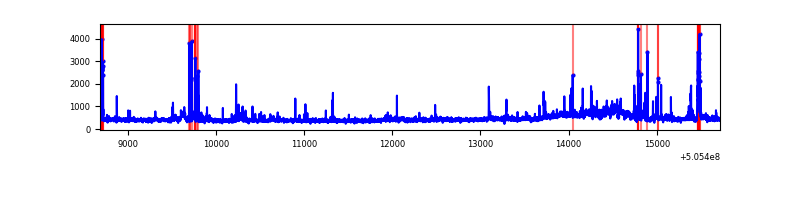 |
| C | 7031 | 7031 | 1949 | 1949 | 27.72% | 27.72% | 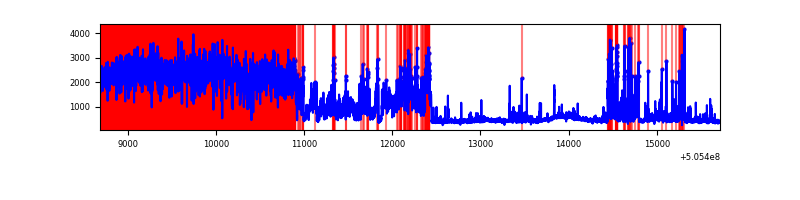 |
| D | 7031 | 7031 | 203 | 203 | 2.89% | 2.89% | 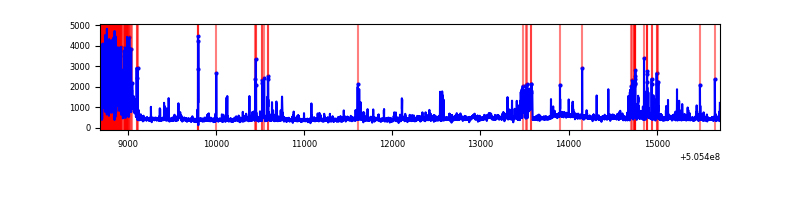 |
Top three noisy pixels from each quadrant. If the there are fewer than three noisy pixels in the level2.evt file, extra rows are filled as -1
| Pixel properties | Quadrant properties | ||||||
|---|---|---|---|---|---|---|---|
| Quadrant | DetID | PixID | Counts | Sigma | Mean | Median | Sigma |
| A | 8 | 249 | 679100 | 3789.38 | 715 | 698 | 179.0 |
| A | 0 | 8 | 263075 | 1465.57 | 715 | 698 | 179.0 |
| A | 4 | 159 | 118687 | 659.06 | 715 | 698 | 179.0 |
| B | 7 | 0 | 266584 | 1738.08 | 709 | 682 | 153.0 |
| B | 0 | 171 | 232594 | 1515.91 | 709 | 682 | 153.0 |
| B | 5 | 236 | 36440 | 233.73 | 709 | 682 | 153.0 |
| C | 9 | 38 | 5647760 | 32432.3 | 639 | 631 | 174.1 |
| C | 13 | 16 | 373672 | 2142.43 | 639 | 631 | 174.1 |
| C | 10 | 19 | 74023 | 421.5 | 639 | 631 | 174.1 |
| D | 2 | 249 | 478433 | 2459.98 | 691 | 661 | 194.2 |
| D | 10 | 181 | 328371 | 1687.33 | 691 | 661 | 194.2 |
| D | 9 | 19 | 148771 | 762.6 | 691 | 661 | 194.2 |
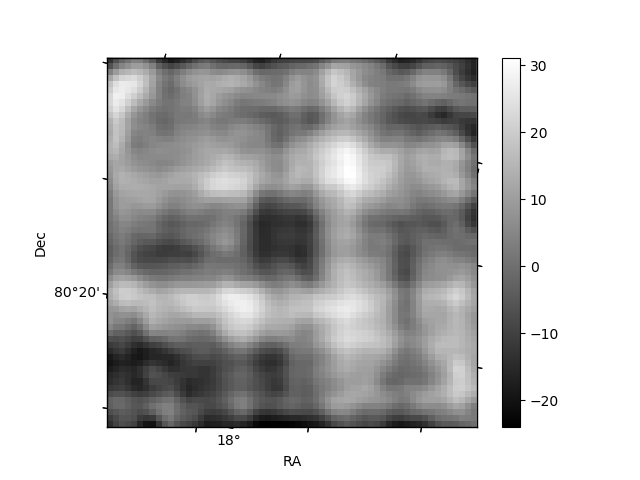
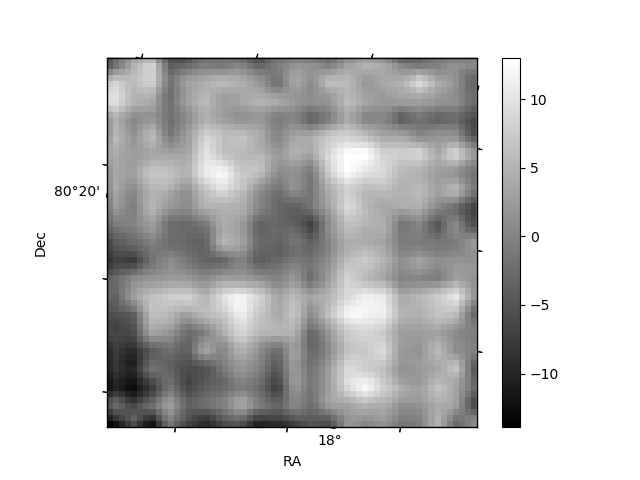
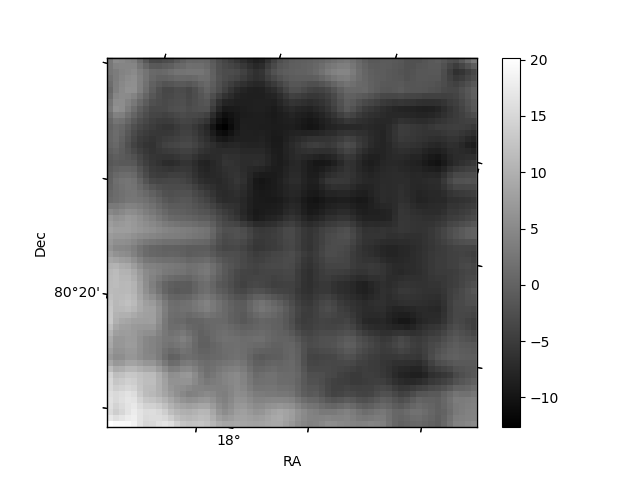
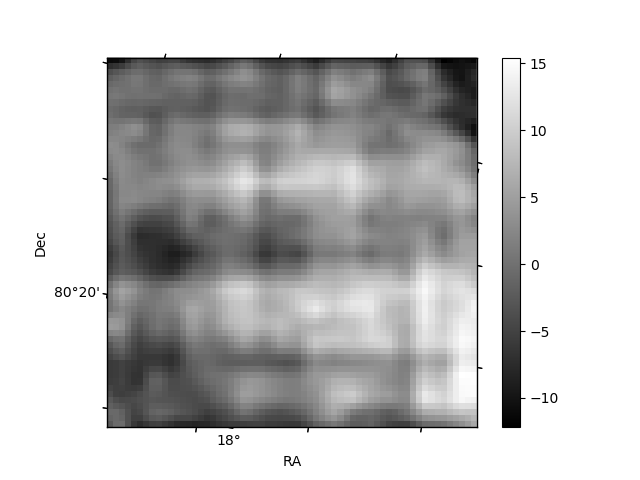
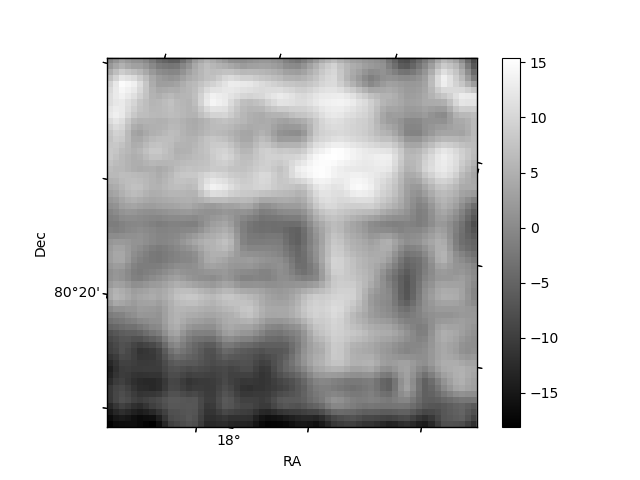
Histogram calculated using DETX and DETY for each event in the final _common_clean file
| Quadrant A | 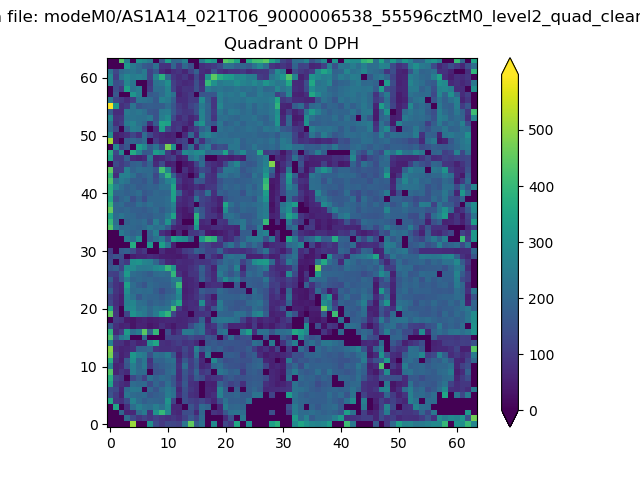 |
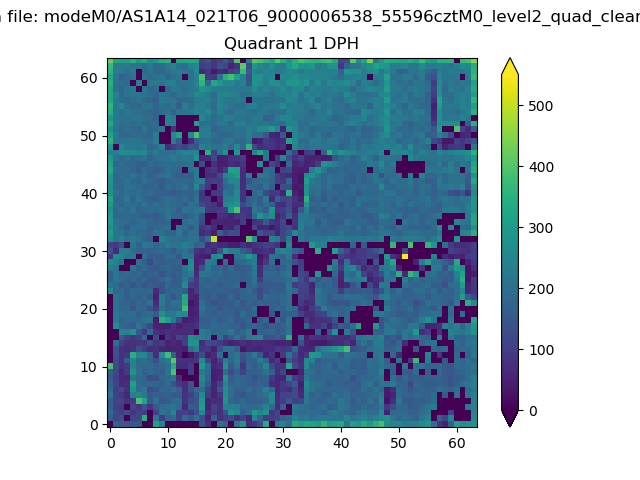 |
Quadrant B |
|---|---|---|---|
| Quadrant D | 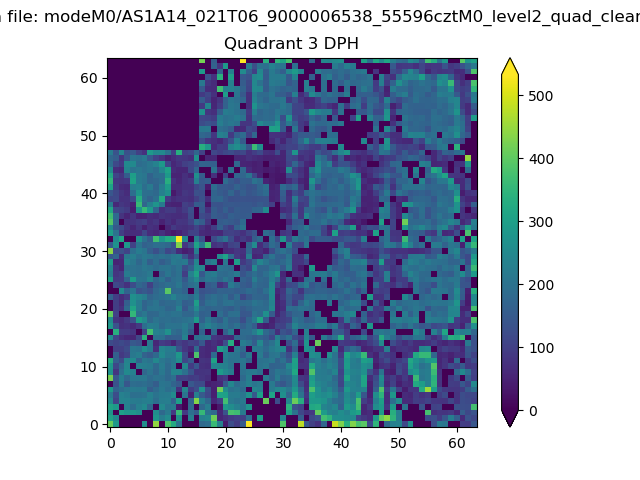 |
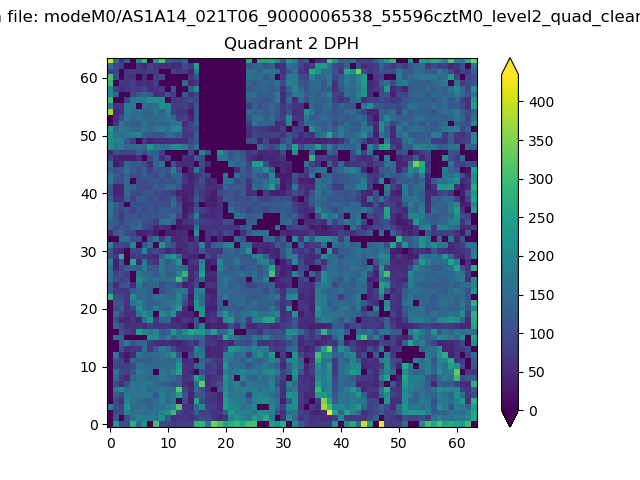 |
Quadrant C |
| Plot type | Count rate plots | Images |
|---|---|---|
| Comparison with Poisson distribution Blue bars denote a histogram of data divided into 1 sec bins. Red curve is a Poisson curve with rate = median count rate of data. |
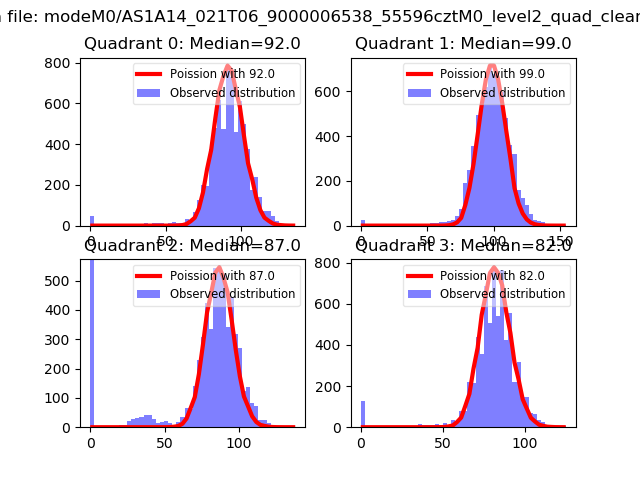 |
 |
| Quadrant-wise count rates Data is divided into 100 sec bins |
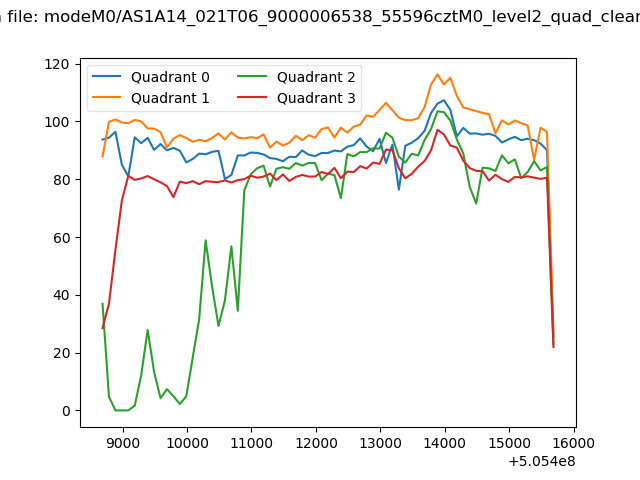 |
|
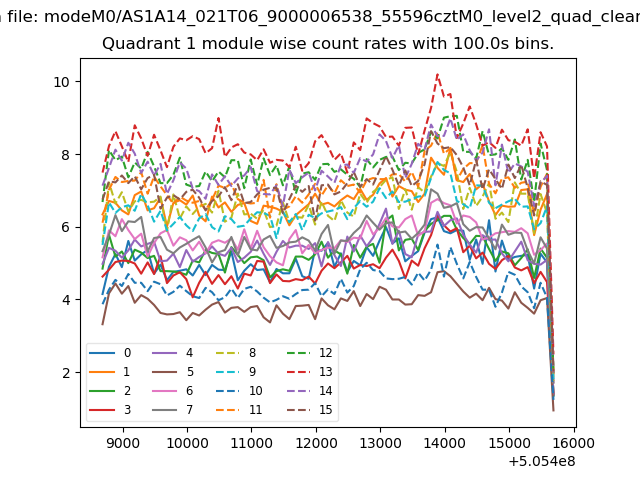
| Module-wise count rates for Quadrant A Data is divided into 100 sec bins |
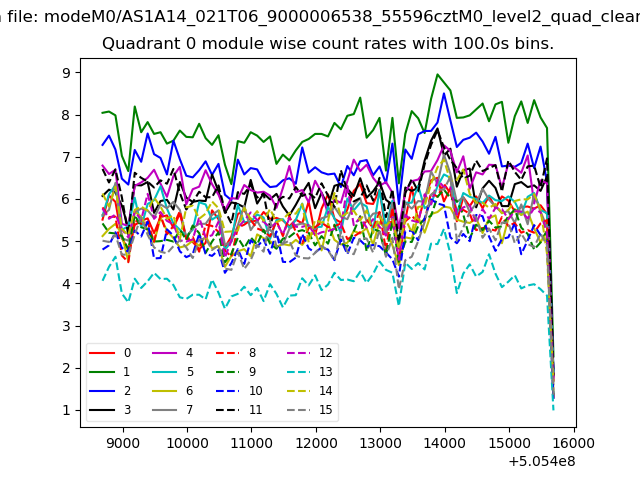 |
 |
| Module-wise count rates for Quadrant B Data is divided into 100 sec bins |
 |
 |
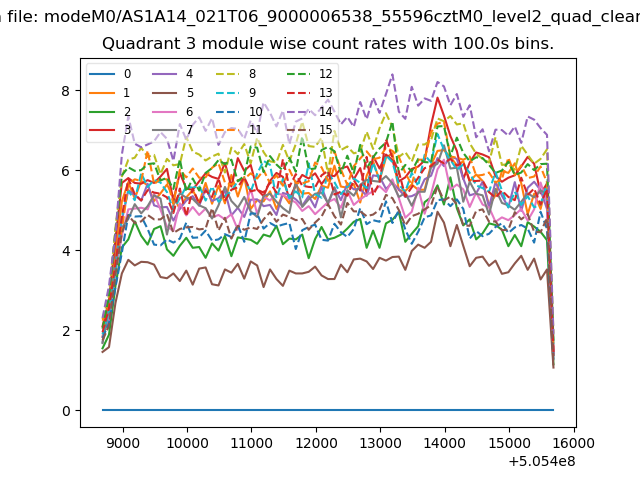
| Module-wise count rates for Quadrant C Data is divided into 100 sec bins |
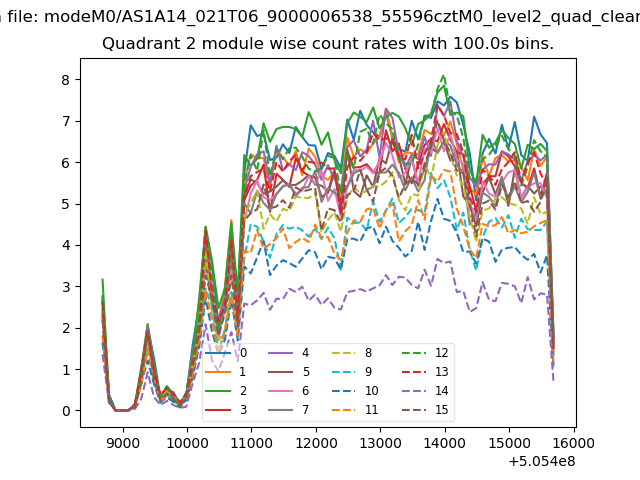 |
 |
| Module-wise count rates for Quadrant D Data is divided into 100 sec bins |
 |
 |
| Parameter | Plot |
|---|---|
| CZT HV Monitor | 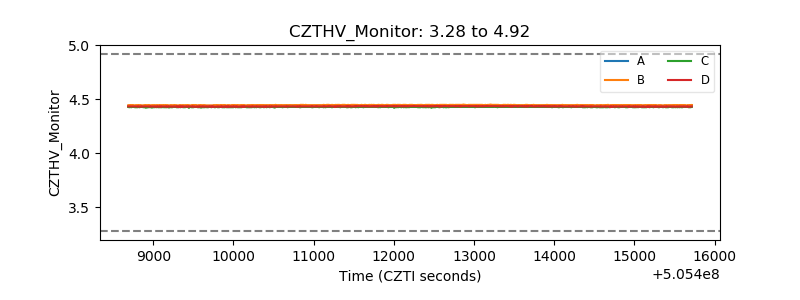 |
| D_VDD | 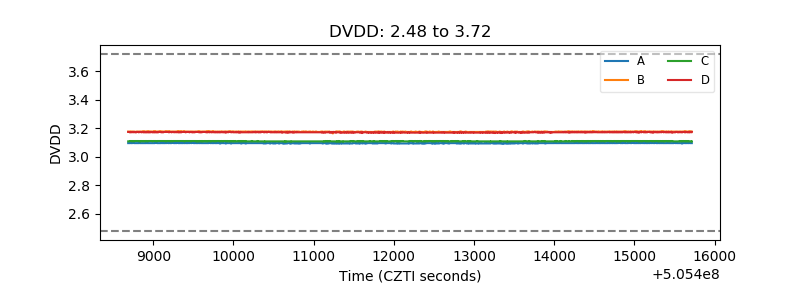 |
| Temperature 1 | 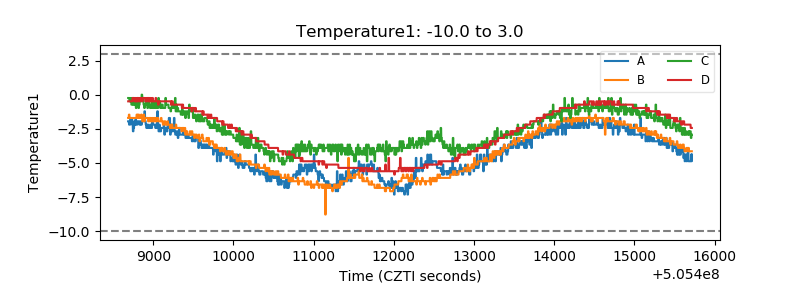 |
| Veto HV Monitor | 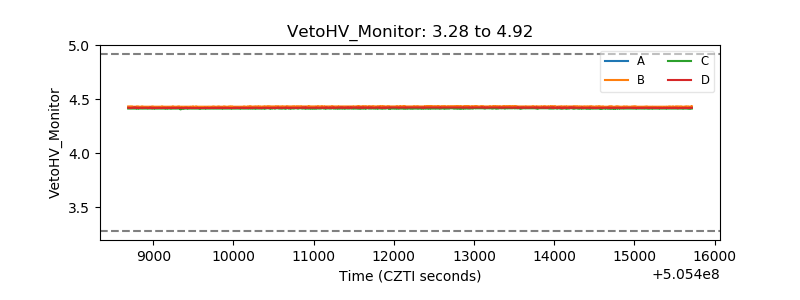 |
| Veto LLD | 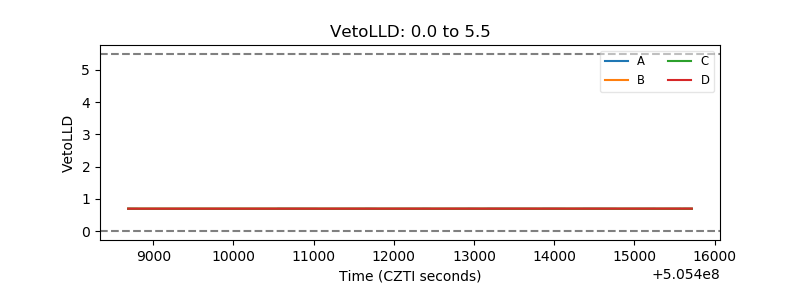 |
| Alpha Counter | 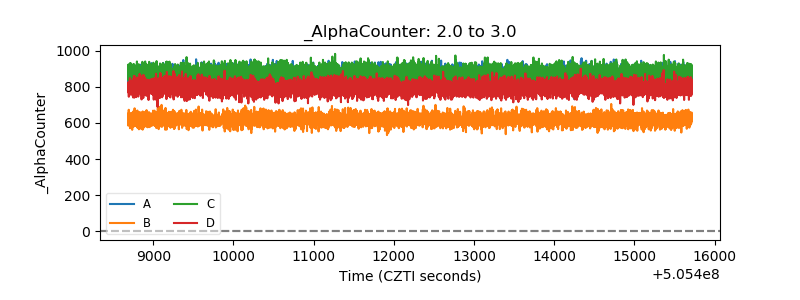 |
| _CPM_Rate | 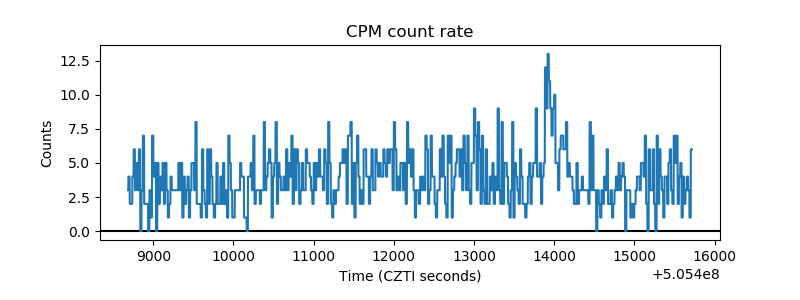 |
| CZT Counter | 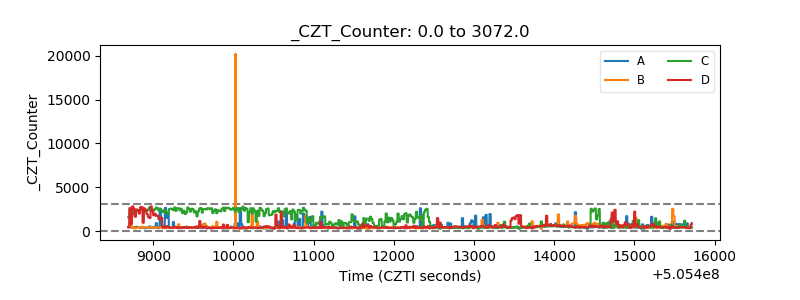 |
| +2.5 Volts monitor |  |
| +5 Volts monitor |  |
| _ROLL_ROT | 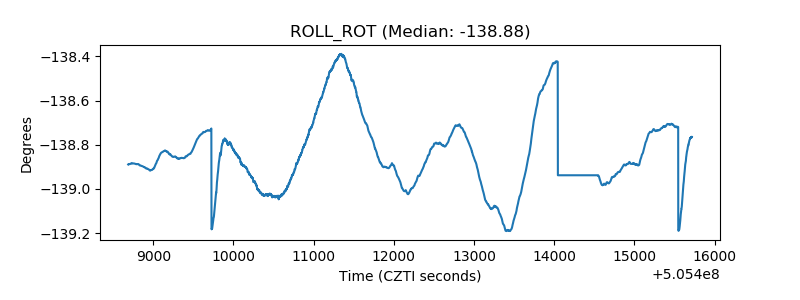 |
| _Roll_DEC | 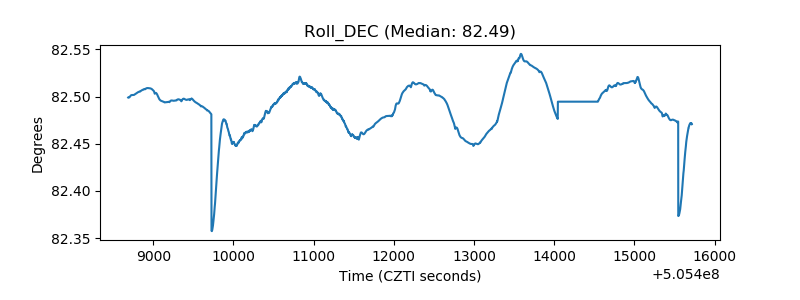 |
| _Roll_RA | 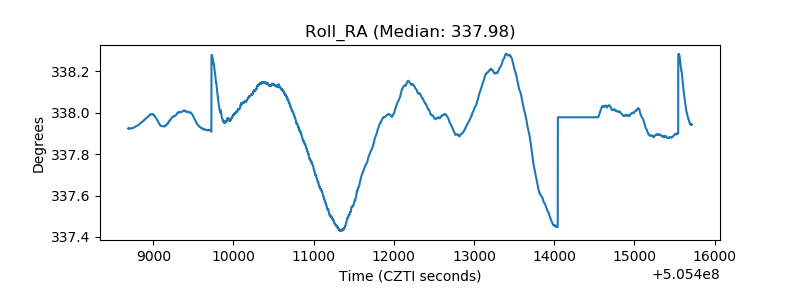 |
| Veto Counter | 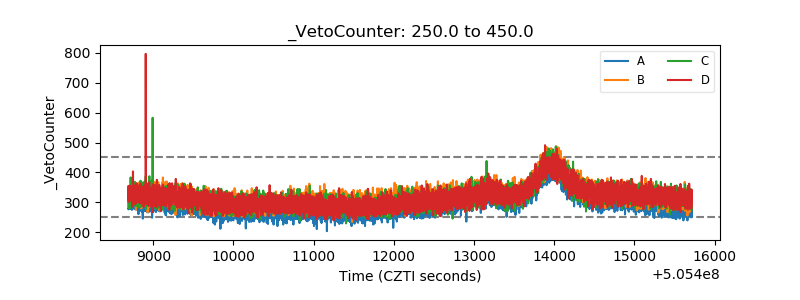 |