| Param | Original file | Final file |
|---|---|---|
| Filename | modeM0/AS1A14_021T06_9000006538_55597cztM0_level2.fits | modeM0/AS1A14_021T06_9000006538_55597cztM0_level2_quad_clean.evt |
| Size (bytes) | 480,712,320 | 105,664,320 |
| Size | 458.4 MB | 100.8 MB |
| Events in quadrant A | 4,028,422 | 692,051 |
| Events in quadrant B | 3,910,096 | 740,957 |
| Events in quadrant C | 5,382,073 | 620,424 |
| Events in quadrant D | 3,888,847 | 622,132 |
| Mode M0 | |||
|---|---|---|---|
| Quadrant | BADHDUFLAG | Total packets | Discarded packets |
| A | 0 | 17519 | 0 |
| B | 0 | 17027 | 0 |
| C | 0 | 21802 | 0 |
| D | 0 | 17225 | 0 |
| Mode SS | |||
|---|---|---|---|
| Quadrant | BADHDUFLAG | Total packets | Discarded packets |
| A | 0 | 150 | 0 |
| B | 0 | 150 | 0 |
| C | 0 | 150 | 0 |
| D | 0 | 150 | 0 |
| Quadrant | Total seconds | Saturated seconds | Saturation percentage |
|---|---|---|---|
| A | 7528 | 89 | 1.182253% |
| B | 7528 | 119 | 1.580765% |
| C | 7528 | 504 | 6.695005% |
| D | 7528 | 68 | 0.903294% |
Noise dominated data is calculated using 1-second bins in cleaned event files. If a bin has >2000 counts, and if more than 50% of those come from <1% of pixels, then it is considered to be noise-dominated and hence unusable.
| Quadrant | # 1 sec bins | Bins with >0 counts | Bins with >2000 counts | High rate bins dominated by noise | Noise dominated (total time) | Noise dominated (detector-on time) | Marked lightcurve |
|---|---|---|---|---|---|---|---|
| A | 7528 | 7528 | 79 | 79 | 1.05% | 1.05% | 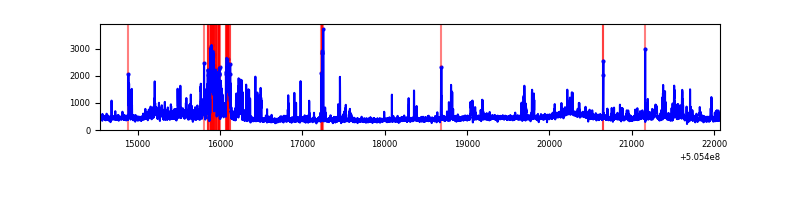 |
| B | 7528 | 7528 | 28 | 28 | 0.37% | 0.37% | 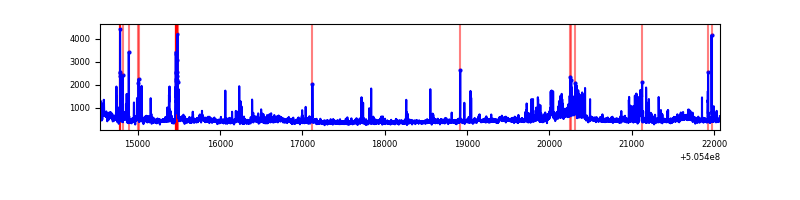 |
| C | 7528 | 7528 | 282 | 282 | 3.75% | 3.75% | 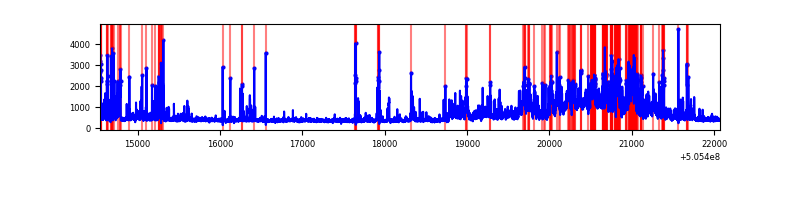 |
| D | 7528 | 7528 | 60 | 60 | 0.80% | 0.80% | 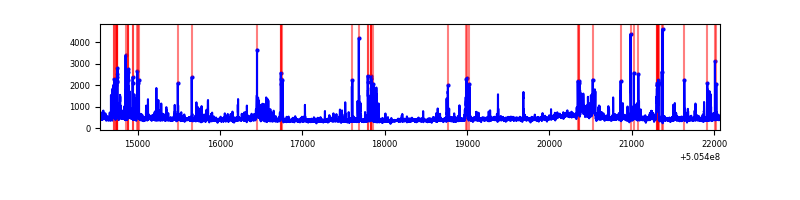 |
Top three noisy pixels from each quadrant. If the there are fewer than three noisy pixels in the level2.evt file, extra rows are filled as -1
| Pixel properties | Quadrant properties | ||||||
|---|---|---|---|---|---|---|---|
| Quadrant | DetID | PixID | Counts | Sigma | Mean | Median | Sigma |
| A | 4 | 159 | 542409 | 2773.78 | 776 | 757 | 195.3 |
| A | 8 | 249 | 254132 | 1297.52 | 776 | 757 | 195.3 |
| A | 15 | 32 | 106635 | 542.2 | 776 | 757 | 195.3 |
| B | 7 | 0 | 226963 | 1375.59 | 764 | 735 | 164.5 |
| B | 0 | 171 | 180881 | 1095.38 | 764 | 735 | 164.5 |
| B | 4 | 169 | 174030 | 1053.72 | 764 | 735 | 164.5 |
| C | 9 | 38 | 1765814 | 8710.38 | 742 | 733 | 202.6 |
| C | 13 | 16 | 267160 | 1314.77 | 742 | 733 | 202.6 |
| C | 13 | 3 | 104970 | 514.39 | 742 | 733 | 202.6 |
| D | 11 | 129 | 276241 | 1298.21 | 756 | 722 | 212.2 |
| D | 2 | 172 | 132673 | 621.73 | 756 | 722 | 212.2 |
| D | 2 | 249 | 117433 | 549.93 | 756 | 722 | 212.2 |
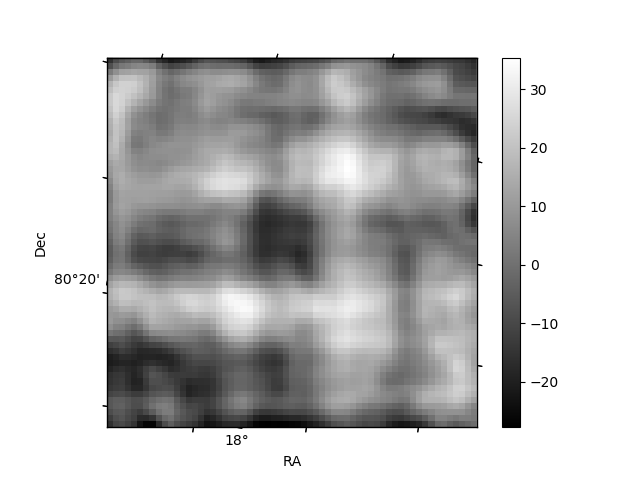
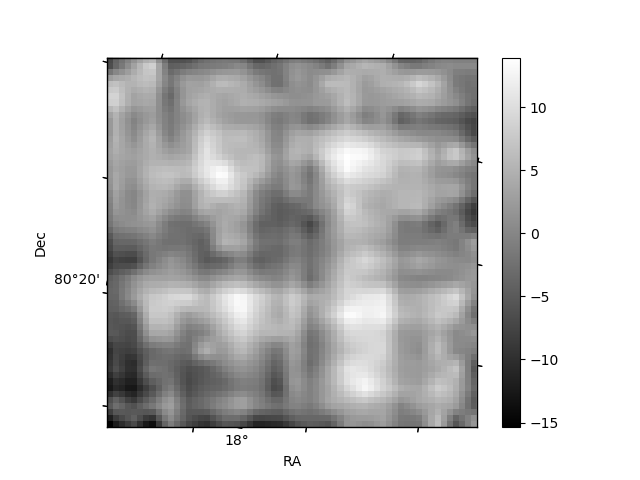
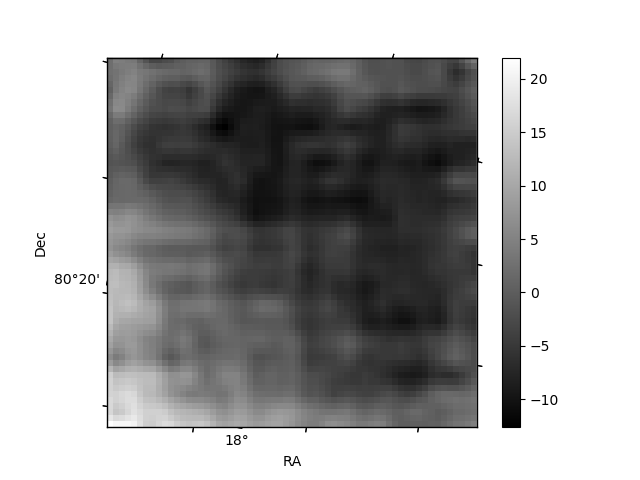
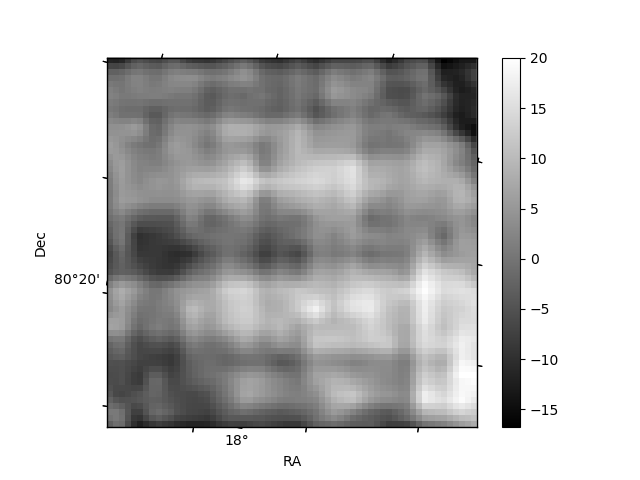
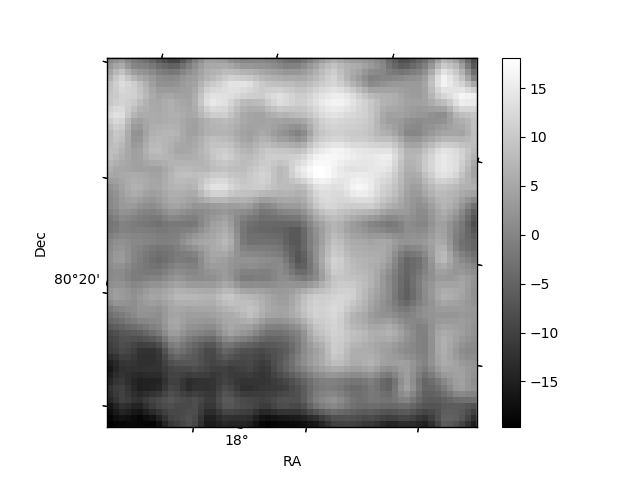
Histogram calculated using DETX and DETY for each event in the final _common_clean file
| Quadrant A | 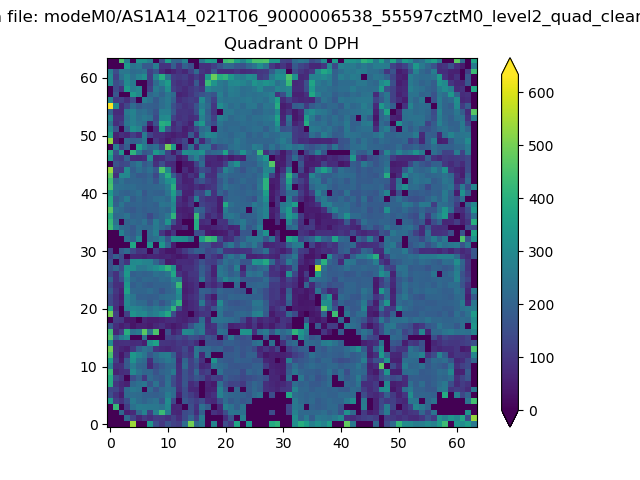 |
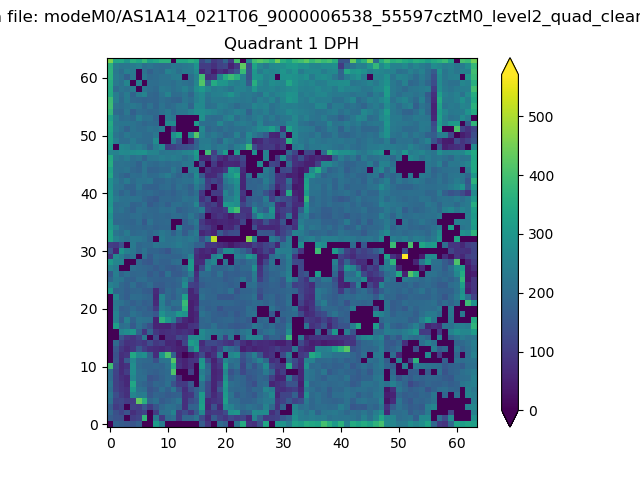 |
Quadrant B |
|---|---|---|---|
| Quadrant D | 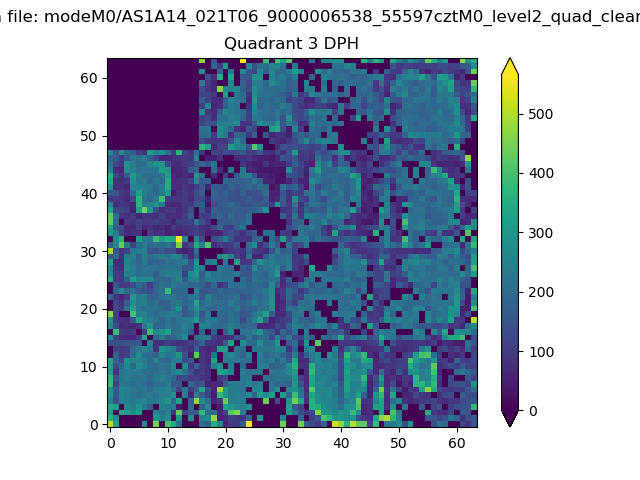 |
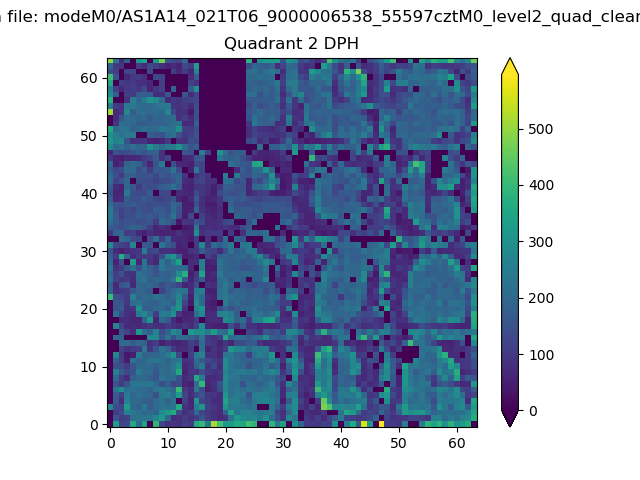 |
Quadrant C |
| Plot type | Count rate plots | Images |
|---|---|---|
| Comparison with Poisson distribution Blue bars denote a histogram of data divided into 1 sec bins. Red curve is a Poisson curve with rate = median count rate of data. |
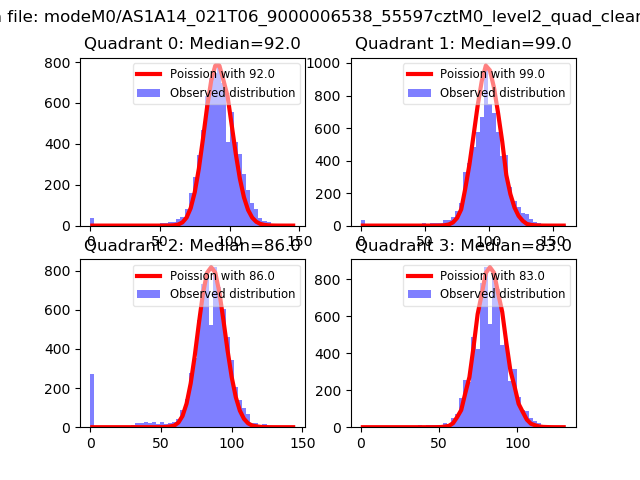 |
 |
| Quadrant-wise count rates Data is divided into 100 sec bins |
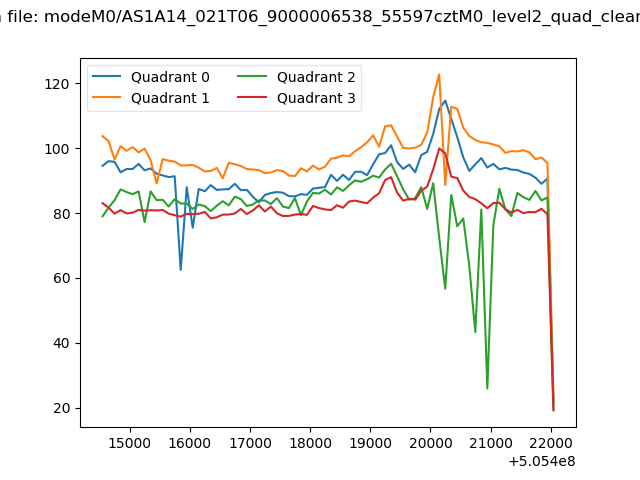 |
|
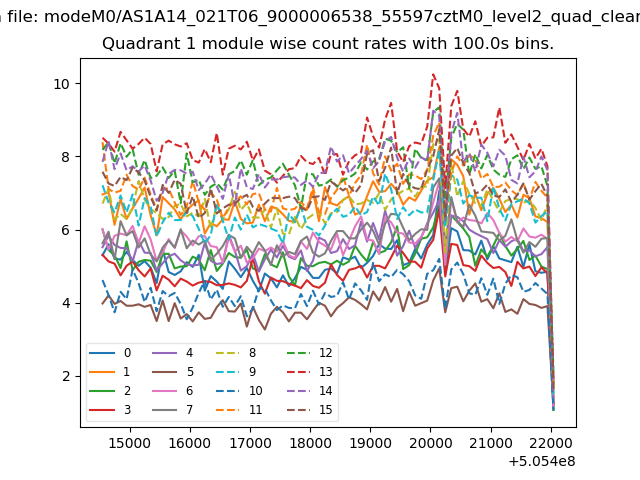
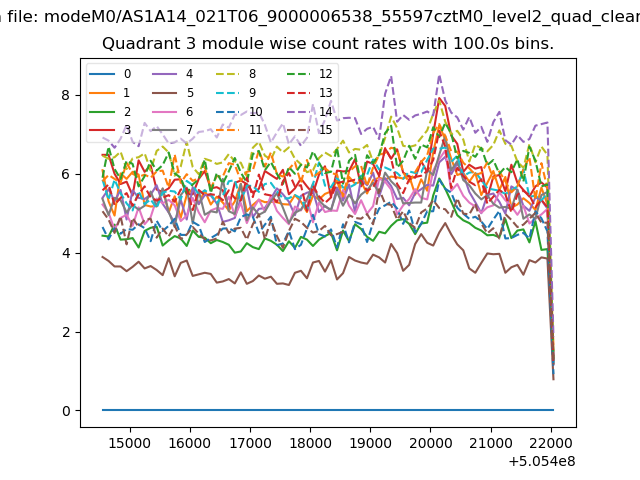
| Module-wise count rates for Quadrant A Data is divided into 100 sec bins |
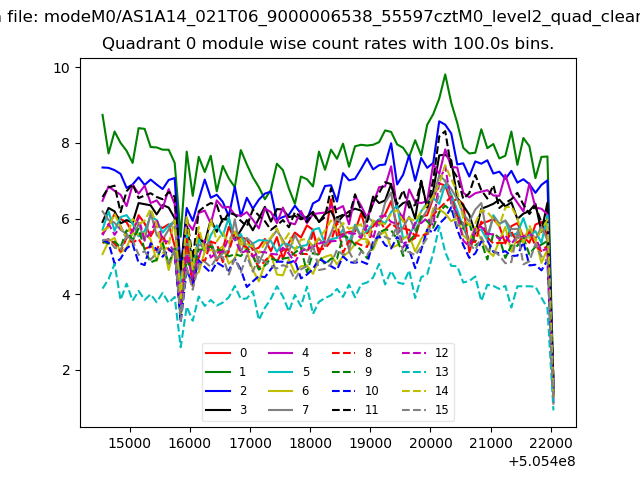 |
 |
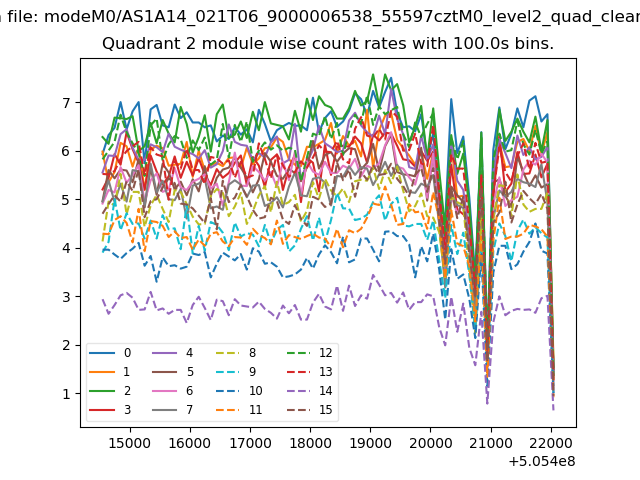
| Module-wise count rates for Quadrant B Data is divided into 100 sec bins |
 |
 |
| Module-wise count rates for Quadrant C Data is divided into 100 sec bins |
 |
 |
| Module-wise count rates for Quadrant D Data is divided into 100 sec bins |
 |
 |
| Parameter | Plot |
|---|---|
| CZT HV Monitor | 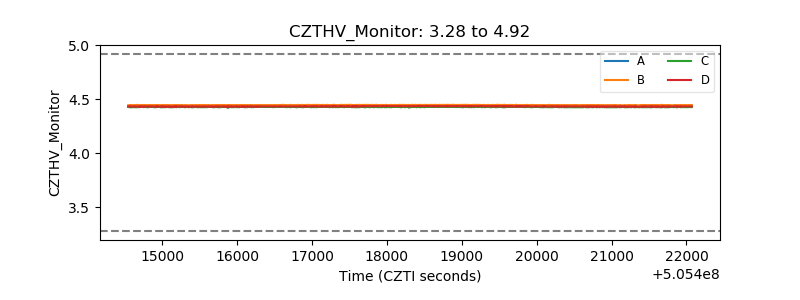 |
| D_VDD | 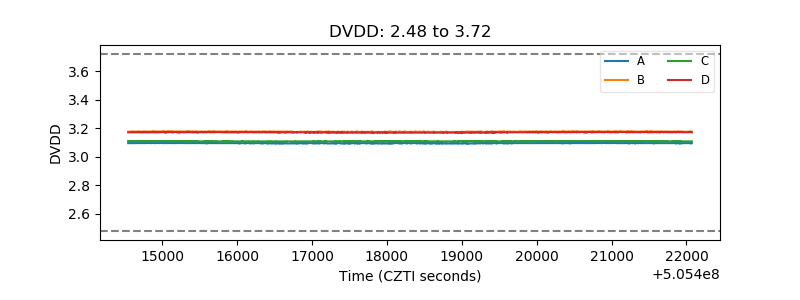 |
| Temperature 1 | 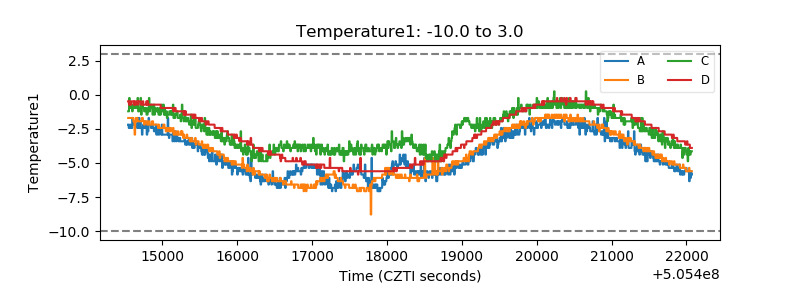 |
| Veto HV Monitor | 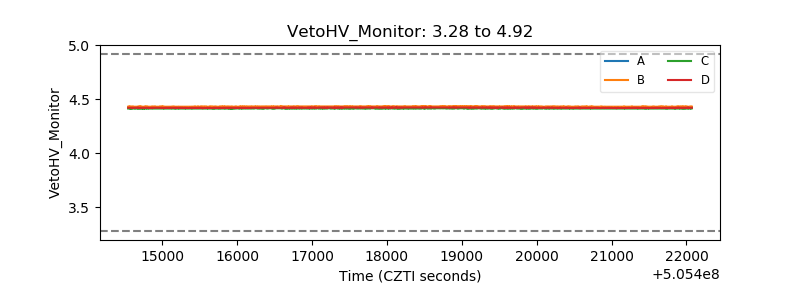 |
| Veto LLD | 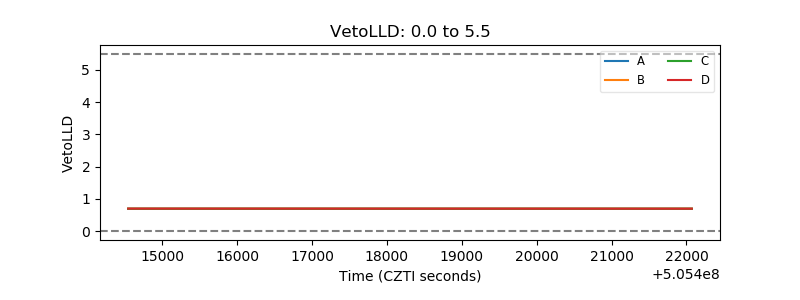 |
| Alpha Counter | 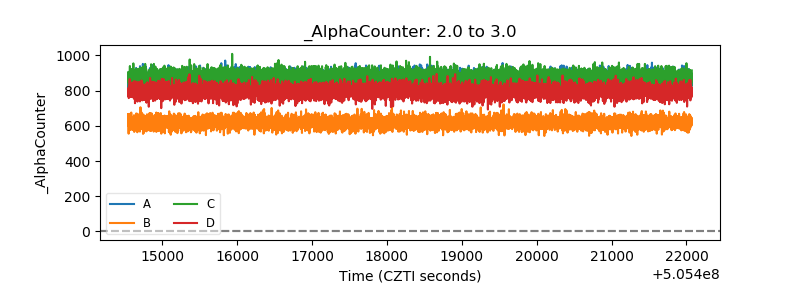 |
| _CPM_Rate | 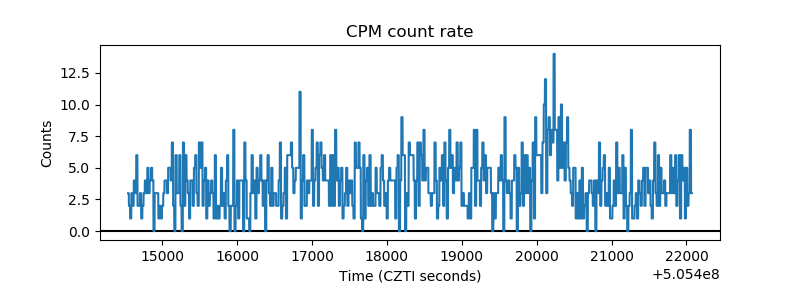 |
| CZT Counter | 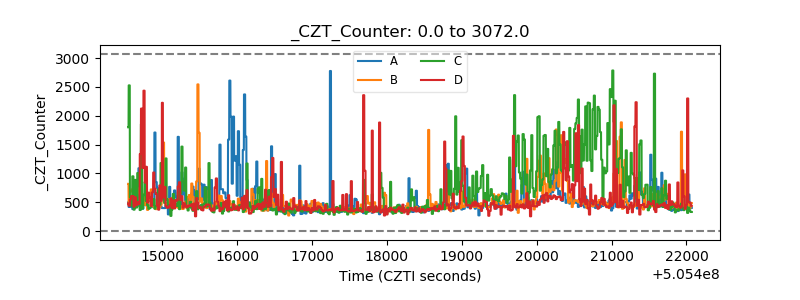 |
| +2.5 Volts monitor |  |
| +5 Volts monitor | 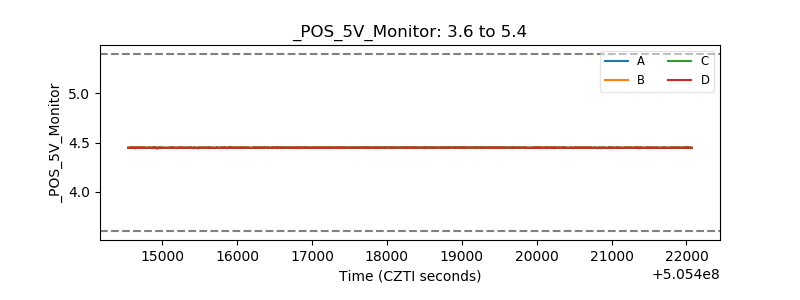 |
| _ROLL_ROT | 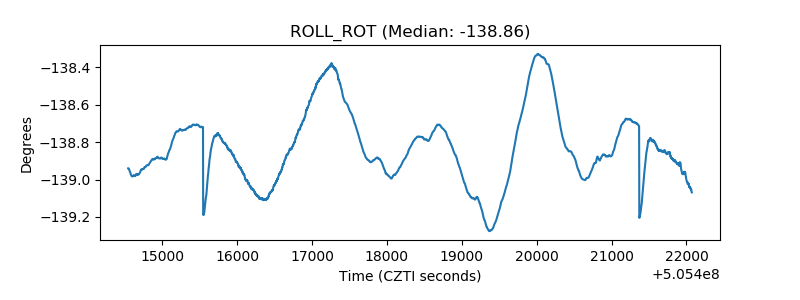 |
| _Roll_DEC | 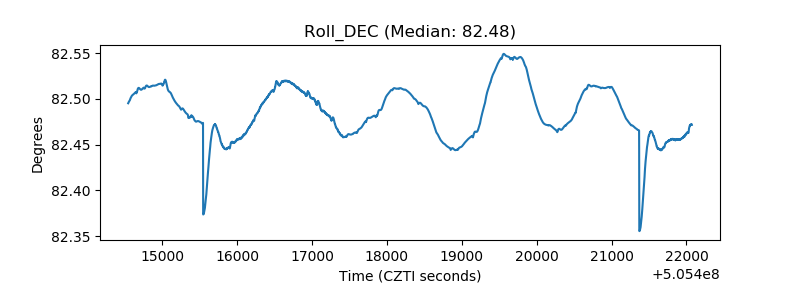 |
| _Roll_RA | 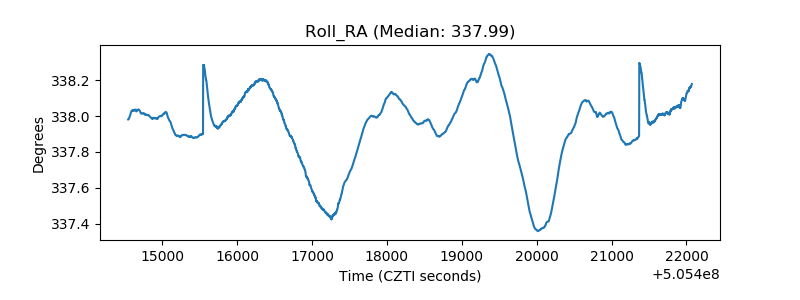 |
| Veto Counter | 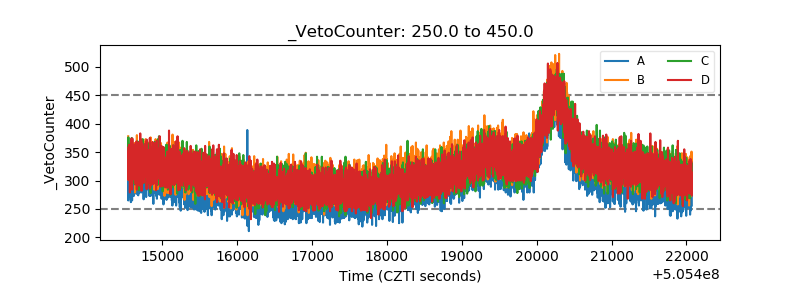 |