| Param | Original file | Final file |
|---|---|---|
| Filename | modeM0/AS1A14_021T06_9000006538_55600cztM0_level2.fits | modeM0/AS1A14_021T06_9000006538_55600cztM0_level2_quad_clean.evt |
| Size (bytes) | 1,262,920,320 | 271,010,880 |
| Size | 1.2 GB | 258.5 MB |
| Events in quadrant A | 13,882,796 | 1,714,699 |
| Events in quadrant B | 10,351,078 | 1,889,666 |
| Events in quadrant C | 10,827,200 | 1,649,263 |
| Events in quadrant D | 10,172,082 | 1,602,824 |
| Mode M9 | |||
|---|---|---|---|
| Quadrant | BADHDUFLAG | Total packets | Discarded packets |
| A | 0 | 14 | 0 |
| B | 0 | 14 | 0 |
| C | 0 | 14 | 0 |
| D | 0 | 14 | 0 |
| Mode M0 | |||
|---|---|---|---|
| Quadrant | BADHDUFLAG | Total packets | Discarded packets |
| A | 0 | 55412 | 3 |
| B | 0 | 45027 | 3 |
| C | 0 | 47540 | 3 |
| D | 0 | 44799 | 3 |
| Mode SS | |||
|---|---|---|---|
| Quadrant | BADHDUFLAG | Total packets | Discarded packets |
| A | 0 | 398 | 0 |
| B | 0 | 398 | 0 |
| C | 0 | 398 | 0 |
| D | 0 | 398 | 0 |
| Quadrant | Total seconds | Saturated seconds | Saturation percentage |
|---|---|---|---|
| A | 19586 | 856 | 4.370469% |
| B | 19587 | 435 | 2.220861% |
| C | 19587 | 682 | 3.481901% |
| D | 19587 | 164 | 0.837290% |
Noise dominated data is calculated using 1-second bins in cleaned event files. If a bin has >2000 counts, and if more than 50% of those come from <1% of pixels, then it is considered to be noise-dominated and hence unusable.
| Quadrant | # 1 sec bins | Bins with >0 counts | Bins with >2000 counts | High rate bins dominated by noise | Noise dominated (total time) | Noise dominated (detector-on time) | Marked lightcurve |
|---|---|---|---|---|---|---|---|
| A | 20941 | 19589 | 726 | 726 | 3.47% | 3.71% | 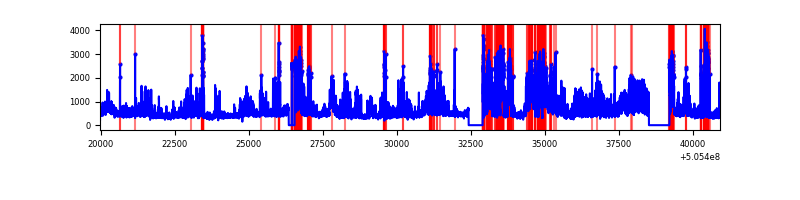 |
| B | 20942 | 19591 | 171 | 171 | 0.82% | 0.87% | 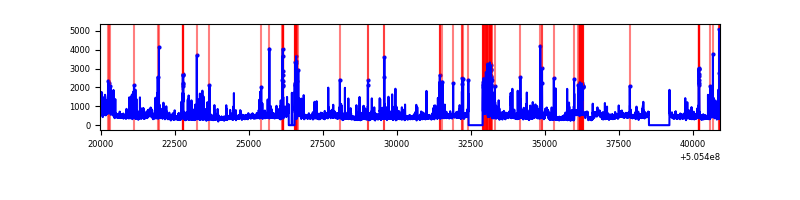 |
| C | 20942 | 19591 | 404 | 404 | 1.93% | 2.06% | 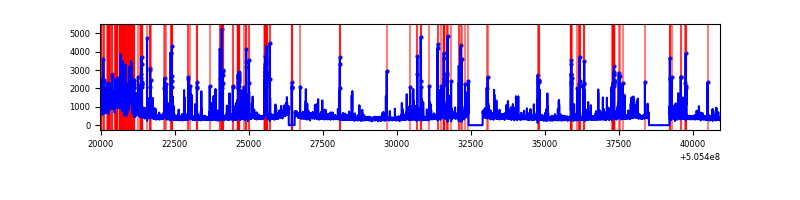 |
| D | 20942 | 19591 | 104 | 104 | 0.50% | 0.53% | 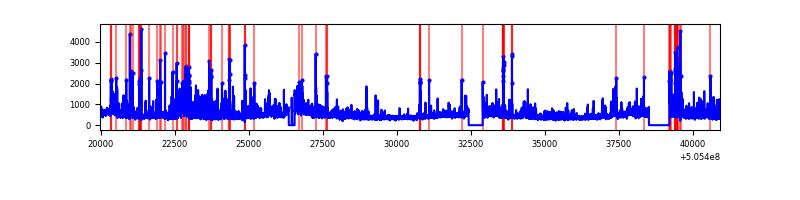 |
Top three noisy pixels from each quadrant. If the there are fewer than three noisy pixels in the level2.evt file, extra rows are filled as -1
| Pixel properties | Quadrant properties | ||||||
|---|---|---|---|---|---|---|---|
| Quadrant | DetID | PixID | Counts | Sigma | Mean | Median | Sigma |
| A | 12 | 115 | 3151852 | 6443.61 | 1986 | 1937 | 488.8 |
| A | 8 | 249 | 1596030 | 3260.95 | 1986 | 1937 | 488.8 |
| A | 3 | 14 | 843213 | 1720.95 | 1986 | 1937 | 488.8 |
| B | 5 | 236 | 996379 | 2360.45 | 1992 | 1913 | 421.3 |
| B | 5 | 185 | 325125 | 767.17 | 1992 | 1913 | 421.3 |
| B | 5 | 172 | 241624 | 568.97 | 1992 | 1913 | 421.3 |
| C | 9 | 38 | 1504510 | 2819.18 | 1958 | 1937 | 533.0 |
| C | 14 | 254 | 429804 | 802.78 | 1958 | 1937 | 533.0 |
| C | 6 | 223 | 384343 | 717.48 | 1958 | 1937 | 533.0 |
| D | 11 | 129 | 1068162 | 1919.19 | 1969 | 1878 | 555.6 |
| D | 2 | 62 | 392304 | 702.72 | 1969 | 1878 | 555.6 |
| D | 5 | 173 | 177696 | 316.45 | 1969 | 1878 | 555.6 |
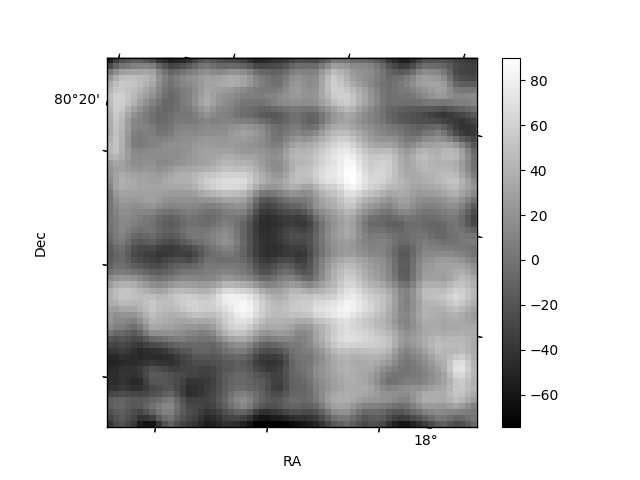
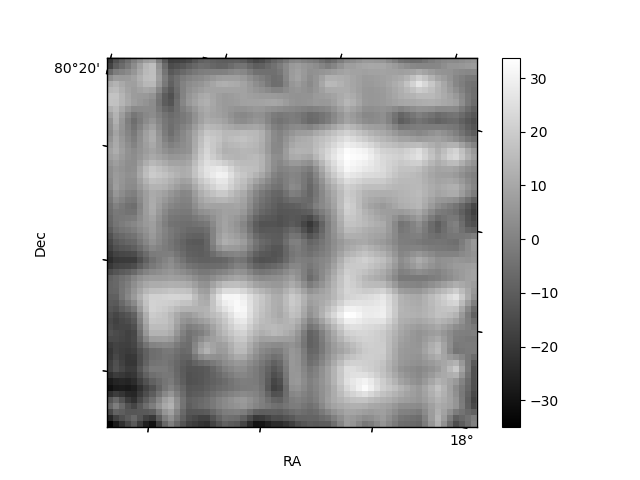
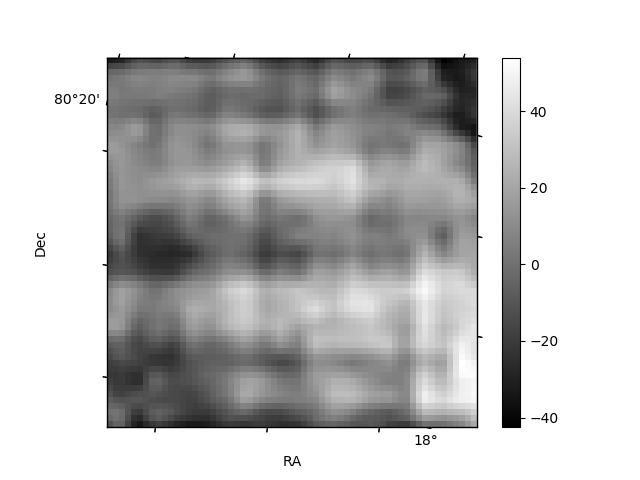
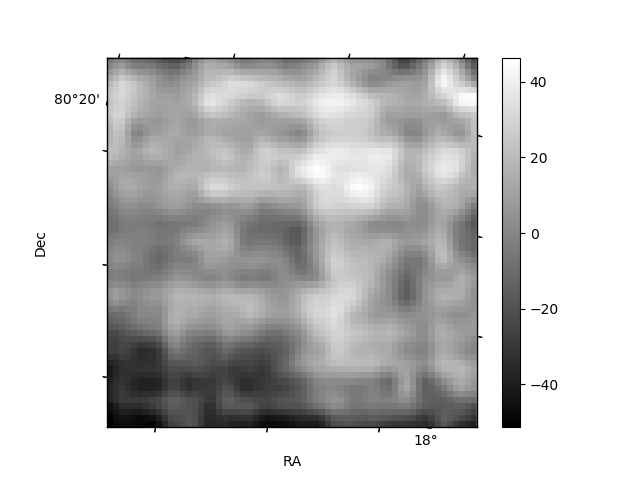
Histogram calculated using DETX and DETY for each event in the final _common_clean file
| Quadrant A | 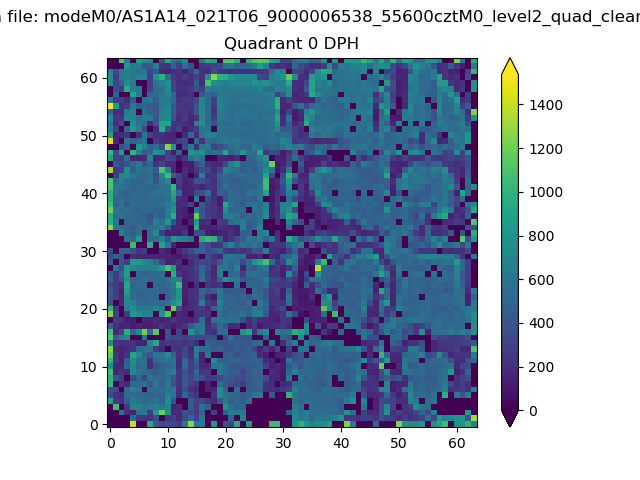 |
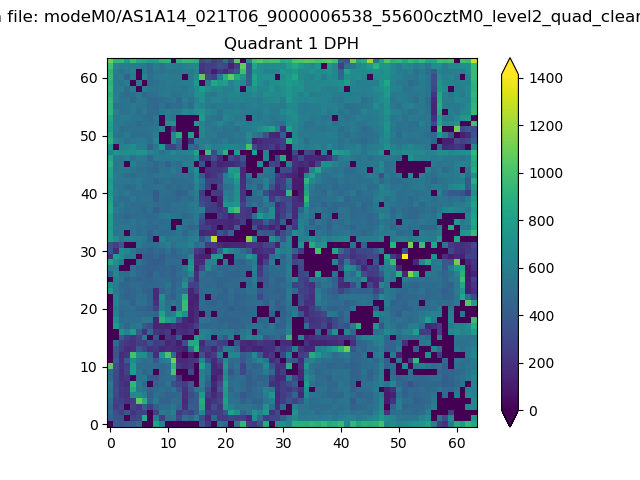 |
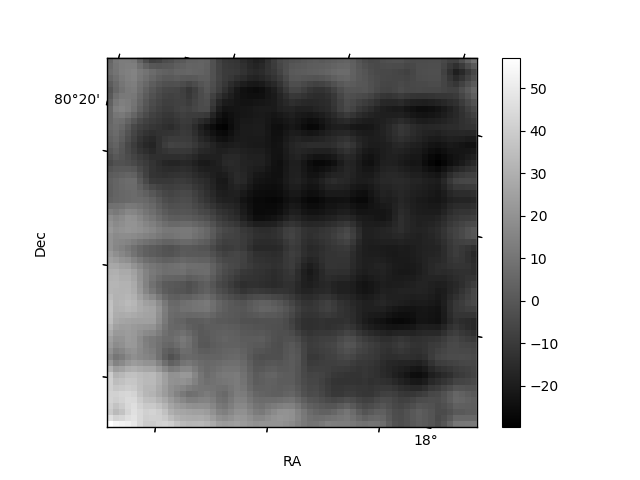
Quadrant B |
|---|---|---|---|
| Quadrant D | 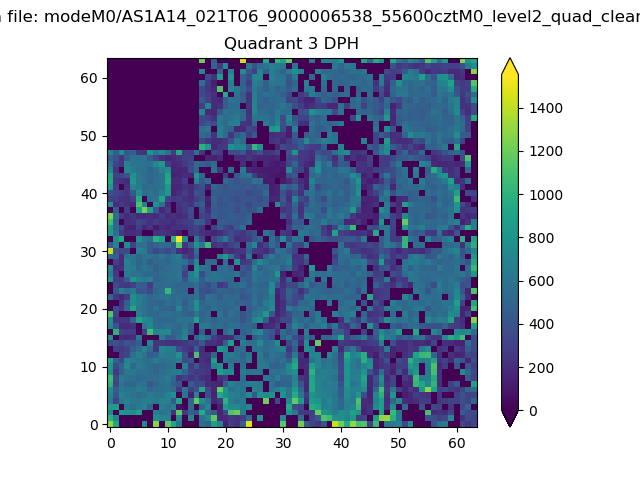 |
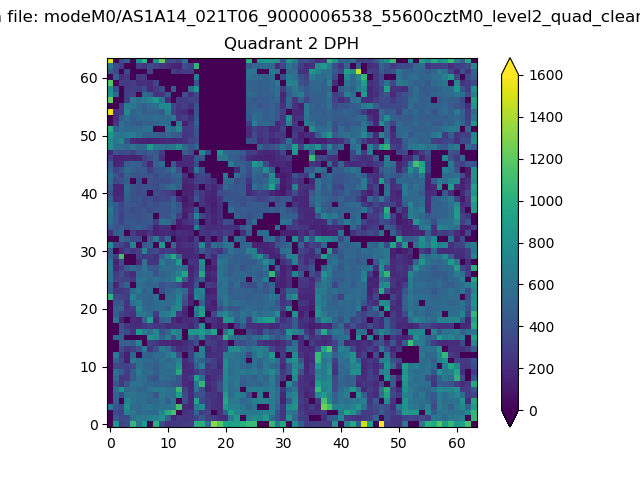 |
Quadrant C |
| Plot type | Count rate plots | Images |
|---|---|---|
| Comparison with Poisson distribution Blue bars denote a histogram of data divided into 1 sec bins. Red curve is a Poisson curve with rate = median count rate of data. |
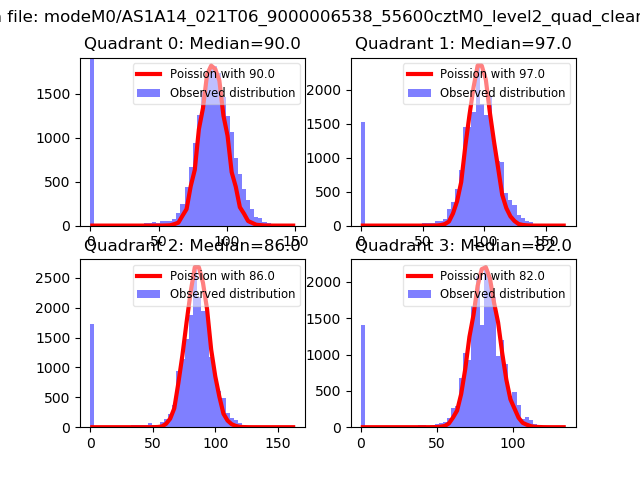 |
 |
| Quadrant-wise count rates Data is divided into 100 sec bins |
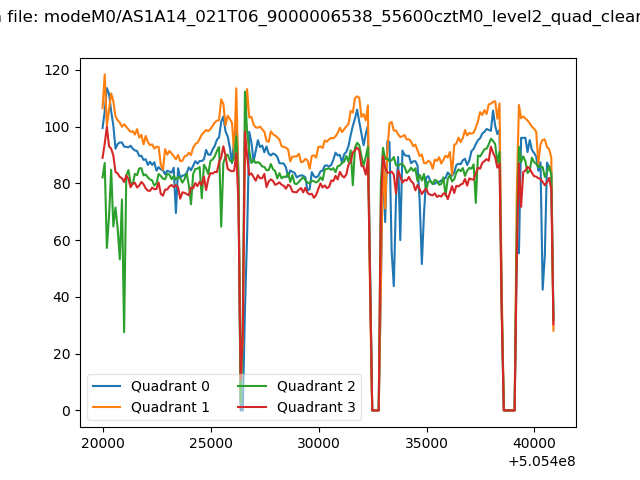 |
|
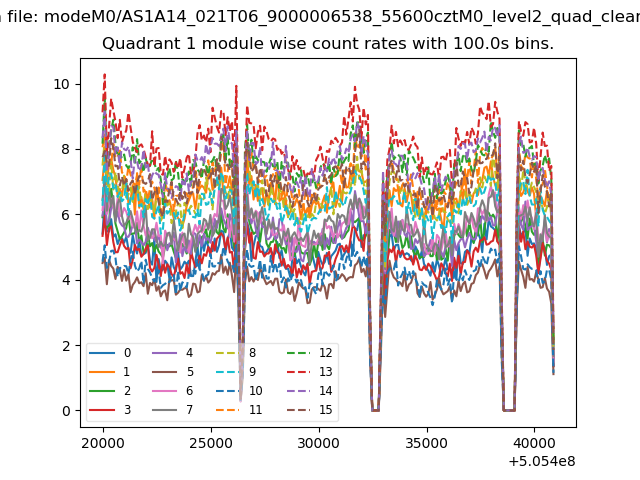
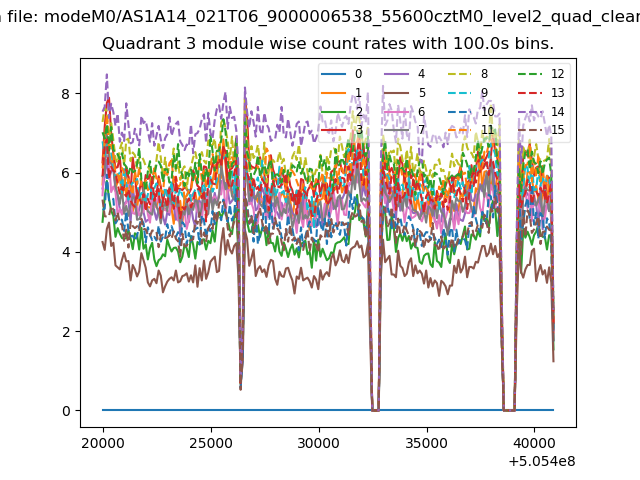
| Module-wise count rates for Quadrant A Data is divided into 100 sec bins |
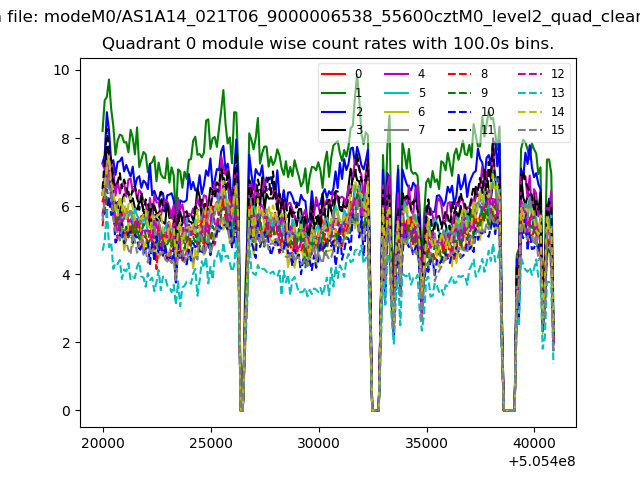 |
 |
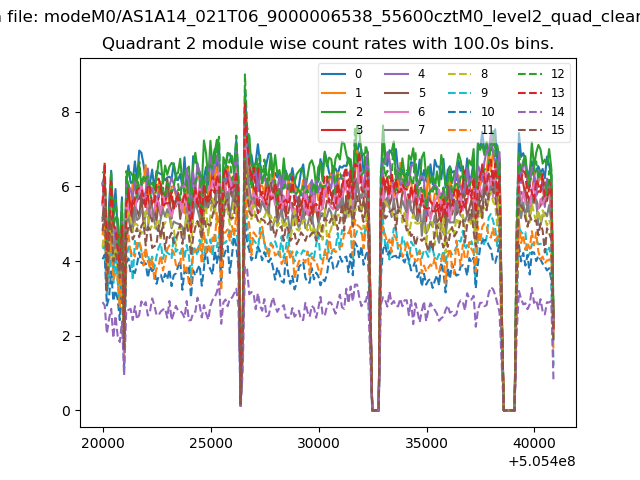
| Module-wise count rates for Quadrant B Data is divided into 100 sec bins |
 |
 |
| Module-wise count rates for Quadrant C Data is divided into 100 sec bins |
 |
 |
| Module-wise count rates for Quadrant D Data is divided into 100 sec bins |
 |
 |
| Parameter | Plot |
|---|---|
| CZT HV Monitor | 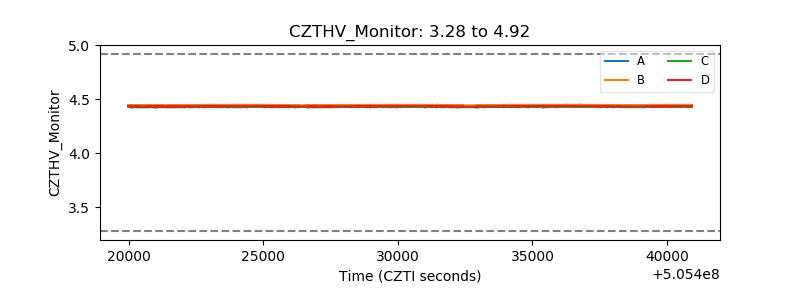 |
| D_VDD | 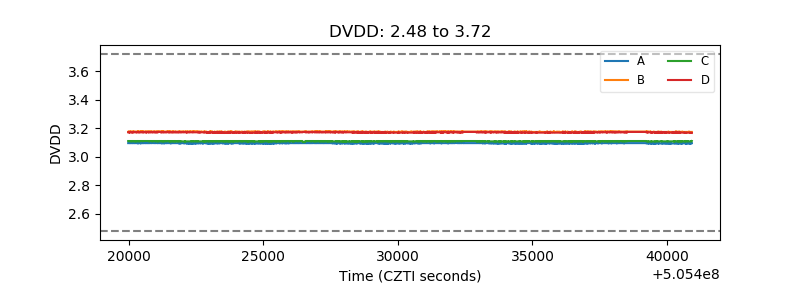 |
| Temperature 1 | 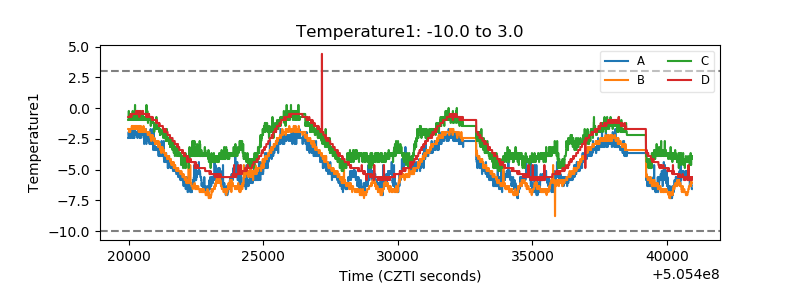 |
| Veto HV Monitor | 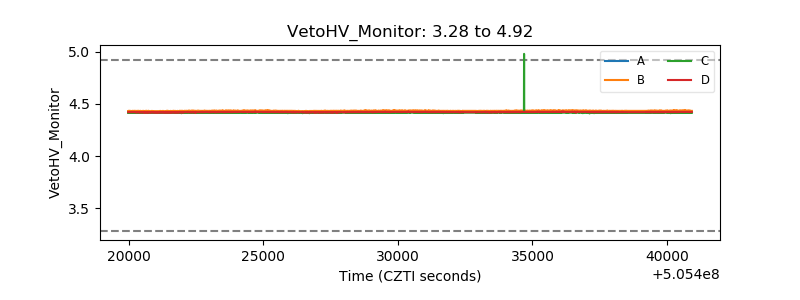 |
| Veto LLD | 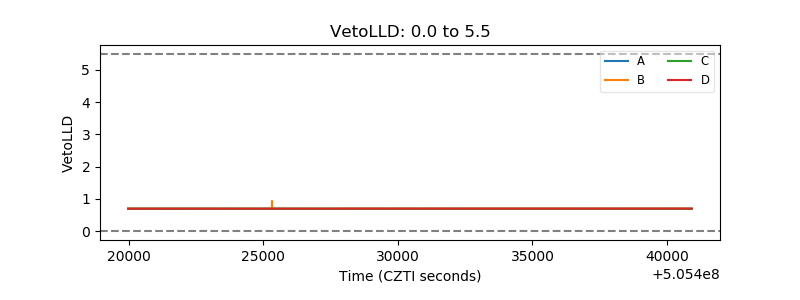 |
| Alpha Counter | 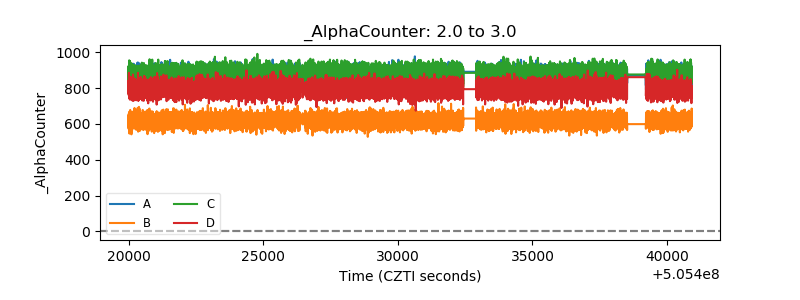 |
| _CPM_Rate | 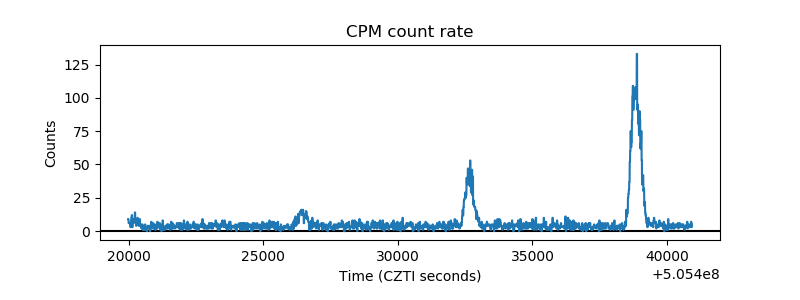 |
| CZT Counter | 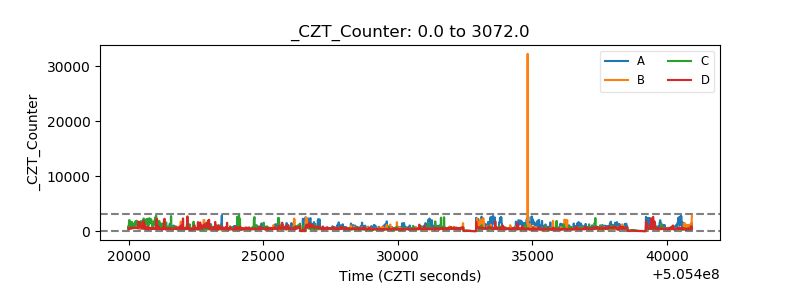 |
| +2.5 Volts monitor | 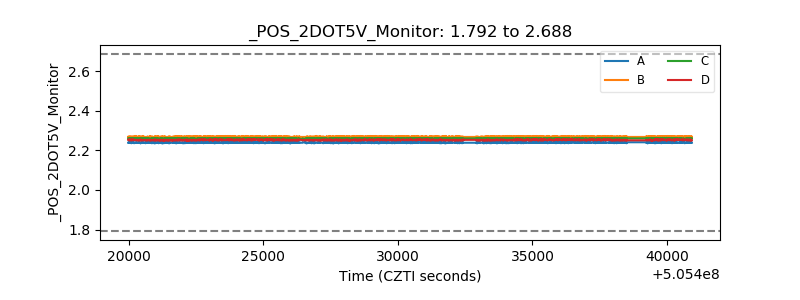 |
| +5 Volts monitor |  |
| _ROLL_ROT | 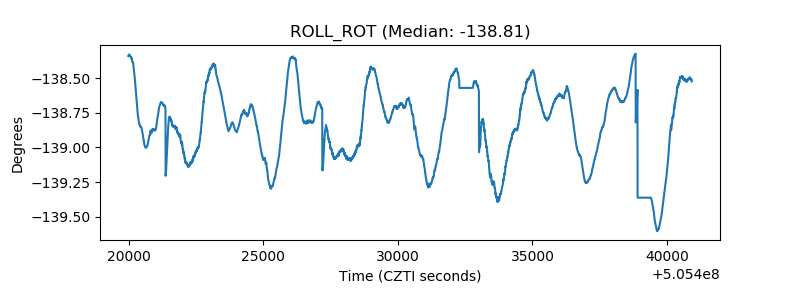 |
| _Roll_DEC | 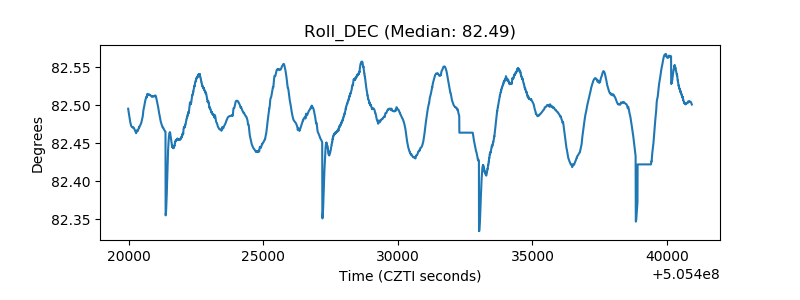 |
| _Roll_RA | 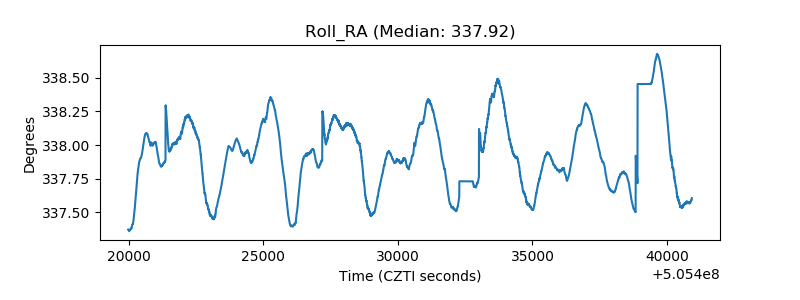 |
| Veto Counter | 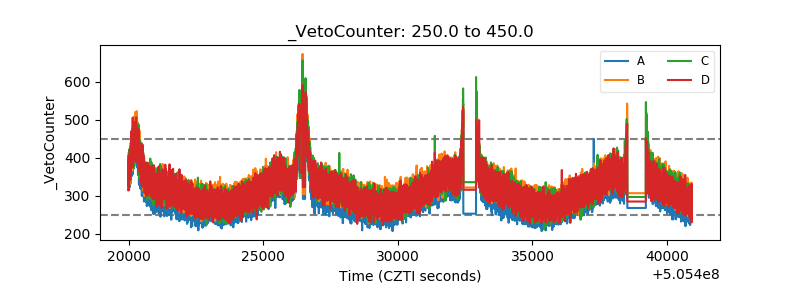 |